

Explain in easy to write
Phenytoin - Simple Explanation
1. How it is broken down (Metabolism)
- Phenytoin is mainly converted into an inactive form called 5-(4'-hydroxyphenyl)-5-phenylhydantoin (just remember: p-HPPH)
- This happens through liver enzymes called CYP450 (cytochrome P450)
- That inactive form can be further broken down into a catechol (a type of chemical)
- The catechol then oxidizes to form semiquinone and quinone - these can stick to proteins in the body (called covalent binding)
Simple version: Phenytoin → liver breaks it down → inactive products → some products can damage proteins
2. Gingival Enlargement (Gum Overgrowth)
- Phenytoin is reported to cause gum overgrowth (gingival enlargement) - see Figure 25.4
- It is highly protein-bound (87-95% of the drug sticks to proteins in blood)
- It has low clearance - meaning the body removes it slowly (only 6-20 mL/hr/kg)
3. How is it metabolized? (3 ways)
| Route | Amount |
|---|---|
| Mitochondria - oxidation | ~50% of dose |
| Mitochondria - oxidation | ~40% of dose |
| Glucuronidation (via CYP450) | Minor route (~10%) |
Simple version: Most of phenytoin (90%) is broken down through oxidation in mitochondria. Only a small amount goes through glucuronidation.
4. Another Anti-epileptic Causing Gum Overgrowth
- Valproic acid is mentioned as another anti-epileptic drug that can also cause similar effects
5. Vigabatrin
- Vigabatrin is a newer anti-epileptic drug
- It can also cause gingival overgrowth (gum enlargement)
- It accounts for approximately 10% of epileptic cases where gum overgrowth is seen (references 23, 24)
Key Points to Remember (Exam-Ready)
| Feature | Detail |
|---|---|
| Drug | Phenytoin |
| Metabolism | CYP450 → p-HPPH (inactive) |
| Protein binding | 87-95% |
| Clearance | Low (6-20 mL/hr/kg) |
| Side effect | Gingival (gum) overgrowth |
| Other drugs with same side effect | Valproic acid, Vigabatrin |
| Main metabolic routes | Mitochondrial oxidation (50% + 40%) + glucuronidation (10%) |
Flowchart
A clean medical flowchart about Phenytoin metabolism and side effects. The flowchart should show: Start box: "PHENYTOIN (Anti-epileptic Drug)" at the top center Arrow down to: "Administered orally | Highly protein-bound (87-95%) | Low clearance: 6-20 mL/hr/kg" Arrow down to a box: "Metabolism via CYP450 Enzymes (Liver)" Then split into 3 branches: Branch 1 (left): "Mitochondrial Oxidation ~50% of dose" Branch 2 (center): "Mitochondrial Oxidation ~40% of dose" Branch 3 (right): "Glucuronidation (CYP450) ~10% of dose (Minor Route)" All 3 branches merge into: "→ Inactive metabolite: p-HPPH (5-(4'-hydroxyphenyl)-5-phenylhydantoin)" Arrow down to: "Further broken down to CATECHOL" Arrow down to: "Oxidizes → Semiquinone & Quinone" Arrow down to: "Covalently binds to Proteins (Tissue damage)" Separate side branch from PHENYTOIN box going right: "SIDE EFFECTS" box with: - Gingival Overgrowth (Gum Enlargement) - Other drugs causing same: Valproic Acid, Vigabatrin (~10% of epileptic cases) Use a white background, blue and teal color scheme, clear arrows, neat boxes with rounded corners, professional medical textbook style, easy to read fonts.
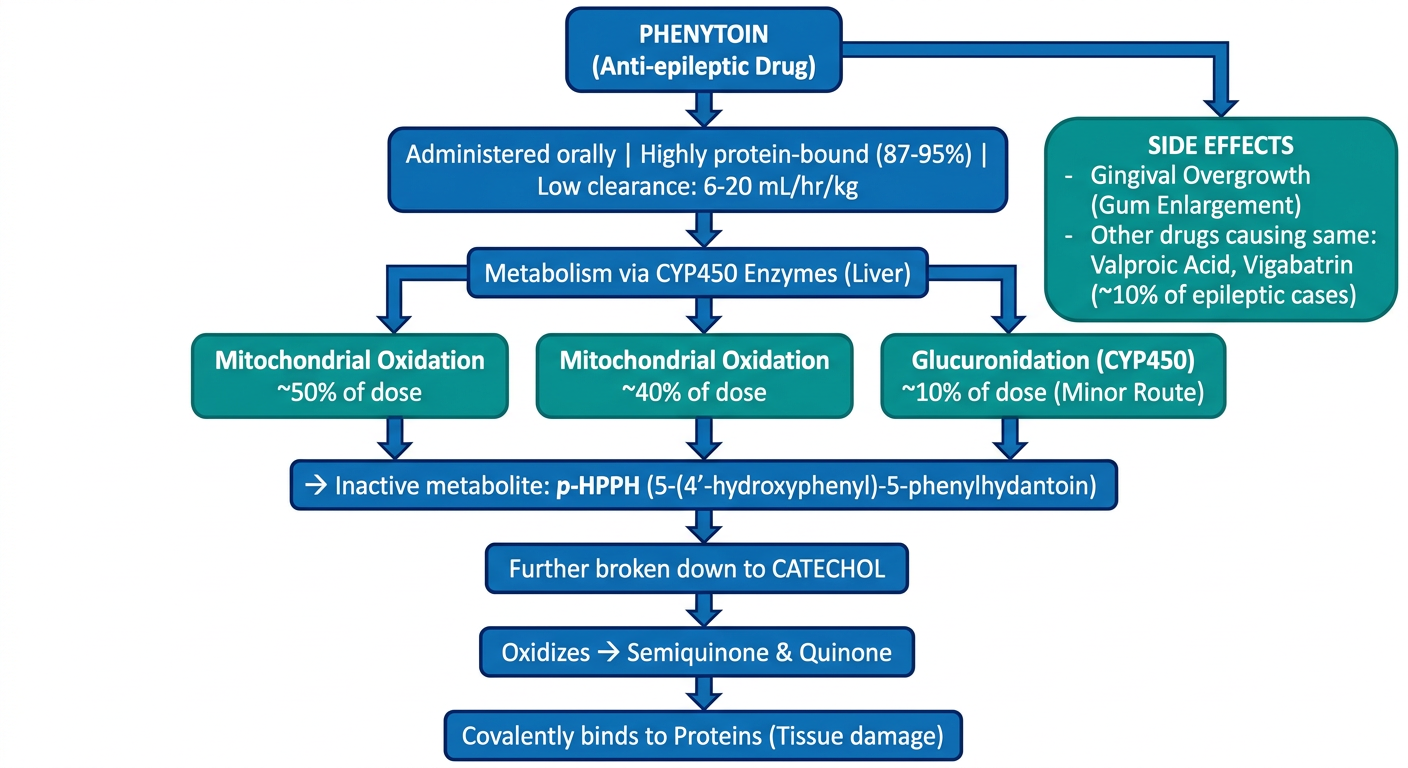
- Drug properties (protein binding, clearance)
- 3 metabolic routes (50% + 40% oxidation + 10% glucuronidation)
- Metabolic pathway (Phenytoin → p-HPPH → Catechol → Quinones → Protein binding)
- Side effects (gingival overgrowth + other causative drugs)