
Ecg
What would you like to know about ECG?
St t changes coronary and non coronary
ST segment T wave changes ECG ischemia coronary
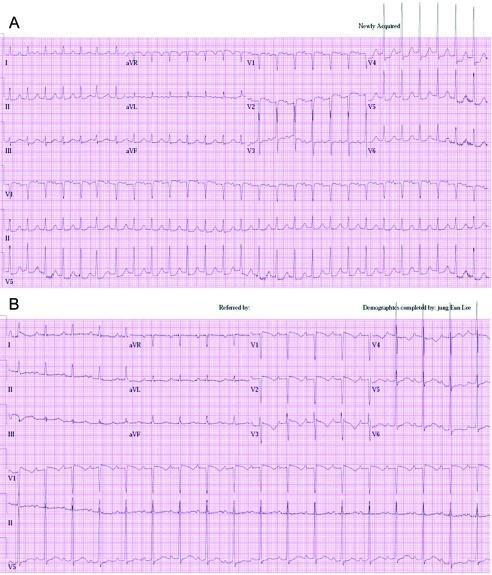
This diagnostic image displays two 12-lead electrocardiograms (ECGs), labeled A and B, illustrating dynamic ST-segment changes in a clinical setting. Panel A shows a tachycardic rhythm with significant horizontal and downsloping ST-segment depression in the lateral precordial leads (V4, V5, and V6), indicative of acute myocardial ischemia. Corresponding T-wave flattening or inversion is also visible in these leads. Panel B presents a follow-up ECG of the same patient after resolution of symptoms, demonstrating a return of the heart rate to baseline and the recovery of the ST segments toward the isoelectric line. The T-waves in leads V4-V6 show improved morphology and are more upright compared to the initial tracing. This comparison chart is an educational resource for cardiology and emergency medicine, highlighting the ECG manifestations of demand-induced ischemia or acute coronary syndrome and the subsequent normalization following clinical stabilization.
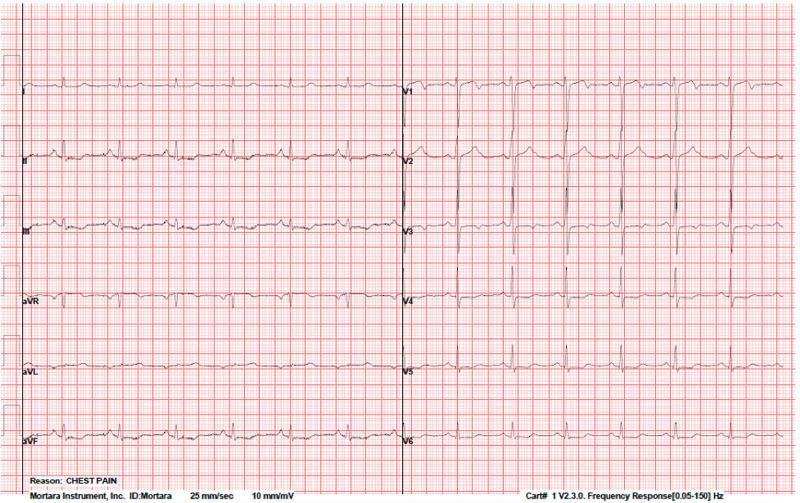
A 12-lead electrocardiogram (ECG) recorded at standard settings (25 mm/sec, 10 mm/mV) showing a normal sinus rhythm with significant ischemia-related ST-segment changes. The tracing demonstrates mild ST-segment depression in the inferior leads (II, III, and aVF) and across the precordial leads (V3 through V6). The R-wave progression in the precordial leads (V1-V6) is within normal limits, with the R-wave amplitude increasing appropriately from right to left chest leads. T-waves appear predominantly upright in the leads where ST depression is present. These findings are clinically significant for myocardial ischemia, particularly in a patient presenting with chest pain, and may indicate underlying coronary artery disease or spontaneous coronary artery dissection (SCAD). The ECG provides a baseline for evaluating evolutionary changes post-intervention, such as after percutaneous coronary intervention (PCI).
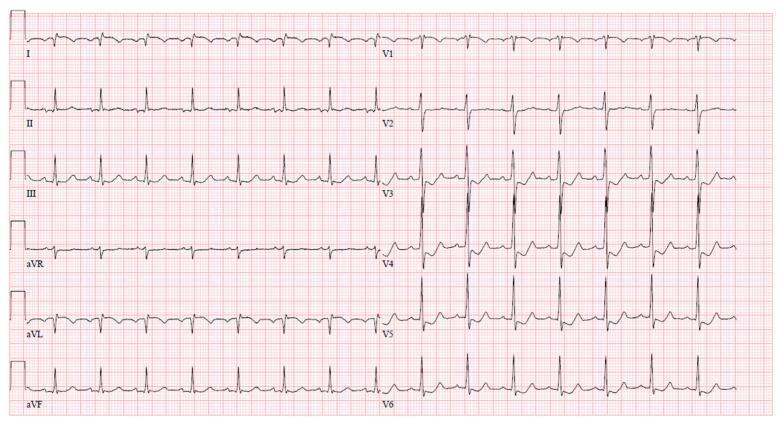
A standard 12-lead diagnostic electrocardiogram (ECG) recorded on pink grid paper, demonstrating dynamic ischemic changes consistent with unstable angina or coronary vasospasm. The tracing shows a regular sinus rhythm with narrow QRS complexes. Key pathologic findings include ST-segment elevation in high lateral leads I and aVL, accompanied by deep T-wave inversions in the same leads. Significant horizontal to downsloping ST-segment depression is visible across the precordial leads V3 through V6. These visual findings represent acute myocardial ischemia and demonstrate the reciprocal relationship often seen between lateral and precordial distributions. The educational focus is on the recognition of ST-segment morphology changes and T-wave abnormalities in a clinical critical care setting following coronary angiography.
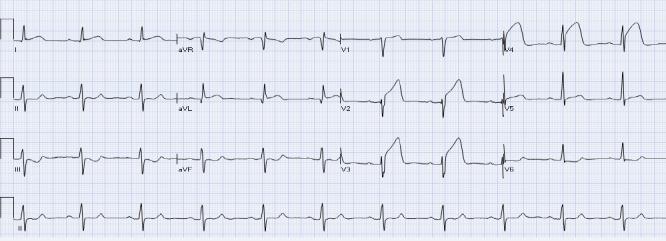
This diagnostic image is a 12-lead electrocardiogram (ECG) demonstrating an acute anterior ST-elevation myocardial infarction (STEMI). The tracing reveals significant concave ST-segment elevation in the high lateral lead aVL and the anterior precordial leads V2, V3, and V4. These findings are highly suggestive of a proximal occlusion of the left anterior descending (LAD) coronary artery. Accompanying these changes is evident reciprocal ST-segment depression in the inferior leads III and aVF, which confirms the acute nature of the ischemic event. The ECG also shows hyperacute T waves in the affected precordial leads and preserved R-wave progression in the early stages of this infarction. This visual material is a primary educational resource for cardiology and emergency medicine, teaching the identification of ST-segment changes and the concept of reciprocal leads in localizing myocardial ischemia.
ST T wave changes non-coronary causes ECG pericarditis LVH
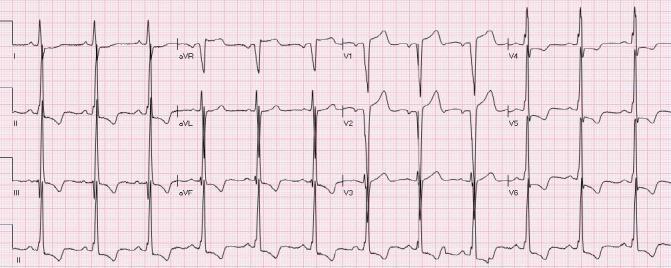
This diagnostic image is a 12-lead electrocardiogram (ECG) demonstrating secondary repolarization abnormalities associated with Left Ventricular Hypertrophy (LVH). Key diagnostic findings include voltage criteria for LVH, characterized by high-amplitude QRS complexes in the precordial leads. Distinct ST-segment and T-wave changes are present: non-ischemic ST elevation (STE) is visible in lead aVR and the right precordial leads V1-V3. Conversely, prominent ST-segment depression with concomitant T-wave inversion (strain pattern) is observed in the lateral and inferior leads, specifically leads I, II, III, aVF, and V4-V6. These findings illustrate the 'strain pattern' of LVH, which is a critical differential diagnosis for ST-segment elevation myocardial infarction (STEMI). The tracing serves as an educational example of how chronic structural heart changes can mimic or mask acute coronary syndromes, emphasizing the importance of recognizing voltage criteria and the distribution of repolarization deviations in clinical cardiology.
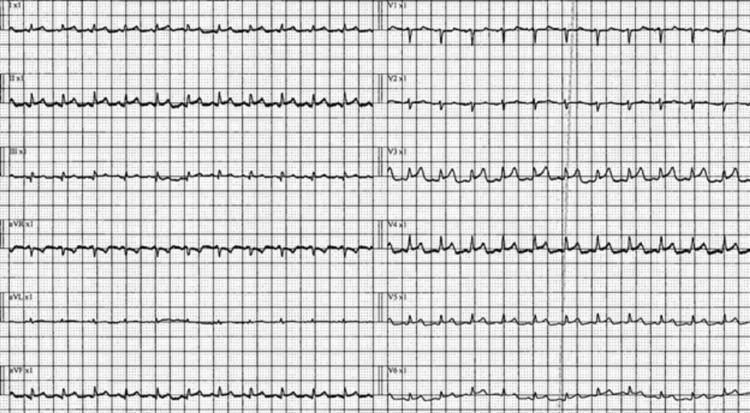
Diagnostic Image: A 12-lead electrocardiogram (ECG) displayed on a standard grid, demonstrating key pathological findings consistent with acute pericarditis. The tracing shows a narrow complex sinus tachycardia with a notably shortened PR interval. There is widespread, concave (upward) diffuse ST-segment elevation visible across multiple limb leads (I, II, aVL, aVF) and precordial leads (V2-V6). Corresponding ST-segment depression is noted in lead aVR, which is a classic reciprocal change in pericarditis. T-wave abnormalities are present, including varying morphology such as flattening or peaking that does not consistently correlate with QRS polarity. Low voltage may be present in the limb leads. This ECG serves as a primary educational example of inflammatory cardiac involvement, illustrating the transition from isoelectric lines to diffuse ST-segment changes that do not follow a specific coronary artery territory, distinguishing it from localized myocardial infarction.
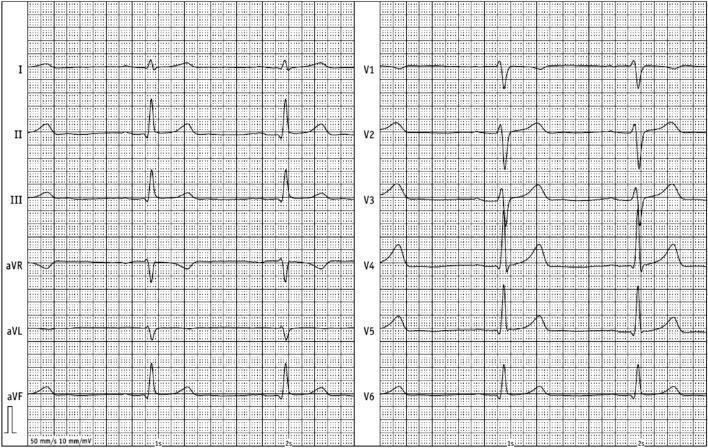
This diagnostic image is a 12-lead electrocardiogram (ECG/EKG) demonstrating classic features associated with acute pericarditis. The tracing shows widespread ST-segment changes across multiple vascular territories. Specifically, there are concave, 'saddle-back' ST-segment elevations most prominent in the inferior leads (II, III, aVF) and lateral precordial leads (V4, V5, V6). Corresponding PR-segment depression is visible in the same leads, while lead aVR shows reciprocal ST-segment depression and PR-segment elevation. The T waves are generally upright and symmetric in the leads with ST elevation, although slight inversion is noted in lead aVR and aVL. The rhythm appears to be a normal sinus rhythm with a regular rate. These diffuse repolarization abnormalities, characterized by their non-concordance with a single coronary artery distribution and the saddle-back morphology, are key educational indicators for differentiating pericardial inflammation from acute myocardial infarction. The image serves as a clinical example of cardiac repolarization changes in the context of pericarditis and pericardial effusion.
ST-T Changes on ECG: Coronary vs Non-Coronary
Part 1: CORONARY (Ischemic) ST-T Changes
Pathophysiology
- Subendocardial ischemia → ST vector points toward the ventricular cavity → overlying leads show ST depression
- Transmural/epicardial ischemia → ST vector points outward → overlying leads show ST elevation
A. ST Elevation (STEMI Pattern)
| ST Elevation in Leads | Territory | Culprit Artery |
|---|---|---|
| V1-V6 or LBBB | Anterior + septal | Proximal LAD or Left Main |
| V1-V2 | Septum | Proximal LAD / septal branch |
| V2-V4 | Anterior wall | LAD |
| V5-V6 | Lateral wall | LCX |
| II, III, aVF | Inferior wall | RCA or LCX |
| I, aVL | High lateral | Diagonal or proximal LCX |
- Men >40 yrs: ≥2 mm in V2-V3, >1 mm in all other leads
- Men <40 yrs: >2.5 mm in V2-V3
- Women: >1.5 mm in V1-V3, >1 mm elsewhere
- Posterior leads (V7-V9): ≥0.5 mm
- Right-sided leads (V3R, V4R): ≥0.5 mm (rule out RV infarction in inferior STEMI)
B. ST Depression (NSTEMI/UA Pattern)
- Horizontal or downsloping ST depression in lateral leads (V4-V6, I, aVL) = subendocardial ischemia
- Correlates with demand ischemia or NSTEMI
- Can resolve with symptom resolution (dynamic changes)
C. T-wave Changes in Ischemia
| Pattern | Significance |
|---|---|
| Hyperacute T waves (tall, broad, peaked) | Very early STEMI - precedes ST elevation |
| T-wave inversion (deep, symmetric) in V1-V4 + I, aVL | Severe LAD stenosis - "Wellens sign" |
| Biphasic T waves in V2-V3 | Wellens type A - proximal LAD critical lesion |
| Persistent deep TWI after infarct | Large territory ischemia |
| Pseudo-normalization of inverted T waves | Re-ischemia of a previously infarcted area |
ECG Example - Dynamic Ischemic Changes:
ECG Example - Anterior STEMI (LAD occlusion):
Part 2: NON-CORONARY ST-T Changes
1. Pericarditis
- Diffuse, concave (saddle-back) ST elevation across multiple leads (I, II, aVF, V2-V6) - does NOT follow a single coronary territory
- PR segment depression in the same leads (very characteristic), PR elevation in aVR
- ST depression in aVR (reciprocal)
- No reciprocal changes in the other leads (unlike STEMI)
- Stages: ST elevation → ST normalization → T-wave inversion → T-wave normalization
2. Left Ventricular Hypertrophy (LVH) - "Strain Pattern"
- High QRS voltage (voltage criteria for LVH)
- ST depression + T-wave inversion in leads with tall R waves (V5-V6, I, aVL) - the "strain pattern"
- ST elevation in V1-V2 (leads with deep S waves) - secondary repolarization changes
- Discordant - ST/T changes are opposite to the main QRS direction
- This is a secondary repolarization change, not primary ischemia
3. Left Bundle Branch Block (LBBB)
- Broad QRS (>120 ms) with LBBB morphology
- Appropriately discordant ST-T changes: ST elevation in V1-V2, ST depression + TWI in V5-V6 (opposite to the main QRS deflection)
- New LBBB in acute MI context = STEMI equivalent (Sgarbossa criteria help identify ischemia superimposed on LBBB)
4. Early Repolarization (Benign Variant)
- ST elevation (concave upward, "fishhook" or "notch" at J point) in V2-V5
- Most common in young athletic men
- Prominent, upright T waves
- No reciprocal changes
- Stable over time (not dynamic)
5. Electrolyte Disturbances
| Disturbance | ECG Change |
|---|---|
| Hyperkalemia | Peaked (tented) T waves → QRS widening → sine wave → asystole |
| Hypokalemia | ST depression, flattened T waves, prominent U waves, QT prolongation |
| Hypocalcemia | Prolonged QT (prolonged ST segment) |
| Hypercalcemia | Short QT (short ST segment) |
6. Drug Effects
- Digoxin: "Scooping" of ST-T complex (reverse tick sign), ST depression, shortened QT
- Class IA/III antiarrhythmics (quinidine, sotalol, amiodarone): QT prolongation, T-wave changes
- Tricyclic antidepressants: QT prolongation, T-wave inversion
- Class IC drugs (flecainide): ST elevation mimicking Brugada pattern
7. Acute Pulmonary Embolism
- S1Q3T3 pattern: S wave in lead I, Q wave + T-wave inversion in lead III
- T-wave inversions in V1-V4 (right heart strain pattern)
- ST changes in inferior and right precordial leads
- Can mimic RV ischemia
8. Cerebrovascular/Neurogenic T-wave Changes
- Subarachnoid hemorrhage (or other intracranial bleeds): Massive, deep, wide T-wave inversions ("CVA T waves") + QT prolongation
- Diffuse distribution, not following a coronary territory
- Can be dramatic and alarming - due to catecholamine surge
9. Takotsubo (Stress) Cardiomyopathy
- Initially may show ST elevation in anterior leads (mimics anterior STEMI)
- Followed by diffuse, deep T-wave inversions in V1-V6 + QT prolongation
- No obstructive coronary artery disease on angiography
- Associated with emotional/physical stress
10. Myocarditis
- Diffuse ST elevation (similar to pericarditis) or patchy ST-T changes
- Often associated with elevated troponin
- Does not follow a coronary distribution
11. Hypothermia
- J-wave (Osborn wave): Positive deflection at the J-point, most prominent in V4-V6
- Bradycardia, prolonged intervals
- Characteristic and pathognomonic of hypothermia
Key Differentiating Features: Coronary vs Non-Coronary
| Feature | Coronary (Ischemic) | Non-Coronary |
|---|---|---|
| Distribution | Follows vascular territory (contiguous leads) | Diffuse or non-territorial |
| Reciprocal changes | Present (opposite territory) | Usually absent (except pericarditis aVR) |
| ST morphology | Convex (tombstone) or horizontal depression | Concave (saddle-back) in pericarditis |
| PR changes | None | PR depression in pericarditis |
| Dynamics | Evolve over hours with symptoms | Stable (or different temporal pattern) |
| Q waves | Develop with infarction | Absent (usually) |
| QRS voltage | Normal | High in LVH, wide in LBBB/hyperkalemia |
| Context | Chest pain, risk factors | Fever, drugs, electrolytes, stress |