
POWERPOINT PRESENTATION FOR POSTGRADUATE IMED STUDENTS ON Hypothalamus & Pituitary * Hypothalamus & Pituitary * Hypothalamic releasing hormones, pituitary anatomy, Growth hormone physiology, IGF-1 WITH CLINICAL CORRELATIONS
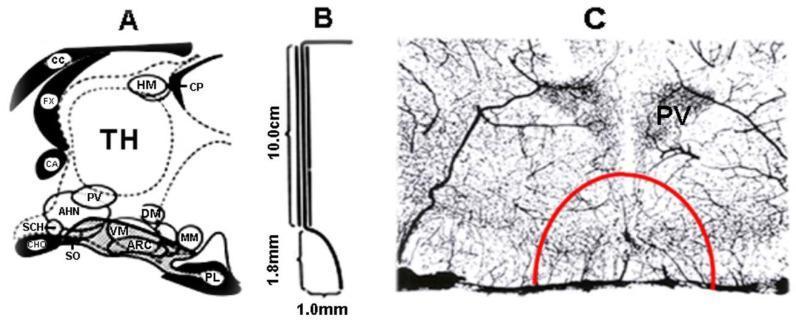
hypothalamus pituitary anatomy diagram
growth hormone IGF-1 axis somatotroph
hypothalamic nuclei portal blood supply pituitary
mkdir -p /tmp/workspace/hypothalamus-pituitary-pptx && ls /tmp/workspace/hypothalamus-pituitary-pptx/
~/hypothalamus-pituitary-pptx/build_pptx.py
#!/usr/bin/env python3
"""
Build: Hypothalamus & Pituitary – Postgraduate IMED Presentation
Covers: Hypothalamic releasing hormones, Pituitary anatomy, GH physiology, IGF-1, Clinical correlations
"""

import json, subprocess, base64
from io import BytesIO
from pptx import Presentation
from pptx.util import Inches, Pt, Emu
from pptx.dml.color import RGBColor
from pptx.enum.text import PP_ALIGN, MSO_ANCHOR
from pptx.oxml.ns import qn
from lxml import etree

# ─────────────────────────── COLOUR PALETTE ───────────────────────────
NAVY      = RGBColor(0x0D, 0x2B, 0x55)   # dark navy (title bg, accent)
TEAL      = RGBColor(0x00, 0x7A, 0x87)   # teal accent
GOLD      = RGBColor(0xE8, 0xA1, 0x00)   # gold highlight
WHITE     = RGBColor(0xFF, 0xFF, 0xFF)
LIGHTGRAY = RGBColor(0xF2, 0xF5, 0xF9)
DARKTEXT  = RGBColor(0x1A, 0x1A, 0x2E)
MIDBLUE   = RGBColor(0x1E, 0x5F, 0x9F)
CORALRED  = RGBColor(0xC0, 0x39, 0x2B)
GREEN     = RGBColor(0x1A, 0x7A, 0x4A)

# Image URLs from textbooks
IMAGES = {
    "hp_org":   "https://cdn.orris.care/cdss_images/fc834bd4a357e8c725291d5c219224ffd2a39c3bb77a3081f5347b840c2e226e.png",
    "gh_axis":  "https://cdn.orris.care/cdss_images/6c7b860f853c260cca5ed7fcad7fc2609d0e367778f783ddd2f280e7758f4a33.png",
    "hp_anat":  "https://cdn.orris.care/cdss_images/afb5273aafe5273150313cba7dcafaa56fc35b8c6537fc711ad879bc2bb51c9a.png",
    "rathke":   "https://cdn.orris.care/cdss_images/ce1045c6276b738fc62be01359ef7b0f0cf779864b50f43ecaf2b62bf6db2b7a.png",
    "gh_pulse": "https://cdn.orris.care/cdss_images/5d58fe4dac79a1d95f7c77e3f070c3c49f06b29a01a47b116947351877a87f62.png",
    "hyp_sect": "https://cdn.orris.care/cdss_images/811df9d77ae425642d689eb61b67e996886cd3b063ccab22b1bf70bf4debed54.png",
    "pit_loc":  "https://cdn.orris.care/cdss_images/50b43f53707601375294dfbfa966a3309d149fc94a9bde310a6a7a81ab8bd1a4.png",
}

# Download images
print("Downloading images…")
result = json.loads(subprocess.check_output(
    ["python", "/tmp/skills/shared/scripts/fetch_images.py"] + list(IMAGES.values())
))
img_data = {}
for key, url in IMAGES.items():
    for item in result:
        if item["url"] == url and item.get("base64"):
            raw = item["base64"]
            if "," in raw:
                raw = raw.split(",", 1)[1]
            img_data[key] = base64.b64decode(raw)
            break
print(f"Downloaded {len(img_data)}/{len(IMAGES)} images")

# ─────────────────────────── HELPERS ───────────────────────────

prs = Presentation()
prs.slide_width  = Inches(13.333)
prs.slide_height = Inches(7.5)
BLANK = prs.slide_layouts[6]

def add_rect(slide, x, y, w, h, fill_rgb=None, alpha=None):
    shape = slide.shapes.add_shape(1, Inches(x), Inches(y), Inches(w), Inches(h))
    shape.line.fill.background()
    if fill_rgb:
        shape.fill.solid()
        shape.fill.fore_color.rgb = fill_rgb
    else:
        shape.fill.background()
    return shape

def add_text(slide, text, x, y, w, h,
             font_name="Calibri", size=18, bold=False, italic=False,
             color=WHITE, align=PP_ALIGN.LEFT, wrap=True,
             valign=MSO_ANCHOR.TOP, margin_l=0.05, margin_t=0.03):
    tb = slide.shapes.add_textbox(Inches(x), Inches(y), Inches(w), Inches(h))
    tf = tb.text_frame
    tf.word_wrap = wrap
    tf.vertical_anchor = valign
    tf.margin_left  = Inches(margin_l)
    tf.margin_right = Inches(0.05)
    tf.margin_top   = Inches(margin_t)
    tf.margin_bottom= Inches(0.03)
    p = tf.paragraphs[0]
    p.alignment = align
    r = p.add_run()
    r.text = text
    r.font.name  = font_name
    r.font.size  = Pt(size)
    r.font.bold  = bold
    r.font.italic= italic
    r.font.color.rgb = color
    return tb, tf

def add_multiline(slide, lines, x, y, w, h,
                  font_name="Calibri", size=16, bold=False,
                  color=DARKTEXT, align=PP_ALIGN.LEFT,
                  bullet=True, line_space=1.15, wrap=True):
    """lines: list of (text, bold_override) or plain strings"""
    tb = slide.shapes.add_textbox(Inches(x), Inches(y), Inches(w), Inches(h))
    tf = tb.text_frame
    tf.word_wrap = wrap
    tf.margin_left  = Inches(0.1)
    tf.margin_right = Inches(0.05)
    tf.margin_top   = Inches(0.05)
    tf.margin_bottom= Inches(0.05)
    first = True
    for item in lines:
        if isinstance(item, tuple):
            txt, b = item
        else:
            txt, b = item, bold
        p = tf.paragraphs[0] if first else tf.add_paragraph()
        first = False
        p.alignment = align
        # line spacing
        p.line_spacing = line_space
        if bullet:
            pPr = p._pPr if p._pPr is not None else p._p.get_or_add_pPr()
            buChar = etree.SubElement(pPr, qn('a:buChar'))
            buChar.set('char', '▸')
        r = p.add_run()
        r.text = txt
        r.font.name  = font_name
        r.font.size  = Pt(size)
        r.font.bold  = b
        r.font.color.rgb = color
    return tb, tf

def add_image(slide, key, x, y, w, h):
    if key in img_data:
        buf = BytesIO(img_data[key])
        slide.shapes.add_picture(buf, Inches(x), Inches(y), Inches(w), Inches(h))

def section_header_band(slide, label):
    """Thin teal band at bottom with section label"""
    add_rect(slide, 0, 7.1, 13.333, 0.4, TEAL)
    add_text(slide, label, 0.2, 7.1, 13, 0.4,
             size=11, bold=False, italic=True, color=WHITE,
             align=PP_ALIGN.RIGHT, valign=MSO_ANCHOR.MIDDLE)

def slide_num_tag(slide, n, total=20):
    add_text(slide, f"{n} / {total}", 12.4, 7.1, 0.9, 0.4,
             size=10, color=WHITE, align=PP_ALIGN.RIGHT, valign=MSO_ANCHOR.MIDDLE)

def content_title(slide, title, subtitle=None):
    """Standard content slide title bar"""
    add_rect(slide, 0, 0, 13.333, 1.05, NAVY)
    add_text(slide, title, 0.25, 0.05, 12.5, 0.7,
             font_name="Calibri", size=28, bold=True,
             color=WHITE, align=PP_ALIGN.LEFT, valign=MSO_ANCHOR.MIDDLE)
    if subtitle:
        add_text(slide, subtitle, 0.25, 0.72, 12.5, 0.35,
                 size=13, italic=True, color=GOLD, align=PP_ALIGN.LEFT)

# ═══════════════════════════════════════════════
# SLIDE 1 – TITLE SLIDE
# ═══════════════════════════════════════════════
s = prs.slides.add_slide(BLANK)
add_rect(s, 0, 0, 13.333, 7.5, NAVY)
# decorative accent bars
add_rect(s, 0, 5.5, 13.333, 0.08, GOLD)
add_rect(s, 0, 6.7, 13.333, 0.08, TEAL)
# Main title
add_text(s, "HYPOTHALAMUS & PITUITARY", 0.6, 1.2, 12, 1.2,
         font_name="Calibri", size=44, bold=True,
         color=WHITE, align=PP_ALIGN.CENTER, valign=MSO_ANCHOR.MIDDLE)
# Subtitle
add_text(s, "Neuroendocrine Physiology & Clinical Correlations",
         0.6, 2.5, 12, 0.7,
         font_name="Calibri", size=22, bold=False, italic=True,
         color=GOLD, align=PP_ALIGN.CENTER, valign=MSO_ANCHOR.MIDDLE)
# Topics strip
add_rect(s, 0.5, 3.3, 12.3, 1.5, MIDBLUE)
add_text(s,
    "Hypothalamic Releasing Hormones  ▸  Pituitary Anatomy  ▸  "
    "Growth Hormone Physiology  ▸  IGF-1 & Clinical Correlations",
    0.7, 3.35, 12, 1.4,
    font_name="Calibri", size=16, color=WHITE,
    align=PP_ALIGN.CENTER, valign=MSO_ANCHOR.MIDDLE)
# Audience
add_text(s, "Postgraduate Internal Medicine Education Programme  |  2026",
         0.5, 5.0, 12.3, 0.5,
         size=13, italic=True, color=LIGHTGRAY,
         align=PP_ALIGN.CENTER, valign=MSO_ANCHOR.MIDDLE)

# ═══════════════════════════════════════════════
# SLIDE 2 – LEARNING OBJECTIVES
# ═══════════════════════════════════════════════
s = prs.slides.add_slide(BLANK)
add_rect(s, 0, 0, 13.333, 7.5, LIGHTGRAY)
content_title(s, "Learning Objectives")
section_header_band(s, "Hypothalamus & Pituitary | Postgraduate IMED")

objectives = [
    "Describe the anatomy of the hypothalamus and pituitary (adeno- and neurohypophysis)",
    "List the hypothalamic releasing and inhibiting hormones and their pituitary targets",
    "Explain the portal blood supply linking hypothalamus to anterior pituitary",
    "Outline the synthesis, secretion and regulation of Growth Hormone (GH)",
    "Describe the GH–IGF-1 axis and downstream metabolic actions",
    "Recognise clinical syndromes: GH deficiency, gigantism, acromegaly, and pituitary tumours",
    "Interpret laboratory tests used in GH excess and deficiency states",
]
add_multiline(s, objectives, 0.6, 1.2, 11.8, 5.8,
              size=18, color=DARKTEXT, bullet=True, line_space=1.3)

# ═══════════════════════════════════════════════
# SLIDE 3 – OVERVIEW: HYPOTHALAMUS
# ═══════════════════════════════════════════════
s = prs.slides.add_slide(BLANK)
add_rect(s, 0, 0, 13.333, 7.5, LIGHTGRAY)
content_title(s, "The Hypothalamus – Overview",
              subtitle="'Homeostatic Head Ganglion' – Master Regulator")
section_header_band(s, "Anatomy & Function")

# LEFT panel – text
add_rect(s, 0.25, 1.15, 6.2, 6.0, WHITE)
points = [
    ("Location", True),
    "Part of the diencephalon, forms walls & floor of the 3rd ventricle inferior portion",
    ("Key Surface Landmarks", True),
    "Optic chiasm (anterior), tuber cinereum, mammillary bodies (posterior)",
    ("Functions – HEAL Mnemonic", True),
    "H – Homeostasis (hunger, thirst, temperature, sleep-wake)",
    "E – Endocrine control via pituitary",
    "A – Autonomic regulation",
    "L – Limbic system interactions",
    ("Hypothalamic Sulcus", True),
    "Shallow groove separating hypothalamus from thalamus on 3rd ventricle wall",
]
add_multiline(s, points, 0.35, 1.2, 6.0, 5.8,
              size=15, color=DARKTEXT, bullet=False)

# RIGHT panel – image
add_image(s, "hp_anat", 6.7, 1.2, 6.3, 5.8)

# ═══════════════════════════════════════════════
# SLIDE 4 – PITUITARY ANATOMY
# ═══════════════════════════════════════════════
s = prs.slides.add_slide(BLANK)
add_rect(s, 0, 0, 13.333, 7.5, LIGHTGRAY)
content_title(s, "Pituitary Gland – Anatomy",
              subtitle="Adenohypophysis & Neurohypophysis")
section_header_band(s, "Pituitary Anatomy")

# Left text
lines = [
    ("Embryological Origin", True),
    "Anterior pituitary (adenohypophysis): Rathke's pouch (oral ectoderm)",
    "Posterior pituitary (neurohypophysis): floor of developing ventricle (neural ectoderm)",
    ("Divisions", True),
    "Anterior lobe: pars distalis (main), pars tuberalis, pars intermedia",
    "Posterior lobe: pars nervosa (contains axon terminals of hypothalamic neurons)",
    ("Location", True),
    "Sits in the sella turcica of sphenoid bone; connected to hypothalamus via pituitary stalk",
    ("Dimensions", True),
    "~1 cm diameter; weighs ~0.5 g (enlarges during pregnancy)",
    ("Relations", True),
    "Superior: optic chiasm, diaphragma sellae | Lateral: cavernous sinus",
    "Contains CN III, IV, V1/V2, VI and internal carotid artery",
]
add_multiline(s, lines, 0.35, 1.15, 6.8, 6.0,
              size=14.5, color=DARKTEXT, bullet=False)

# Right image
add_image(s, "rathke", 7.35, 1.5, 5.5, 3.0)
add_image(s, "pit_loc", 7.35, 4.6, 5.5, 2.65)

# ═══════════════════════════════════════════════
# SLIDE 5 – ANTERIOR PITUITARY CELL TYPES
# ═══════════════════════════════════════════════
s = prs.slides.add_slide(BLANK)
add_rect(s, 0, 0, 13.333, 7.5, LIGHTGRAY)
content_title(s, "Anterior Pituitary – Cell Types & Hormones",
              subtitle="Remember: FLAT-PIG mnemonic")
section_header_band(s, "Pituitary Anatomy")

# Table-like layout with colored boxes
cells = [
    ("Somatotrophs (50%)", "GH", "Growth, metabolism", MIDBLUE),
    ("Lactotrophs (15–20%)", "Prolactin", "Lactation, reproduction", TEAL),
    ("Corticotrophs (15–20%)", "ACTH", "Adrenal cortex stimulation", CORALRED),
    ("Thyrotrophs (5%)", "TSH", "Thyroid hormone production", GREEN),
    ("Gonadotrophs (10%)", "LH & FSH", "Gonadal function", RGBColor(0x80, 0x40, 0xA0)),
]

col_x = [0.3, 3.9, 7.4]
col_w = [3.4, 3.3, 5.7]
hdr_texts = ["Cell Type", "Hormone", "Primary Action"]

row_y = 1.25
# Headers
for i, h in enumerate(hdr_texts):
    add_rect(s, col_x[i], row_y, col_w[i], 0.5, NAVY)
    add_text(s, h, col_x[i]+0.05, row_y, col_w[i], 0.5,
             size=15, bold=True, color=WHITE,
             align=PP_ALIGN.CENTER, valign=MSO_ANCHOR.MIDDLE)

for r_idx, (cell, horm, action, clr) in enumerate(cells):
    ry = row_y + 0.5 + r_idx * 0.95
    for ci, (cx, cw, txt) in enumerate(zip(col_x, col_w,
                                            [cell, horm, action])):
        bg = clr if ci == 0 else WHITE
        tc = WHITE if ci == 0 else DARKTEXT
        add_rect(s, cx, ry, cw, 0.9, bg)
        add_text(s, txt, cx+0.05, ry, cw-0.05, 0.9,
                 size=14, bold=(ci == 0), color=tc,
                 align=PP_ALIGN.CENTER, valign=MSO_ANCHOR.MIDDLE)

# Bottom note
add_text(s, "★  Posterior pituitary secretes Oxytocin & ADH/Vasopressin "
            "(synthesised in hypothalamic SON & PVN nuclei)",
         0.3, 6.5, 12.7, 0.55,
         size=13, italic=True, color=NAVY,
         align=PP_ALIGN.LEFT, valign=MSO_ANCHOR.MIDDLE)

# ═══════════════════════════════════════════════
# SLIDE 6 – HYPOTHALAMIC NUCLEI
# ═══════════════════════════════════════════════
s = prs.slides.add_slide(BLANK)
add_rect(s, 0, 0, 13.333, 7.5, LIGHTGRAY)
content_title(s, "Hypothalamic Nuclei – Key Functional Regions",
              subtitle="Neuroendocrine & Autonomic Hubs")
section_header_band(s, "Hypothalamic Anatomy")

nuclei = [
    ("Supraoptic (SON)", "Synthesises ADH (vasopressin) & oxytocin → axons to posterior pituitary"),
    ("Paraventricular (PVN)", "Synthesises CRH, TRH, oxytocin, ADH; autonomic descending projections"),
    ("Arcuate (ARC)", "Contains GHRH, dopamine (inhibits PRL), kisspeptin, NPY neurons"),
    ("Ventromedial (VMH)", "Satiety centre; sexual behaviour"),
    ("Dorsomedial (DMH)", "Autonomic regulation, circadian rhythm integration"),
    ("Preoptic Area (POA)", "GnRH secretion; thermoregulation"),
    ("Lateral Hypothalamus", "Hunger / feeding drive (orexin/hypocretin neurons)"),
    ("Suprachiasmatic (SCN)", "Circadian pacemaker; receives light input from retina"),
]

for i, (nuc, func) in enumerate(nuclei):
    row = i
    ry = 1.2 + row * 0.73
    add_rect(s, 0.25, ry, 3.8, 0.65, NAVY)
    add_text(s, nuc, 0.3, ry, 3.7, 0.65,
             size=14, bold=True, color=WHITE,
             align=PP_ALIGN.LEFT, valign=MSO_ANCHOR.MIDDLE)
    add_rect(s, 4.1, ry, 8.9, 0.65, WHITE)
    add_text(s, func, 4.15, ry, 8.8, 0.65,
             size=14, color=DARKTEXT,
             align=PP_ALIGN.LEFT, valign=MSO_ANCHOR.MIDDLE)

# ═══════════════════════════════════════════════
# SLIDE 7 – HYPOTHALAMIC RELEASING HORMONES
# ═══════════════════════════════════════════════
s = prs.slides.add_slide(BLANK)
add_rect(s, 0, 0, 13.333, 7.5, LIGHTGRAY)
content_title(s, "Hypothalamic Releasing & Inhibiting Hormones",
              subtitle="Portal system connects hypothalamus to anterior pituitary")
section_header_band(s, "Hypothalamic Releasing Hormones")

# Big table
add_rect(s, 0.2, 1.1, 13.0, 6.25, WHITE)

rows_data = [
    ("GHRH", "Growth Hormone-Releasing Hormone", "Somatotrophs", "↑ GH release", "Arcuate nucleus", TEAL),
    ("SST (Somatostatin)", "Somatotropin-Release Inhibiting Factor", "Somatotrophs / Thyrotrophs", "↓ GH, ↓ TSH", "Periventricular nucleus", CORALRED),
    ("CRH", "Corticotropin-Releasing Hormone", "Corticotrophs", "↑ ACTH", "PVN", RGBColor(0xC0, 0x70, 0x20)),
    ("TRH", "Thyrotropin-Releasing Hormone", "Thyrotrophs / Lactotrophs", "↑ TSH, ↑ PRL", "PVN", MIDBLUE),
    ("GnRH", "Gonadotropin-Releasing Hormone", "Gonadotrophs", "↑ LH & FSH (pulsatile)", "Preoptic area", GREEN),
    ("Dopamine", "Prolactin-Inhibiting Factor", "Lactotrophs", "↓ PRL (tonic)", "Arcuate / Tuberoinfundibular", RGBColor(0x60, 0x00, 0x80)),
]

hdr_cols = ["Abbrev.", "Full Name", "Target Cell", "Effect", "Origin Nucleus"]
hdr_x = [0.25, 2.35, 5.85, 8.15, 10.1]
hdr_w = [2.0,  3.4,  2.2,  1.85, 3.0]

hy = 1.15
for ci, (hx, hw, htxt) in enumerate(zip(hdr_x, hdr_w, hdr_cols)):
    add_rect(s, hx, hy, hw, 0.5, NAVY)
    add_text(s, htxt, hx+0.04, hy, hw, 0.5,
             size=13, bold=True, color=WHITE,
             align=PP_ALIGN.CENTER, valign=MSO_ANCHOR.MIDDLE)

for ri, (abbr, full, target, effect, origin, clr) in enumerate(rows_data):
    ry = 1.65 + ri * 0.93
    values = [abbr, full, target, effect, origin]
    for ci, (hx, hw, val) in enumerate(zip(hdr_x, hdr_w, values)):
        bg = clr if ci == 0 else WHITE
        tc = WHITE if ci == 0 else DARKTEXT
        add_rect(s, hx, ry, hw, 0.88, bg)
        add_text(s, val, hx+0.04, ry, hw-0.04, 0.88,
                 size=12.5, bold=(ci==0), color=tc,
                 align=PP_ALIGN.CENTER if ci > 0 else PP_ALIGN.LEFT,
                 valign=MSO_ANCHOR.MIDDLE)

# ═══════════════════════════════════════════════
# SLIDE 8 – PORTAL BLOOD SUPPLY & DIAGRAM
# ═══════════════════════════════════════════════
s = prs.slides.add_slide(BLANK)
add_rect(s, 0, 0, 13.333, 7.5, LIGHTGRAY)
content_title(s, "Hypothalamo-Hypophyseal Portal System",
              subtitle="Vascular link delivering releasing hormones to anterior pituitary")
section_header_band(s, "Hypothalamic Releasing Hormones")

# Left – textual explanation
pts = [
    ("Portal Blood Supply", True),
    "Superior hypophyseal arteries (from ICA) form capillary plexus in median eminence",
    "Blood drains into long portal veins → sinusoids in anterior pituitary",
    "Short portal veins connect posterior pituitary capillaries to anterior pituitary",
    ("Key Concept", True),
    "Releasing hormones travel in very HIGH concentrations via portal blood",
    "This bypasses systemic dilution, achieving far greater effect on pituitary cells",
    ("Posterior Pituitary Pathway – Different!", True),
    "Hypothalamic neurons (SON, PVN) project axons DIRECTLY to posterior pituitary",
    "ADH & Oxytocin are released from axon terminals into systemic circulation",
    ("Clinical Significance", True),
    "Pituitary stalk transection → loss of anterior pituitary hormones (EXCEPT PRL ↑)",
    "PRL rises because dopamine (inhibitory) can no longer reach lactotrophs",
]
add_multiline(s, pts, 0.3, 1.15, 6.5, 6.0,
              size=14, color=DARKTEXT, bullet=False)

# Right – diagram image
add_image(s, "hp_org", 7.0, 1.15, 6.0, 5.9)

# ═══════════════════════════════════════════════
# SLIDE 9 – GH: STRUCTURE & SYNTHESIS
# ═══════════════════════════════════════════════
s = prs.slides.add_slide(BLANK)
add_rect(s, 0, 0, 13.333, 7.5, LIGHTGRAY)
content_title(s, "Growth Hormone (GH) – Structure & Synthesis",
              subtitle="Single-chain polypeptide; secreted by anterior pituitary somatotrophs")
section_header_band(s, "Growth Hormone Physiology")

left_pts = [
    ("Structure", True),
    "Principal form: 22-kDa polypeptide, 191 amino acids, 2 disulfide bonds",
    "Minor form: 20-kDa (alternative splicing, exon 3 deletion – aa 32–46 removed)",
    "Other forms: 45-kDa dimer, larger multimers – variable activity",
    ("Gene & Family", True),
    "Single-copy gene on chromosome 17 (GH gene cluster)",
    "Family includes: pvGH (93%), hCS1/hCS2 (84%), Prolactin (16% homology)",
    ("Synthesis Pathway", True),
    "Pre-pro-GH → pro-GH → mature GH (processed in ER & Golgi)",
    "Stored in secretory granules → released by GHRH stimulation",
    ("Somatotrophs", True),
    "Constitute ~50% of anterior pituitary cells",
    "Distributed throughout the anterior lobe",
]
add_multiline(s, left_pts, 0.3, 1.15, 7.8, 6.0,
              size=14.5, color=DARKTEXT, bullet=False)

# Side box - GH family
add_rect(s, 8.3, 1.25, 4.8, 5.8, NAVY)
family_data = [
    ("Hormone", "AA", "Homology"),
    ("hGH", "191", "100%"),
    ("pvGH", "191", "93%"),
    ("hCS1", "191", "84%"),
    ("hCS2", "191", "84%"),
    ("hPRL", "199", "16%"),
]
for ri, row in enumerate(family_data):
    fy = 1.35 + ri * 0.8
    for ci, (val, fw) in enumerate(zip(row, [2.0, 1.2, 1.4])):
        fx = 8.4 + sum([2.0, 1.2, 1.4][:ci])
        bg = TEAL if ri == 0 else (RGBColor(0x1A, 0x3A, 0x6A) if ri % 2 == 0 else NAVY)
        add_rect(s, fx, fy, fw, 0.75, bg)
        add_text(s, val, fx+0.04, fy, fw-0.04, 0.75,
                 size=13, bold=(ri==0), color=WHITE,
                 align=PP_ALIGN.CENTER, valign=MSO_ANCHOR.MIDDLE)

# ═══════════════════════════════════════════════
# SLIDE 10 – GH SECRETION & REGULATION
# ═══════════════════════════════════════════════
s = prs.slides.add_slide(BLANK)
add_rect(s, 0, 0, 13.333, 7.5, LIGHTGRAY)
content_title(s, "GH Secretion – Regulation & Pulsatility",
              subtitle="Highly episodic secretion driven by GHRH/SST balance and multiple physiological inputs")
section_header_band(s, "Growth Hormone Physiology")

# Left
left_pts = [
    ("Pulsatile Pattern", True),
    "Secretion is episodic – bursts of hundreds of pulses throughout the day",
    ">70% of daily GH secretion occurs in first few hours of slow-wave sleep",
    "Plasma GH can be 100-fold higher during peaks vs. troughs",
    ("Stimulators of GH Secretion", True),
    "GHRH (primary hypothalamic stimulator)",
    "Ghrelin (stomach-derived; GHSR agonist) – most potent GH stimulus",
    "Sleep, exercise, stress, hypoglycaemia, high-protein meals, fasting",
    "Oestrogen, testosterone, α-adrenergic agonists",
    ("Inhibitors of GH Secretion", True),
    "Somatostatin (SST) – periventricular nucleus; acts on pituitary",
    "IGF-1 (negative feedback – at hypothalamus & pituitary)",
    "Hyperglycaemia, free fatty acids, glucocorticoids, obesity",
    "GH itself (ultra-short loop feedback)",
]
add_multiline(s, left_pts, 0.3, 1.15, 7.1, 6.0,
              size=14, color=DARKTEXT, bullet=False)

# Right – pulse graph image
add_image(s, "gh_pulse", 7.6, 1.2, 5.5, 5.8)

# ═══════════════════════════════════════════════
# SLIDE 11 – GH RECEPTOR & SIGNALLING
# ═══════════════════════════════════════════════
s = prs.slides.add_slide(BLANK)
add_rect(s, 0, 0, 13.333, 7.5, LIGHTGRAY)
content_title(s, "GH Receptor & Signal Transduction",
              subtitle="Class I Cytokine Receptor – JAK2/STAT5 pathway")
section_header_band(s, "Growth Hormone Physiology")

pts = [
    ("Receptor", True),
    "GHR belongs to Class I cytokine receptor superfamily (like EPO-R, PRL-R)",
    "Single transmembrane domain; no intrinsic kinase activity",
    "GH binds ONE receptor → recruits a SECOND receptor → dimerisation",
    ("Signal Transduction – JAK/STAT Pathway", True),
    "GH binding → JAK2 (Janus kinase 2) recruitment and trans-autophosphorylation",
    "JAK2 phosphorylates STAT5b → dimerises → translocates to nucleus",
    "Activates transcription of IGF-1 gene (liver) and other GH-target genes",
    "Also activates: MAPK/ERK (proliferation), PI3K/AKT (survival/metabolism)",
    ("Receptor Regulation", True),
    "GH binding promotes ubiquitination and downregulation of GHR",
    "Proteolytic cleavage of extracellular domain generates GH-binding protein (GHBP)",
    "GHBP prolongs GH half-life; serum GHBP reflects GHR density in tissues",
    ("GHR Deficiency – Laron Syndrome", True),
    "Autosomal recessive; GHR mutations → high GH but low IGF-1 → short stature",
    "Treated with recombinant IGF-1 (not GH), as receptor is non-functional",
]
add_multiline(s, pts, 0.3, 1.15, 12.7, 5.9,
              size=15, color=DARKTEXT, bullet=False, line_space=1.2)

# ═══════════════════════════════════════════════
# SLIDE 12 – GH DIRECT METABOLIC ACTIONS
# ═══════════════════════════════════════════════
s = prs.slides.add_slide(BLANK)
add_rect(s, 0, 0, 13.333, 7.5, LIGHTGRAY)
content_title(s, "GH – Direct Metabolic Actions",
              subtitle="Diabetogenic, lipolytic, anti-natriuretic effects independent of IGF-1")
section_header_band(s, "Growth Hormone Physiology")

# Three columns
col_titles = ["Glucose Metabolism", "Fat Metabolism", "Protein & Other"]
col_colors = [CORALRED, TEAL, MIDBLUE]
col_x2 = [0.25, 4.55, 8.85]
col_w2 = 4.2
col_pts = [
    [
        "↑ Hepatic gluconeogenesis",
        "↓ Insulin-stimulated glucose uptake in muscle & adipose",
        "Post-receptor insulin resistance",
        "Net effect: HYPERGLYCAEMIA (diabetogenic)",
        "High GH → secondary diabetes mellitus",
        "GH excess with pre-existing T2DM – severe worsening",
    ],
    [
        "↑ Lipolysis in adipose tissue",
        "↑ Free fatty acid (FFA) mobilisation",
        "FFAs are preferred fuel in GH-excess states",
        "↓ Body fat (especially visceral)",
        "GH deficiency → central obesity",
        "GH therapy → ↓ fat mass, ↑ lean mass",
    ],
    [
        "↑ Protein synthesis (anabolic)",
        "↑ Amino acid uptake by cells",
        "↑ Collagen & connective tissue growth",
        "↑ Renal Na+ & water reabsorption",
        "→ Oedema & carpal tunnel syndrome",
        "↑ 1α-hydroxylation of Vit D → ↑ Ca²⁺ absorption",
    ],
]
for ci in range(3):
    cx = col_x2[ci]
    add_rect(s, cx, 1.15, col_w2, 0.55, col_colors[ci])
    add_text(s, col_titles[ci], cx+0.05, 1.15, col_w2, 0.55,
             size=15, bold=True, color=WHITE,
             align=PP_ALIGN.CENTER, valign=MSO_ANCHOR.MIDDLE)
    add_rect(s, cx, 1.7, col_w2, 5.55, WHITE)
    add_multiline(s, col_pts[ci], cx+0.1, 1.75, col_w2-0.15, 5.4,
                  size=14, color=DARKTEXT, bullet=True)

# ═══════════════════════════════════════════════
# SLIDE 13 – IGF-1 AXIS
# ═══════════════════════════════════════════════
s = prs.slides.add_slide(BLANK)
add_rect(s, 0, 0, 13.333, 7.5, LIGHTGRAY)
content_title(s, "IGF-1 (Insulin-Like Growth Factor 1)",
              subtitle="Mediates most growth-promoting actions of GH")
section_header_band(s, "IGF-1 Axis")

# Left text
left_pts = [
    ("Structure & Synthesis", True),
    "Single-chain polypeptide (~7.5 kDa); structural homology to pro-insulin",
    "Primary source: LIVER (hepatic IGF-1 is regulated by GH)",
    "Also produced locally by bone, muscle, kidney, brain (autocrine/paracrine)",
    ("GH → IGF-1 Pathway", True),
    "GH → JAK2/STAT5b activation → IGF-1 gene transcription in liver",
    "IGF-1 secreted into circulation → bound by IGFBPs (mainly IGFBP-3 + ALS)",
    "Only free (~1%) or IGFBP-3-bound IGF-1 is bioactive",
    ("IGF-1 Receptor (IGF-1R)", True),
    "Tyrosine kinase receptor; shares 60% homology with insulin receptor",
    "Activates IRS-1/PI3K/AKT → cell growth and survival",
    "Also activates RAS/MAPK → cell proliferation",
    ("IGFBP-3", True),
    "Main carrier; forms ternary complex with ALS (acid-labile subunit)",
    "IGFBP-3 also GH-dependent → low in GHD, high in acromegaly",
    ("Negative Feedback", True),
    "IGF-1 feeds back to HYPOTHALAMUS (↓ GHRH, ↑ SST) and PITUITARY (↓ GH)",
]
add_multiline(s, left_pts, 0.3, 1.15, 7.2, 6.0,
              size=13.5, color=DARKTEXT, bullet=False, line_space=1.18)

# Right – GH-IGF axis diagram
add_image(s, "gh_axis", 7.7, 1.2, 5.4, 5.8)

# ═══════════════════════════════════════════════
# SLIDE 14 – IGF-1 ACTIONS & IGFBPS
# ═══════════════════════════════════════════════
s = prs.slides.add_slide(BLANK)
add_rect(s, 0, 0, 13.333, 7.5, LIGHTGRAY)
content_title(s, "IGF-1 – Biological Actions & Binding Proteins",
              subtitle="Broad anabolic, mitogenic, anti-apoptotic effects")
section_header_band(s, "IGF-1 Axis")

col_titles2 = ["Growth Effects", "Metabolic Effects", "IGFBPs (1-6)"]
col_colors2 = [GREEN, MIDBLUE, RGBColor(0x80, 0x40, 0xA0)]
col_pts2 = [
    [
        "↑ Linear bone growth (chondrocytes)",
        "↑ Periosteal bone formation",
        "↑ Muscle protein synthesis & hypertrophy",
        "↑ Organ growth (liver, kidney, heart)",
        "↑ Cell proliferation – most tissues",
        "Anti-apoptotic (promotes cell survival)",
        "Synergises with GH on long bone growth",
    ],
    [
        "Insulin-like: ↑ glucose uptake, ↑ glycogen synthesis",
        "↑ Amino acid uptake into muscle",
        "↑ Lipolysis (like GH, but weaker)",
        "↑ DNA/RNA synthesis",
        "At high doses: hypoglycaemia (IGF-1R on insulin-sensitive tissues)",
        "Important in foetal growth (GH-independent)",
    ],
    [
        "IGFBP-1: hepatic; rises with fasting",
        "IGFBP-2: brain, liver; inverse with GH",
        "IGFBP-3: major carrier (>75%); GH-dependent; forms ternary complex with ALS",
        "IGFBP-4: inhibitory; regulated by PAPP-A",
        "IGFBP-5: bone & muscle; stimulatory",
        "IGFBP-6: inhibitory; IGF-2 preferential",
        "ALS (acid-labile subunit): stabilises IGFBP-3 ternary complex",
    ],
]
for ci in range(3):
    cx = [0.25, 4.55, 8.85][ci]
    cw = 4.2
    add_rect(s, cx, 1.15, cw, 0.55, col_colors2[ci])
    add_text(s, col_titles2[ci], cx+0.05, 1.15, cw, 0.55,
             size=15, bold=True, color=WHITE,
             align=PP_ALIGN.CENTER, valign=MSO_ANCHOR.MIDDLE)
    add_rect(s, cx, 1.7, cw, 5.5, WHITE)
    add_multiline(s, col_pts2[ci], cx+0.1, 1.75, cw-0.15, 5.35,
                  size=13.5, color=DARKTEXT, bullet=True)

# ═══════════════════════════════════════════════
# SLIDE 15 – CLINICAL CORRELATION: GH DEFICIENCY
# ═══════════════════════════════════════════════
s = prs.slides.add_slide(BLANK)
add_rect(s, 0, 0, 13.333, 7.5, LIGHTGRAY)
content_title(s, "Clinical Correlation: Growth Hormone Deficiency (GHD)",
              subtitle="Childhood vs. Adult onset – different presentations")
section_header_band(s, "Clinical Correlations")

# Two columns
for ci, (title, clr, pts) in enumerate([
    ("Childhood GHD", MIDBLUE, [
        "Normal birth size (GH not required in utero – IGF-2 & insulin drive foetal growth)",
        "Progressive short stature after first few months of life",
        "Delayed bone age",
        "Increased body fat, reduced muscle mass",
        "Possible hypoglycaemia in neonates",
        "May have associated ACTH/TSH deficiency if panhypopituitary",
        "★  Classic cause: craniopharyngioma, pituitary aplasia/hypoplasia, idiopathic",
        "Treatment: recombinant hGH (somatotropin) until growth plates close",
    ]),
    ("Adult GHD", TEAL, [
        "Mostly acquired (pituitary adenoma, surgery, radiotherapy, trauma)",
        "Body composition: ↑ visceral fat, ↓ lean mass, ↓ bone density",
        "Reduced exercise capacity and quality of life",
        "Dyslipidaemia: ↑ LDL, ↓ HDL",
        "Increased cardiovascular risk",
        "Low IGF-1 + failure to respond to stimulation tests → diagnosis",
        "Stimulation tests: insulin tolerance test (ITT) – gold standard",
        "   Also: GHRH-arginine, glucagon stimulation test",
        "Treatment: recombinant GH replacement improves body composition, QoL",
    ]),
]):
    cx = 0.25 + ci * 6.6
    add_rect(s, cx, 1.15, 6.3, 0.55, clr)
    add_text(s, title, cx+0.1, 1.15, 6.2, 0.55,
             size=17, bold=True, color=WHITE,
             align=PP_ALIGN.CENTER, valign=MSO_ANCHOR.MIDDLE)
    add_rect(s, cx, 1.7, 6.3, 5.5, WHITE)
    add_multiline(s, pts, cx+0.15, 1.75, 6.0, 5.3,
                  size=13.5, color=DARKTEXT, bullet=True)

# ═══════════════════════════════════════════════
# SLIDE 16 – CLINICAL CORRELATION: ACROMEGALY
# ═══════════════════════════════════════════════
s = prs.slides.add_slide(BLANK)
add_rect(s, 0, 0, 13.333, 7.5, LIGHTGRAY)
content_title(s, "Clinical Correlation: Acromegaly",
              subtitle="GH excess after epiphyseal fusion — most common cause: GH-secreting pituitary macroadenoma")
section_header_band(s, "Clinical Correlations")

# Left panel
left_data = [
    ("Pathophysiology", True),
    "GH-secreting adenoma (somatotroph) in anterior pituitary",
    "Sustained GH excess → continuous IGF-1 stimulation",
    "Epiphyses closed → no ↑ height; but ↑ soft tissue & bone thickness",
    ("Clinical Features – Onset Insidious (5–10 yr delay)", True),
    "Face: prominent brow, jaw prognathism, macroglossia, wide nose",
    "Hands/feet: spade-like hands, ring/shoe size increase",
    "Skin: oily, hyperhidrosis, acanthosis nigricans, skin tags",
    "Arthropathy, carpal tunnel syndrome",
    "Gigantism if onset before epiphyseal fusion",
    ("Systemic Complications", True),
    "Hypertension, cardiomegaly, sleep apnoea, colonic polyps/cancer risk",
    "Impaired glucose tolerance / Diabetes mellitus",
    "↑ Mortality if untreated (CV & respiratory causes)",
]
add_multiline(s, left_data, 0.3, 1.15, 6.5, 6.0,
              size=13.5, color=DARKTEXT, bullet=False)

# Right panel
right_data = [
    ("Diagnosis", True),
    "Screen: Serum IGF-1 (age- & sex-matched) – best single test",
    "Confirm: 75g OGTT → GH fails to suppress to <0.4 μg/L",
    "MRI pituitary: identifies adenoma, size, invasion",
    "GHRH levels if ectopic source suspected (pancreatic tumour, carcinoid)",
    ("Treatment", True),
    "1st line: Trans-sphenoidal surgery (TSS) – curative if complete resection",
    "Medical: Somatostatin analogues (octreotide LAR, lanreotide) – suppress GH/IGF-1",
    "   GH receptor antagonist: Pegvisomant (blocks GHR dimerisation) – normalises IGF-1",
    "   Dopamine agonists (cabergoline) – if mild elevation or mixed GH+PRL tumour",
    "Radiotherapy: stereotactic (gamma knife) if surgery/meds fail",
    ("Monitoring", True),
    "Target: IGF-1 in normal range for age/sex, random GH <1 μg/L",
]
add_multiline(s, right_data, 7.0, 1.15, 6.0, 6.0,
              size=13.5, color=DARKTEXT, bullet=False)
# Vertical divider
add_rect(s, 6.85, 1.15, 0.05, 6.0, TEAL)

# ═══════════════════════════════════════════════
# SLIDE 17 – GIGANTISM & PITUITARY TUMOURS
# ═══════════════════════════════════════════════
s = prs.slides.add_slide(BLANK)
add_rect(s, 0, 0, 13.333, 7.5, LIGHTGRAY)
content_title(s, "Gigantism & Pituitary Tumours – Overview",
              subtitle="GH excess before epiphyseal fusion; Classification of pituitary adenomas")
section_header_band(s, "Clinical Correlations")

left_pts = [
    ("Gigantism", True),
    "GH excess during childhood (before growth plate closure)",
    "Continuous ↑ height due to epiphyseal stimulation",
    "Associated with: delayed puberty, macroorchidism, hyperhidrosis",
    "Same systemic complications as acromegaly (CV, metabolic)",
    "Cause: GH-secreting pituitary adenoma (usually macroadenoma)",
    "Treatment: TSS; somatostatin analogues; pegvisomant",
    ("Pituitary Adenoma Classification", True),
    "Microadenoma: <10 mm | Macroadenoma: >10 mm",
    "Functional vs. non-functional (NFA – cause mass effect)",
    "Most common: PRL-secreting (prolactinoma) → treat with dopamine agonists",
    "Mass effects of macroadenoma:",
    "   • Bitemporal hemianopia (optic chiasm compression)",
    "   • Hypopituitarism (compression of normal pituitary tissue)",
    "   • Headache, CSF rhinorrhoea (if invasive)",
    "   • Cranial nerve palsy (cavernous sinus invasion)",
]
add_multiline(s, left_pts, 0.3, 1.15, 6.5, 6.0,
              size=13.5, color=DARKTEXT, bullet=False)

# Right - table of pituitary tumour syndromes
add_rect(s, 7.0, 1.15, 6.1, 0.55, NAVY)
add_text(s, "Pituitary Adenoma: Clinical Summary", 7.05, 1.15, 6.0, 0.55,
         size=14, bold=True, color=WHITE,
         align=PP_ALIGN.CENTER, valign=MSO_ANCHOR.MIDDLE)

tumours = [
    ("Prolactinoma", "↑ PRL", "Galactorrhoea, amenorrhoea, infertility, ↓ libido", "Cabergoline / bromocriptine"),
    ("Somatotroph (GH)", "↑ GH, IGF-1", "Acromegaly / gigantism", "TSS → SSA → pegvisomant"),
    ("Corticotroph (ACTH)", "↑ ACTH/cortisol", "Cushing's disease", "TSS → ketoconazole/pasireotide"),
    ("Thyrotroph (TSH)", "↑ TSH, T3/T4", "Hyperthyroidism (central)", "TSS → SSA"),
    ("Non-functional", "—", "Headache, visual field defect, hypopituitarism", "TSS / observation"),
]
t_hdrs = ["Type", "Hormone", "Syndrome", "Treatment"]
t_xpos = [7.05, 8.95, 10.25, 12.05]
t_wpos = [1.85, 1.25, 1.75, 1.1]

hy2 = 1.7
for ci2, htxt in enumerate(t_hdrs):
    add_rect(s, t_xpos[ci2], hy2, t_wpos[ci2], 0.45, TEAL)
    add_text(s, htxt, t_xpos[ci2]+0.03, hy2, t_wpos[ci2], 0.45,
             size=12, bold=True, color=WHITE,
             align=PP_ALIGN.CENTER, valign=MSO_ANCHOR.MIDDLE)

for ri2, row in enumerate(tumours):
    ry2 = 2.15 + ri2 * 1.02
    for ci2, (val, xp, wp) in enumerate(zip(row, t_xpos, t_wpos)):
        bg2 = RGBColor(0x0D, 0x2B, 0x55) if ci2 == 0 else WHITE
        tc2 = WHITE if ci2 == 0 else DARKTEXT
        add_rect(s, xp, ry2, wp, 0.97, bg2)
        add_text(s, val, xp+0.03, ry2, wp-0.03, 0.97,
                 size=11.5, bold=(ci2==0), color=tc2,
                 align=PP_ALIGN.LEFT, valign=MSO_ANCHOR.MIDDLE)

# ═══════════════════════════════════════════════
# SLIDE 18 – LAB EVALUATION
# ═══════════════════════════════════════════════
s = prs.slides.add_slide(BLANK)
add_rect(s, 0, 0, 13.333, 7.5, LIGHTGRAY)
content_title(s, "Laboratory Evaluation of GH-IGF-1 Axis",
              subtitle="Basal and dynamic tests for excess and deficiency")
section_header_band(s, "Clinical Correlations")

# Table
add_rect(s, 0.2, 1.15, 12.9, 6.0, WHITE)

lab_rows = [
    ("Test", "Indication", "Protocol", "Interpretation", True),
    ("Serum IGF-1", "Screening: excess or deficiency", "Single fasting sample; age/sex-matched reference ranges", "Low → GHD; High → excess (acromegaly)", False),
    ("IGFBP-3", "Paediatric GHD especially", "Single sample; GH-dependent", "Low in GHD; Normal to high in acromegaly", False),
    ("Oral Glucose Tolerance Test (OGTT) + GH", "Confirm acromegaly", "75g glucose; GH at 0, 30, 60, 90, 120 min", "Failure of GH to suppress to <0.4 μg/L = acromegaly", False),
    ("Insulin Tolerance Test (ITT)", "Confirm GHD (Gold standard)", "0.1–0.15 U/kg insulin IV; GH sampled when glucose <2.2 mmol/L", "Peak GH <3 μg/L = severe GHD; requires medical supervision", False),
    ("GHRH-Arginine Test", "GHD (safer alternative to ITT)", "GHRH 1 μg/kg + arginine infusion; GH sampled", "Peak GH cut-offs vary with BMI; lower cut-off in obesity", False),
    ("Glucagon Stimulation Test", "GHD (when ITT contraindicated)", "1 mg glucagon IM; GH sampled at intervals", "Peak GH <3 μg/L = GHD", False),
    ("Serum GH (random)", "Monitoring acromegaly treatment", "Multiple samples (pulsatile); mean GH <1 μg/L is target", "Not useful for diagnosis alone due to pulsatility", False),
]

row_heights = [0.5] + [0.82] * (len(lab_rows) - 1)
col_xs = [0.25, 2.1, 4.5, 7.7, 11.0]
col_ws = [1.8, 2.3, 3.1, 3.2, 2.1]
col_hdrs = ["Test", "Indication", "Protocol", "Interpretation"]

ry3 = 1.18
for ri3, (row_data, is_hdr) in enumerate([(r[:-1], r[-1]) for r in lab_rows]):
    for ci3, (val, xp, wp) in enumerate(zip(row_data, col_xs, col_ws)):
        bg3 = NAVY if is_hdr else (LIGHTGRAY if ri3 % 2 == 0 else WHITE)
        tc3 = WHITE if is_hdr else DARKTEXT
        rh = row_heights[ri3]
        add_rect(s, xp, ry3, wp, rh, bg3)
        add_text(s, val, xp+0.04, ry3, wp-0.04, rh,
                 size=12 if not is_hdr else 13.5, bold=is_hdr, color=tc3,
                 align=PP_ALIGN.LEFT, valign=MSO_ANCHOR.MIDDLE, wrap=True)
    ry3 += row_heights[ri3]

# ═══════════════════════════════════════════════
# SLIDE 19 – KEY CLINICAL PEARLS
# ═══════════════════════════════════════════════
s = prs.slides.add_slide(BLANK)
add_rect(s, 0, 0, 13.333, 7.5, LIGHTGRAY)
content_title(s, "Key Clinical Pearls & Exam Highlights")
section_header_band(s, "Summary & Key Points")

pearls = [
    ("▸  GH vs. IGF-1", NAVY,
     "Random GH is useless for diagnosis (pulsatile). IGF-1 is the best SCREENING test for both excess and deficiency."),
    ("▸  Pituitary stalk transection", TEAL,
     "ALL anterior pituitary hormones fall EXCEPT Prolactin (which rises, because dopaminergic inhibition is lost)."),
    ("▸  Acromegaly diagnosis", CORALRED,
     "OGTT: normal GH should suppress to <0.4 μg/L. Failure to suppress = acromegaly. MRI pituitary mandatory."),
    ("▸  Laron Syndrome", GREEN,
     "High GH + Low IGF-1 = GH receptor defect. Treat with recombinant IGF-1, NOT GH (receptor cannot respond)."),
    ("▸  Foetal growth", MIDBLUE,
     "GH NOT required for intrauterine growth. Foetal size is driven by IGF-2, insulin, and placental factors."),
    ("▸  Craniopharyngioma", RGBColor(0x80, 0x40, 0x00),
     "Most common cause of GHD in children. Calcified suprasellar lesion. Can also cause DI, visual defects, obesity."),
    ("▸  Somatostatin analogue uses", RGBColor(0x60, 0x00, 0x80),
     "Octreotide/Lanreotide: acromegaly, TSH-oma, carcinoid syndrome, variceal bleeding. Also ↓ pancreatic secretion."),
]
for i, (label, clr, text) in enumerate(pearls):
    ry = 1.15 + i * 0.88
    add_rect(s, 0.25, ry, 2.5, 0.82, clr)
    add_text(s, label, 0.3, ry, 2.4, 0.82,
             size=13, bold=True, color=WHITE,
             align=PP_ALIGN.LEFT, valign=MSO_ANCHOR.MIDDLE)
    add_rect(s, 2.8, ry, 10.3, 0.82, WHITE)
    add_text(s, text, 2.85, ry, 10.2, 0.82,
             size=13.5, color=DARKTEXT,
             align=PP_ALIGN.LEFT, valign=MSO_ANCHOR.MIDDLE)

# ═══════════════════════════════════════════════
# SLIDE 20 – SUMMARY & REFERENCES
# ═══════════════════════════════════════════════
s = prs.slides.add_slide(BLANK)
add_rect(s, 0, 0, 13.333, 7.5, NAVY)
add_rect(s, 0, 5.6, 13.333, 0.08, GOLD)

add_text(s, "Summary", 0.6, 0.3, 12, 0.7,
         font_name="Calibri", size=32, bold=True,
         color=WHITE, align=PP_ALIGN.CENTER)

summary_pts = [
    "The hypothalamus integrates neural and endocrine signals via HEAL functions; key nuclei include ARC, PVN, SON, and preoptic area",
    "Six hypothalamic hormones regulate anterior pituitary through the portal vasculature; GHRH stimulates, SST inhibits GH secretion",
    "Anterior pituitary has 5 cell types producing 7 hormones; posterior pituitary secretes ADH & oxytocin from hypothalamic axons",
    "GH (22-kDa; somatotrophs) is pulsatile; regulated by GHRH (+), SST (−), ghrelin (+), IGF-1 feedback (−)",
    "GH acts directly (diabetogenic, lipolytic) and indirectly via hepatic IGF-1 production (growth, anabolic effects)",
    "IGF-1 is the best screening marker for both GH excess and deficiency; OGTT-GH suppression confirms acromegaly",
    "Clinical spectrum: GHD (short stature, body composition changes), acromegaly (soft tissue/bone changes, metabolic), gigantism",
]
for i, pt in enumerate(summary_pts):
    add_rect(s, 0.5, 1.1 + i * 0.7, 12.3, 0.65,
             RGBColor(0x12, 0x3A, 0x6A))
    add_text(s, f"  {i+1}.  {pt}", 0.55, 1.1 + i * 0.7, 12.2, 0.65,
             size=13.5, color=WHITE,
             align=PP_ALIGN.LEFT, valign=MSO_ANCHOR.MIDDLE)

# References
add_rect(s, 0.5, 6.1, 12.3, 0.08, TEAL)
add_text(s,
    "Sources: Boron & Boulpaep Medical Physiology | Goodman & Gilman's Pharmacology | "
    "Neuroanatomy through Clinical Cases (Blumenfeld) | Goldman-Cecil Medicine",
    0.5, 6.25, 12.3, 0.7,
    size=10.5, italic=True, color=LIGHTGRAY,
    align=PP_ALIGN.CENTER, valign=MSO_ANCHOR.MIDDLE)

# ─── SAVE ───────────────────────────────────────────
out = "/tmp/workspace/hypothalamus-pituitary-pptx/Hypothalamus_Pituitary_IMED.pptx"
prs.save(out)
print(f"✅  Saved to {out}")
cd /tmp/workspace/hypothalamus-pituitary-pptx && python build_pptx.py 2>&1
find /tmp/skills -name "fetch_images.py" 2>/dev/null; ls /tmp/skills/
~/hypothalamus-pituitary-pptx/build_pptx.py
Successfully replaced 1 instance(s) of the string in '/tmp/workspace/hypothalamus-pituitary-pptx/build_pptx.py'
~/hypothalamus-pituitary-pptx/build_pptx.py
Successfully replaced 1 instance(s) of the string in '/tmp/workspace/hypothalamus-pituitary-pptx/build_pptx.py'
cd /tmp/workspace/hypothalamus-pituitary-pptx && python build_pptx.py 2>&1
ls -lh /tmp/workspace/hypothalamus-pituitary-pptx/Hypothalamus_Pituitary_IMED.pptx && python3 -c " from pptx import Presentation prs = Presentation('/tmp/workspace/hypothalamus-pituitary-pptx/Hypothalamus_Pituitary_IMED.pptx') print(f'Slides: {len(prs.slides)}') for i, slide in enumerate(prs.slides, 1): texts = [s.text_frame.text.strip().splitlines()[0] for s in slide.shapes if s.has_text_frame and s.text_frame.text.strip()] title = texts[0] if texts else '(no text)' print(f' Slide {i:02d}: {title[:80]}') "
Hypothalamus Pituitary IMED
Presentation · PPTX
What's inside — 20 slides, 16:9 widescreen
| # | Slide Title |
|---|---|
| 1 | Title Slide — Hypothalamus & Pituitary, Postgraduate IMED 2026 |
| 2 | Learning Objectives — 7 specific outcomes |
| 3 | The Hypothalamus – Overview — HEAL mnemonic, landmarks, functions + anatomy image |
| 4 | Pituitary Anatomy — Embryology (Rathke's pouch / neurohypophysis), divisions, sella relations + 2 diagrams |
| 5 | Anterior Pituitary Cell Types — Colour-coded table: somatotrophs, lactotrophs, corticotrophs, thyrotrophs, gonadotrophs |
| 6 | Hypothalamic Nuclei — 8 nuclei with functions (ARC, PVN, SON, SCN, VMH, DMH, POA, lateral) |
| 7 | Hypothalamic Releasing/Inhibiting Hormones — Full table: GHRH, SST, CRH, TRH, GnRH, Dopamine with targets & effects |
| 8 | Hypothalamo-Hypophyseal Portal System — Portal vs. direct (posterior) pathways; stalk transection pearl + diagram |
| 9 | GH – Structure & Synthesis — 22-kDa/20-kDa isoforms, gene locus, GH family homology table |
| 10 | GH Secretion & Regulation — Pulsatility, sleep burst, stimulators/inhibitors + 24-hr pulse graph image |
| 11 | GH Receptor & Signal Transduction — Class I cytokine receptor, JAK2/STAT5, MAPK/PI3K, Laron syndrome |
| 12 | GH Direct Metabolic Actions — 3-column: glucose (diabetogenic), fat (lipolytic), protein/other |
| 13 | IGF-1 – Structure, Synthesis & Axis — Liver source, STAT5b pathway, IGFBPs, negative feedback loop + axis diagram |
| 14 | IGF-1 Biological Actions & IGFBPs — Growth effects, metabolic effects, IGFBP-1 to -6 with functions |
| 15 | Clinical Correlation: GHD — Childhood vs adult onset, causes, diagnosis, treatment |
| 16 | Clinical Correlation: Acromegaly — Features, systemic complications, OGTT diagnosis, treatment ladder |
| 17 | Gigantism & Pituitary Tumours — Prolactinoma, corticotroph, thyrotroph, NFA summary table |
| 18 | Laboratory Evaluation — ITT, OGTT-GH, GHRH-arginine, glucagon test, IGF-1, IGFBP-3 with protocols |
| 19 | Key Clinical Pearls — 7 exam-ready pearls (Laron, stalk transection, foetal growth, SSA uses, etc.) |
| 20 | Summary & References — 7-point recap; sources from Boron & Boulpaep, Goodman & Gilman, Blumenfeld, Goldman-Cecil |