Top 10 most common ecg cases along with deatils of each ecg explained in them alongside examples

Reading File
Finding Sources
Searching Images

ECG atrial fibrillation electrocardiogram example
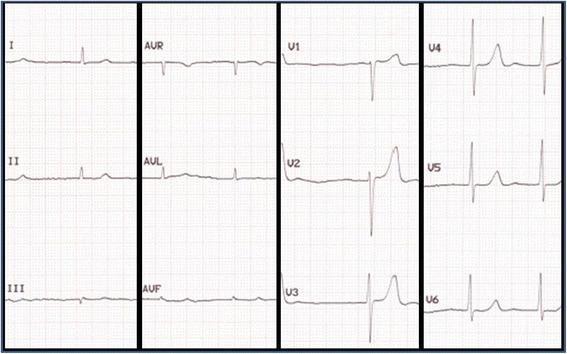
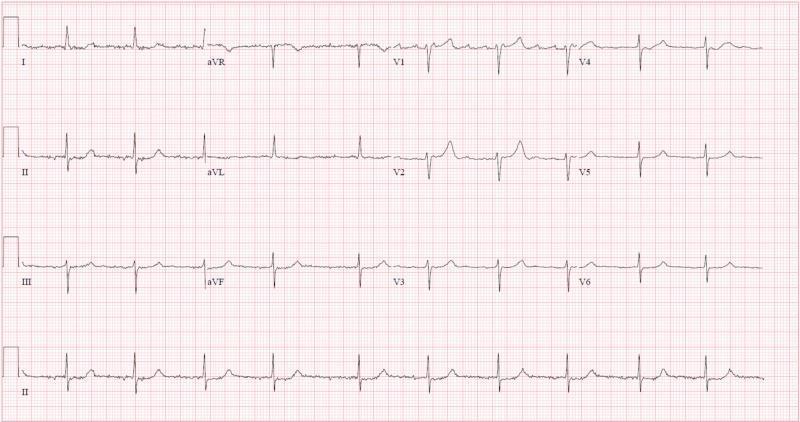
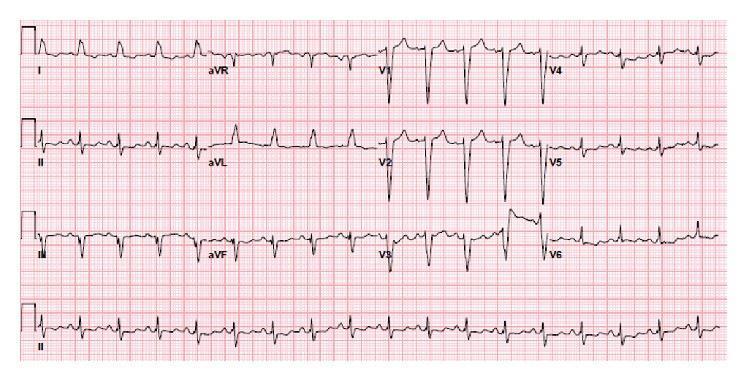
A standard twelve-lead electrocardiogram (ECG) demonstrating atrial fibrillation. The tracing is organized into four columns representing limb leads (I, II, III), augmented leads (aVR, aVL, aVF), and precordial leads (V1-V3 and V4-V6). The primary diagnostic feature is a 'highly irregular' rhythm with variable R-R intervals, indicating an irregular ventricular response. There is a complete absence of organized P waves across all leads, which are replaced by fine, erratic baseline fluctuations known as fibrillatory (f) waves, most visible in leads II and V1. The QRS complexes are narrow, suggesting normal intraventricular conduction. Notably, the limb leads (specifically I, II, III, aVF) exhibit low voltage QRS complexes, which is a classic electrophysiological finding in cardiac amyloidosis, often contrasting with the increased myocardial wall thickness seen on imaging. This ECG serves as a clinical example of supraventricular arrhythmia in the context of systemic infiltrative disease, such as wild-type ATTR amyloidosis.
A standard twelve-lead electrocardiogram (ECG) demonstrating atrial fibrillation. The tracing is organized into four columns representing limb leads (I, II, III), augmented leads (aVR, aVL, aVF), and precordial leads (V1-V3 and V4-V6). The primary diagnostic feature is a 'highly irregular' rhythm with variable R-R intervals, indicating an irregular ventricular response. There is a complete absence of organized P waves across all leads, which are replaced by fine, erratic baseline fluctuations known as fibrillatory (f) waves, most visible in leads II and V1. The QRS complexes are narrow, suggesting normal intraventricular conduction. Notably, the limb leads (specifically I, II, III, aVF) exhibit low voltage QRS complexes, which is a classic electrophysiological finding in cardiac amyloidosis, often contrasting with the increased myocardial wall thickness seen on imaging. This ECG serves as a clinical example of supraventricular arrhythmia in the context of systemic infiltrative disease, such as wild-type ATTR amyloidosis.

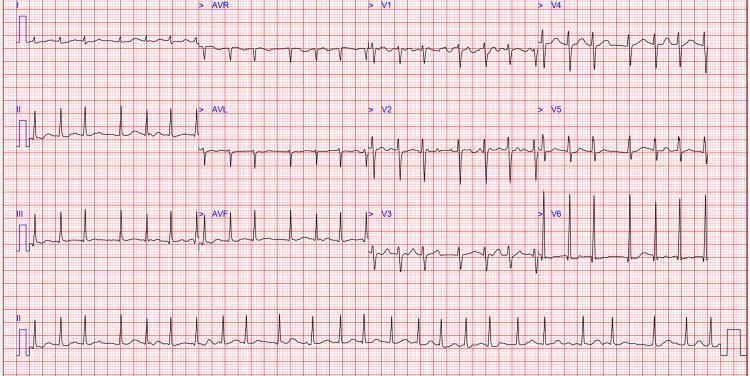
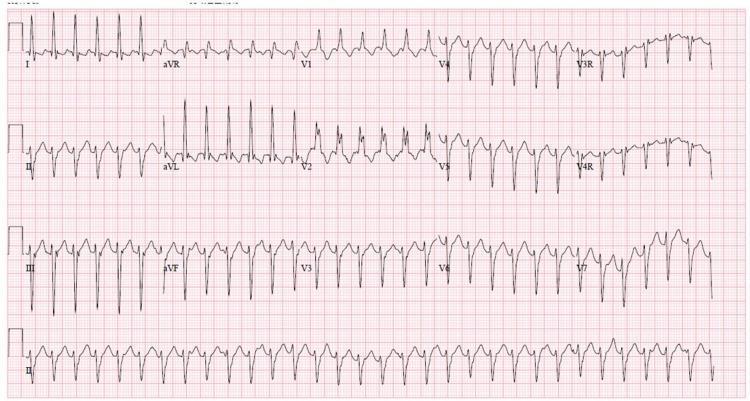
A standard 12-lead electrocardiogram (ECG) demonstrating atrial fibrillation with a rapid ventricular response. The tracing shows a classic 'irregularly irregular' rhythm characterized by highly variable R-R intervals across all leads (I, II, III, aVR, aVL, aVF, and V1-V6). There is a distinct absence of organized P waves, replaced by fine, low-amplitude fibrillatory waves visible in the baseline, particularly evident in lead V1 and the rhythm strip at the bottom (lead II). The QRS complexes are narrow, suggesting supraventricular origin of the rhythm. T-wave morphology appears generally normal without acute ST-segment changes. The clinical significance of this tracing is the confirmation of tachyarrhythmic atrial fibrillation, often associated with systemic conditions such as hyperthyroidism or Graves' disease in a clinical context. The image serves as a key diagnostic example for medical students and clinicians to identify irregular ventricular rates and the loss of atrial mechanical activity on an ECG.
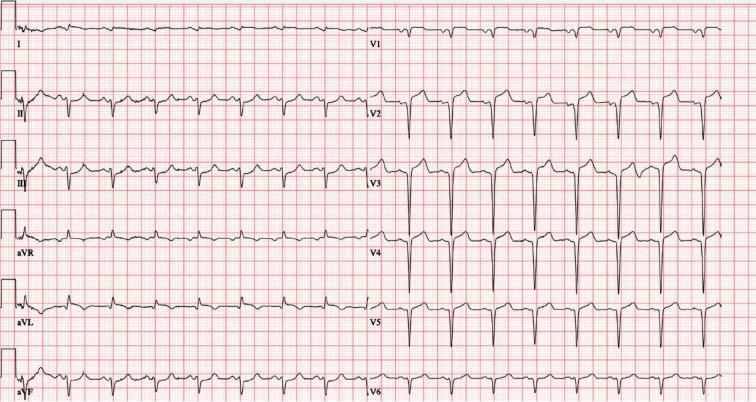
A standard 12-lead electrocardiogram (ECG) demonstrating atrial fibrillation with a rapid ventricular response. The tracing shows a classic 'irregularly irregular' rhythm characterized by highly variable R-R intervals across all leads (I, II, III, aVR, aVL, aVF, and V1-V6). There is a distinct absence of organized P waves, replaced by fine, low-amplitude fibrillatory waves visible in the baseline, particularly evident in lead V1 and the rhythm strip at the bottom (lead II). The QRS complexes are narrow, suggesting supraventricular origin of the rhythm. T-wave morphology appears generally normal without acute ST-segment changes. The clinical significance of this tracing is the confirmation of tachyarrhythmic atrial fibrillation, often associated with systemic conditions such as hyperthyroidism or Graves' disease in a clinical context. The image serves as a key diagnostic example for medical students and clinicians to identify irregular ventricular rates and the loss of atrial mechanical activity on an ECG.

A 12-lead electrocardiogram (ECG) printed on standard grid paper, featuring leads I, II, III, aVR, aVL, aVF, and V1 through V6, with a long rhythm strip of lead II at the bottom. The tracing demonstrates classic features of atrial fibrillation, characterized by an 'irregularly irregular' ventricular rhythm evidenced by varying R-R intervals. There is a notable absence of distinct, organized P waves; instead, the baseline shows low-amplitude fibrillatory waves, particularly visible in the inferior leads (II, III, aVF) and V1. The QRS complexes are narrow (duration <120 ms), indicating normal ventricular conduction. The ventricular rate is relatively controlled, appearing within or near normal limits rather than rapid. ST segments are generally isoelectric, and T-wave morphology appears largely unremarkable across most leads, with no obvious acute ST-segment elevation or depression. This diagnostic image serves as a clinical example of rate-controlled atrial fibrillation for cardiovascular education.

A 12-lead electrocardiogram (ECG) printed on standard grid paper, featuring leads I, II, III, aVR, aVL, aVF, and V1 through V6, with a long rhythm strip of lead II at the bottom. The tracing demonstrates classic features of atrial fibrillation, characterized by an 'irregularly irregular' ventricular rhythm evidenced by varying R-R intervals. There is a notable absence of distinct, organized P waves; instead, the baseline shows low-amplitude fibrillatory waves, particularly visible in the inferior leads (II, III, aVF) and V1. The QRS complexes are narrow (duration <120 ms), indicating normal ventricular conduction. The ventricular rate is relatively controlled, appearing within or near normal limits rather than rapid. ST segments are generally isoelectric, and T-wave morphology appears largely unremarkable across most leads, with no obvious acute ST-segment elevation or depression. This diagnostic image serves as a clinical example of rate-controlled atrial fibrillation for cardiovascular education.

Searching Images

STEMI ST elevation myocardial infarction ECG
This is a 12-lead electrocardiogram (ECG) demonstrating an acute ST-segment elevation myocardial infarction (STEMI). The diagnostic hallmark is prominent ST-segment elevation across the precordial leads V1 through V6, with the most significant convex elevation appearing in leads V2, V3, and V4. These findings are highly characteristic of an acute anterior wall infarction, typically involving the left anterior descending (LAD) coronary artery. In the limb leads, mild ST-segment elevation is also visible in leads I, II, III, and aVF, accompanied by positive, upright T waves. Lead aVR shows expected global inversion. The tracing displays a sinus rhythm with regular morphology, but the ST-segment deviations from the isoelectric baseline indicate acute myocardial injury. This visual material is a critical educational tool for teaching the ECG localization of coronary occlusions and the identification of STEMI criteria in an emergency clinical context.
This is a 12-lead electrocardiogram (ECG) demonstrating an acute ST-segment elevation myocardial infarction (STEMI). The diagnostic hallmark is prominent ST-segment elevation across the precordial leads V1 through V6, with the most significant convex elevation appearing in leads V2, V3, and V4. These findings are highly characteristic of an acute anterior wall infarction, typically involving the left anterior descending (LAD) coronary artery. In the limb leads, mild ST-segment elevation is also visible in leads I, II, III, and aVF, accompanied by positive, upright T waves. Lead aVR shows expected global inversion. The tracing displays a sinus rhythm with regular morphology, but the ST-segment deviations from the isoelectric baseline indicate acute myocardial injury. This visual material is a critical educational tool for teaching the ECG localization of coronary occlusions and the identification of STEMI criteria in an emergency clinical context.

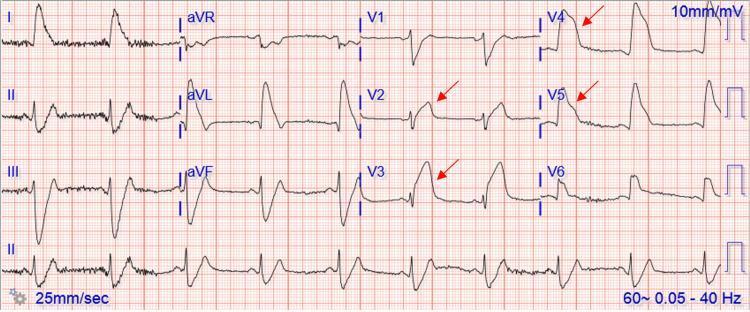
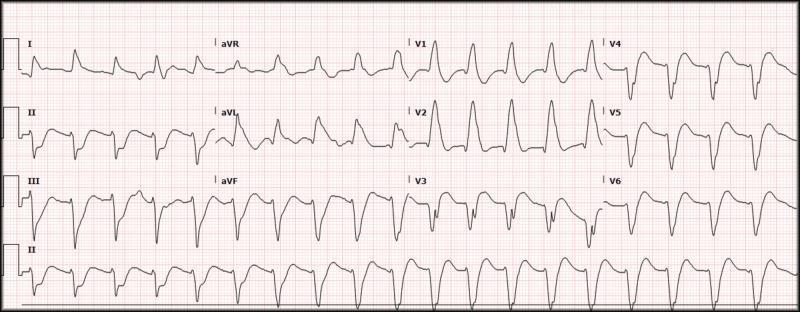
This diagnostic image is a 12-lead electrocardiogram (ECG) demonstrating an ST-elevation myocardial infarction (STEMI). The tracing exhibits significant ST-segment elevation across several leads, most prominently marked with red arrows in the precordial leads V2, V3, V4, and V5. The ST-segments show a convex-upward (coved) morphology, characteristic of acute myocardial injury. Additionally, there is evident ST-segment elevation in the lateral leads (I, aVL) and hyperacute T-waves. Leads II, III, and aVF show reciprocal ST-segment depression. The cardiac rhythm appears to be a sinus bradycardia, with a visible P-wave preceding each QRS complex. The tracing is set at a standard paper speed of 25 mm/sec and a voltage calibration of 10 mm/mV. This ECG is a critical educational tool for identifying the 'tombstone' ST-elevation pattern associated with proximal left anterior descending artery (LAD) or left main coronary artery occlusion, correlating with extensive anterior-lateral wall ischemia.
This diagnostic image is a 12-lead electrocardiogram (ECG) demonstrating an ST-elevation myocardial infarction (STEMI). The tracing exhibits significant ST-segment elevation across several leads, most prominently marked with red arrows in the precordial leads V2, V3, V4, and V5. The ST-segments show a convex-upward (coved) morphology, characteristic of acute myocardial injury. Additionally, there is evident ST-segment elevation in the lateral leads (I, aVL) and hyperacute T-waves. Leads II, III, and aVF show reciprocal ST-segment depression. The cardiac rhythm appears to be a sinus bradycardia, with a visible P-wave preceding each QRS complex. The tracing is set at a standard paper speed of 25 mm/sec and a voltage calibration of 10 mm/mV. This ECG is a critical educational tool for identifying the 'tombstone' ST-elevation pattern associated with proximal left anterior descending artery (LAD) or left main coronary artery occlusion, correlating with extensive anterior-lateral wall ischemia.

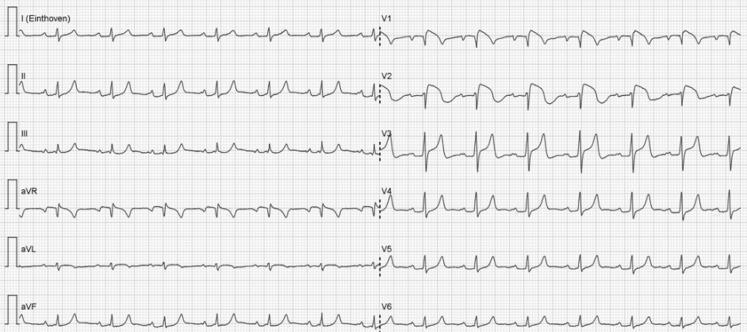
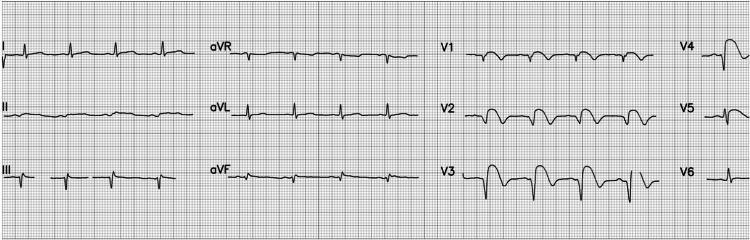
A 12-lead electrocardiogram (ECG) demonstrating an acute ST-elevation myocardial infarction (STEMI) with characteristic anterior and anterolateral findings. The tracing displays a normal sinus rhythm with a heart rate of approximately 84 beats per minute and normal P wave morphology. Significant pathology is localized to the precordial leads, specifically V2 through V5, which exhibit pronounced ST-segment elevation. This elevation presents with a convex 'tombstoning' morphology, a high-risk indicator of extensive myocardial injury. Additionally, evolving QS waves are visible in leads V2 and V3, indicating necrotic changes or transmural infarction. These findings are clinically consistent with an acute occlusion of the left anterior descending (LAD) coronary artery. The limb leads (I, II, III, aVR, aVL, aVF) show relatively stable baselines, though mild reciprocal changes or secondary ST-T wave abnormalities may be present in the inferior leads. This diagnostic image serves as a classic educational example of early-stage STEMI progression and the visual identification of localized ischemic injury on electrocardiography.

A 12-lead electrocardiogram (ECG) demonstrating an acute ST-elevation myocardial infarction (STEMI) with characteristic anterior and anterolateral findings. The tracing displays a normal sinus rhythm with a heart rate of approximately 84 beats per minute and normal P wave morphology. Significant pathology is localized to the precordial leads, specifically V2 through V5, which exhibit pronounced ST-segment elevation. This elevation presents with a convex 'tombstoning' morphology, a high-risk indicator of extensive myocardial injury. Additionally, evolving QS waves are visible in leads V2 and V3, indicating necrotic changes or transmural infarction. These findings are clinically consistent with an acute occlusion of the left anterior descending (LAD) coronary artery. The limb leads (I, II, III, aVR, aVL, aVF) show relatively stable baselines, though mild reciprocal changes or secondary ST-T wave abnormalities may be present in the inferior leads. This diagnostic image serves as a classic educational example of early-stage STEMI progression and the visual identification of localized ischemic injury on electrocardiography.

Searching Images

ventricular tachycardia ECG wide complex tachycardia
A 12-lead electrocardiogram (ECG) demonstrating a regular wide complex tachycardia (WCT). The rhythm is characterized by a rapid ventricular rate and broad QRS complexes, indicating delayed ventricular depolarization. Key morphological findings include a Right Bundle Branch Block (RBBB) pattern, notably visible as an RSR' or notched morphology in the right precordial leads (V1, V2). There is significant left axis deviation (LAD), with predominantly negative QRS complexes in the inferior leads (II, III, and aVF) and positive complexes in leads I and aVL. This combination of RBBB morphology and left axis deviation in the context of wide complex tachycardia is a classic presentation of idiopathic left ventricular tachycardia, also known as Belhassen tachycardia or verapamil-sensitive fascicular ventricular tachycardia. The rhythm appears monomorphic, and the baseline shows no clearly identifiable P waves, suggesting atrioventricular dissociation or retrograde conduction common in ventricular arrhythmias.
A 12-lead electrocardiogram (ECG) demonstrating a regular wide complex tachycardia (WCT). The rhythm is characterized by a rapid ventricular rate and broad QRS complexes, indicating delayed ventricular depolarization. Key morphological findings include a Right Bundle Branch Block (RBBB) pattern, notably visible as an RSR' or notched morphology in the right precordial leads (V1, V2). There is significant left axis deviation (LAD), with predominantly negative QRS complexes in the inferior leads (II, III, and aVF) and positive complexes in leads I and aVL. This combination of RBBB morphology and left axis deviation in the context of wide complex tachycardia is a classic presentation of idiopathic left ventricular tachycardia, also known as Belhassen tachycardia or verapamil-sensitive fascicular ventricular tachycardia. The rhythm appears monomorphic, and the baseline shows no clearly identifiable P waves, suggesting atrioventricular dissociation or retrograde conduction common in ventricular arrhythmias.

This diagnostic image is a 12-lead electrocardiogram (ECG) demonstrating a wide-complex tachycardia with a ventricular rate of approximately 116 beats per minute and a QRS duration of approximately 200 ms. The ECG shows a regular rhythm with significantly widened QRS complexes and bizarre morphology, suggestive of a ventricular origin or severe intraventricular conduction delay. In the precordial leads, V1 and V2 exhibit tall, peaked R-waves with slurred upstrokes, while V4 through V6 show deep S-waves and discordant T-waves. The limb leads (I, II, III, aVR, aVL, aVF) demonstrate varied morphology with notching and slurring. No clear P-waves are discernible preceding the QRS complexes, which is characteristic of ventricular tachycardia or a highly aberrant supraventricular rhythm. The clinical focus of this visual is to illustrate the features of wide-complex tachycardia in an emergency clinical setting, emphasizing the importance of recognizing prolonged QRS intervals and atypical wave morphology for rapid triage and Advanced Cardiovascular Life Support (ACLS) intervention.

This diagnostic image is a 12-lead electrocardiogram (ECG) demonstrating a wide-complex tachycardia with a ventricular rate of approximately 116 beats per minute and a QRS duration of approximately 200 ms. The ECG shows a regular rhythm with significantly widened QRS complexes and bizarre morphology, suggestive of a ventricular origin or severe intraventricular conduction delay. In the precordial leads, V1 and V2 exhibit tall, peaked R-waves with slurred upstrokes, while V4 through V6 show deep S-waves and discordant T-waves. The limb leads (I, II, III, aVR, aVL, aVF) demonstrate varied morphology with notching and slurring. No clear P-waves are discernible preceding the QRS complexes, which is characteristic of ventricular tachycardia or a highly aberrant supraventricular rhythm. The clinical focus of this visual is to illustrate the features of wide-complex tachycardia in an emergency clinical setting, emphasizing the importance of recognizing prolonged QRS intervals and atypical wave morphology for rapid triage and Advanced Cardiovascular Life Support (ACLS) intervention.

Searching Images

complete heart block third degree AV block ECG
A 12-lead electrocardiogram (ECG) demonstrating a complete atrioventricular (AV) block, also known as third-degree heart block. The diagnostic image shows total AV dissociation characterized by a lack of relationship between P waves and QRS complexes. The atrial rate is significantly faster and independent of the ventricular rate. The ventricular escape rhythm is slow (bradycardic) with wide QRS complexes (duration >120 ms), indicating the escape rhythm originates from a ventricular or infra-Hisian site. Prominent features include deep S waves in the precordial leads (V1-V3) and T-wave inversions in several leads, including I, II, aVL, and V4-V6. This tracing represents a postoperative clinical scenario following tricuspid valve replacement, illustrating a known complication of congenital heart surgery. The ECG is recorded at standard settings of 25 mm/s and 10 mm/mV, serving as a critical educational tool for identifying life-threatening conduction system failures and the necessity for pacing interventions.

A 12-lead electrocardiogram (ECG) demonstrating a complete atrioventricular (AV) block, also known as third-degree heart block. The diagnostic image shows total AV dissociation characterized by a lack of relationship between P waves and QRS complexes. The atrial rate is significantly faster and independent of the ventricular rate. The ventricular escape rhythm is slow (bradycardic) with wide QRS complexes (duration >120 ms), indicating the escape rhythm originates from a ventricular or infra-Hisian site. Prominent features include deep S waves in the precordial leads (V1-V3) and T-wave inversions in several leads, including I, II, aVL, and V4-V6. This tracing represents a postoperative clinical scenario following tricuspid valve replacement, illustrating a known complication of congenital heart surgery. The ECG is recorded at standard settings of 25 mm/s and 10 mm/mV, serving as a critical educational tool for identifying life-threatening conduction system failures and the necessity for pacing interventions.

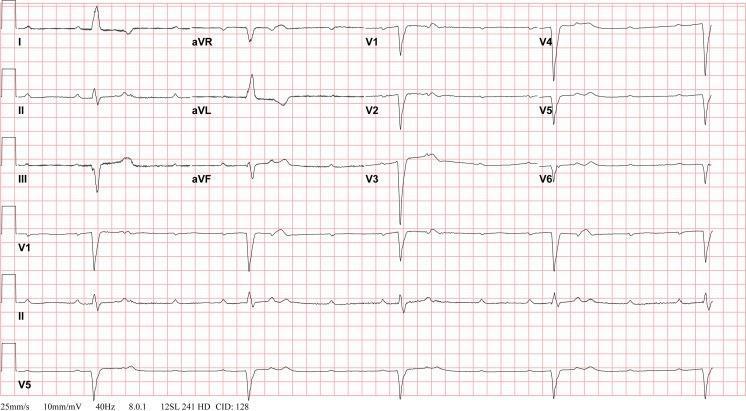
This diagnostic image is a single-lead (Lead II) rhythm strip electrocardiogram (ECG) demonstrating a complete heart block, also known as third-degree atrioventricular (AV) block. The tracing shows complete AV dissociation, characterized by independent atrial and ventricular activity. P waves are present and occur at a regular, faster atrial rate, but they bear no consistent relationship to the QRS complexes; some P waves are superimposed on T waves or the QRS complexes themselves. The ventricular rhythm is maintained by a slow, bradycardic escape rhythm. The QRS complexes are relatively narrow and appear at regular intervals, suggesting a junctional escape origin. This clinical finding is critical for medical students and clinicians to recognize as it indicates a total failure of conduction through the AV node, necessitating urgent clinical intervention such as a permanent pacemaker.

This diagnostic image is a single-lead (Lead II) rhythm strip electrocardiogram (ECG) demonstrating a complete heart block, also known as third-degree atrioventricular (AV) block. The tracing shows complete AV dissociation, characterized by independent atrial and ventricular activity. P waves are present and occur at a regular, faster atrial rate, but they bear no consistent relationship to the QRS complexes; some P waves are superimposed on T waves or the QRS complexes themselves. The ventricular rhythm is maintained by a slow, bradycardic escape rhythm. The QRS complexes are relatively narrow and appear at regular intervals, suggesting a junctional escape origin. This clinical finding is critical for medical students and clinicians to recognize as it indicates a total failure of conduction through the AV node, necessitating urgent clinical intervention such as a permanent pacemaker.

Searching Images

left bundle branch block LBBB ECG pattern
This diagnostic image is a 12-lead electrocardiogram (ECG) demonstrating a new-onset left bundle branch block (LBBB) pattern. The tracing shows a wide QRS complex (>120 ms) with characteristic morphology, including deep, broad S waves in the right precordial leads (V1-V3) and broad, notched, or monophasic R waves in the lateral leads (I, aVL, V5, and V6). Secondary ST-T wave changes are present, characterized by ST-segment elevation in leads V1-V3 and ST-segment depression with T-wave inversion in the lateral leads, which is discordant with the QRS polarity. These findings are critical in clinical cardiology for identifying intraventricular conduction delays and can mask or mimic myocardial infarction. The ECG provides educational value in recognizing the criteria for LBBB and understanding its implications in emergency clinical scenarios such as Takotsubo cardiomyopathy or acute coronary syndrome.
This diagnostic image is a 12-lead electrocardiogram (ECG) demonstrating a new-onset left bundle branch block (LBBB) pattern. The tracing shows a wide QRS complex (>120 ms) with characteristic morphology, including deep, broad S waves in the right precordial leads (V1-V3) and broad, notched, or monophasic R waves in the lateral leads (I, aVL, V5, and V6). Secondary ST-T wave changes are present, characterized by ST-segment elevation in leads V1-V3 and ST-segment depression with T-wave inversion in the lateral leads, which is discordant with the QRS polarity. These findings are critical in clinical cardiology for identifying intraventricular conduction delays and can mask or mimic myocardial infarction. The ECG provides educational value in recognizing the criteria for LBBB and understanding its implications in emergency clinical scenarios such as Takotsubo cardiomyopathy or acute coronary syndrome.

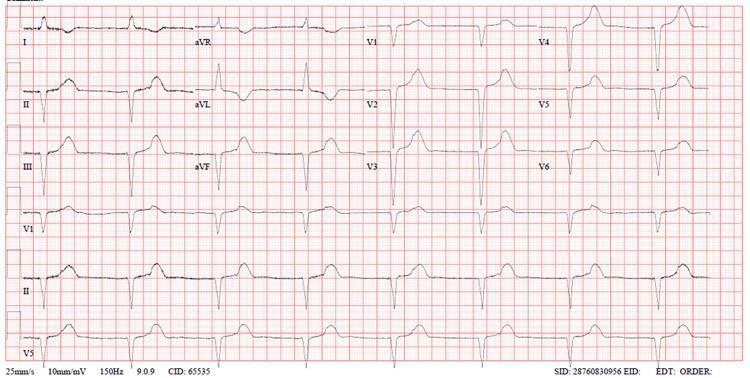
This diagnostic image is a 12-lead electrocardiogram (ECG) performed on standard grid paper, demonstrating a classic Left Bundle Branch Block (LBBB) pattern. The rhythm is sinus, with visible P-waves preceding each QRS complex. Key diagnostic features include a significantly widened QRS duration (>120 ms) and broad, monophasic R-waves in the lateral leads (I, aVL, V5, and V6). In the precordial leads V1-V3, there is a characteristic deep, wide S-wave and predominantly negative deflection, indicating abnormal intraventricular conduction. Secondary ST-T wave changes are present, manifested by ST-segment flattening and T-wave inversions discordant with the QRS complex in the lateral leads, which is typical for LBBB morphology. This tracing is an educational example of preexisting conduction system disease that may predispose patients to complete heart block during clinical procedures, such as central venous cannulation. The ECG provides a basis for recognizing ventricular depolarization abnormalities and differentiating LBBB from other cardiac conditions.

This diagnostic image is a 12-lead electrocardiogram (ECG) performed on standard grid paper, demonstrating a classic Left Bundle Branch Block (LBBB) pattern. The rhythm is sinus, with visible P-waves preceding each QRS complex. Key diagnostic features include a significantly widened QRS duration (>120 ms) and broad, monophasic R-waves in the lateral leads (I, aVL, V5, and V6). In the precordial leads V1-V3, there is a characteristic deep, wide S-wave and predominantly negative deflection, indicating abnormal intraventricular conduction. Secondary ST-T wave changes are present, manifested by ST-segment flattening and T-wave inversions discordant with the QRS complex in the lateral leads, which is typical for LBBB morphology. This tracing is an educational example of preexisting conduction system disease that may predispose patients to complete heart block during clinical procedures, such as central venous cannulation. The ECG provides a basis for recognizing ventricular depolarization abnormalities and differentiating LBBB from other cardiac conditions.

Finding Sources
Reading File
I now have all the images and content I need. Let me compile a comprehensive, well-illustrated answer covering the top 10 most common ECG cases.

Top 10 Most Common ECG Cases - Detailed Guide

Here is a thorough breakdown of the 10 most commonly encountered ECG patterns in clinical practice, each with key features, diagnostic criteria, clinical significance, and real ECG examples.

1. Atrial Fibrillation (AF)

What it is: The most common sustained cardiac arrhythmia. Multiple small areas of atrial myocardium continuously and chaotically discharge, causing the atria to quiver rather than contract effectively. This reduces cardiac output and increases thromboembolic risk.
ECG Features:
  • No P waves - replaced by chaotic fibrillatory (f) waves, most visible in V1 and inferior leads
  • Irregularly irregular ventricular rhythm - the hallmark finding; no two R-R intervals are equal
  • Narrow QRS complexes (unless pre-existing BBB or aberrant conduction)
  • Atrial rate: >600 bpm; ventricular rate: typically 120-170 bpm (uncontrolled)
  • Rate-controlled AF: ventricular rate <100 bpm
Clinical Significance: Risk of stroke (CHA₂DS₂-VASc scoring), heart failure, hemodynamic compromise. Causes include hypertension, valvular disease, hyperthyroidism, alcohol ("holiday heart").
AF - Irregularly irregular rhythm with absent P waves
Example: Classic AF - note the completely irregular R-R intervals and absent P waves, with fine baseline oscillations (fibrillatory waves) best seen in V1.
AF with rapid ventricular response
Example: AF with rapid ventricular response (~150 bpm) - note the narrow QRS complexes with absolutely no pattern to the R-R intervals.

2. ST-Elevation Myocardial Infarction (STEMI)

What it is: Acute transmural myocardial infarction caused by complete occlusion of a coronary artery. A time-critical emergency requiring immediate revascularization (PCI within 90 minutes - "door-to-balloon" time).
ECG Features:
  • ST-segment elevation ≥1 mm in ≥2 contiguous limb leads, or ≥2 mm in ≥2 contiguous precordial leads
  • Hyperacute T waves in very early phase (tall, broad, symmetrical)
  • Reciprocal ST depression in leads opposite to the infarct territory
  • Pathological Q waves develop within hours (necrosis marker)
  • T-wave inversion in the evolving/subacute phase
  • "Tombstone" morphology: massive convex ST elevation in severe LAD occlusion
Localization by leads:
TerritoryLeads with ST elevationCulprit artery
AnteriorV1-V4LAD
InferiorII, III, aVFRCA (or LCx)
LateralI, aVL, V5-V6LCx
PosteriorV1-V3 depression + V7-V9 elevationRCA/LCx
STEMI with anterior ST elevation and tombstone morphology
Example: Anterior STEMI - massive convex ST elevation in V2-V5 (red arrows), with reciprocal depression in inferior leads. Classic LAD occlusion.
Anterior STEMI with evolving QS waves
Example: Evolving anterior STEMI - note the ST elevation in V2-V5 plus QS waves in V2-V3 indicating transmural necrosis.

3. Left Bundle Branch Block (LBBB)

What it is: Delayed conduction through the left bundle branch, causing abnormal ventricular depolarization. Can be pre-existing (old) or new - a new LBBB in the context of chest pain is treated as a STEMI equivalent.
ECG Features (use the "WiLLiaM MaRRoW" mnemonic):
  • QRS duration >120 ms (broad complexes)
  • Broad, notched, monophasic R waves in lateral leads (I, aVL, V5, V6) - the "W" shape in RBBB leads, "M" shape in left leads
  • Deep, broad S waves (QS pattern) in V1-V3 - predominantly negative deflection
  • Discordant ST-T changes - ST and T wave opposite in polarity to the main QRS deflection (this is normal in LBBB and makes ischemia harder to detect)
  • No septal Q waves in I or V6
Clinical Significance: Associated with coronary artery disease, cardiomyopathy, hypertension. Makes interpretation of ischemia difficult. Sgarbossa criteria help identify STEMI superimposed on LBBB.
Classic LBBB pattern with wide QRS and monophasic R in lateral leads
Example: LBBB - wide QRS (>120 ms), broad R waves in I/aVL/V5-V6, deep S/QS pattern in V1-V3, discordant ST-T changes.
New-onset LBBB with ST changes
Example: New LBBB in the setting of chest pain - the ST elevation in V1-V3 is concordant with the QRS, raising concern for STEMI (Sgarbossa positive).

4. Complete (Third-Degree) AV Block

What it is: Total failure of conduction from atria to ventricles through the AV node. The atria and ventricles beat completely independently, controlled by separate pacemakers. This is a life-threatening emergency requiring pacing.
ECG Features:
  • Complete AV dissociation - P waves and QRS complexes march at their own independent rates
  • Atrial rate > ventricular rate (e.g., atria at 80 bpm, ventricles at 30-40 bpm)
  • No fixed relationship between P waves and QRS complexes (PR interval varies constantly)
  • Escape rhythm QRS morphology tells you the escape site:
    • Narrow QRS (junctional escape, 40-60 bpm) = more stable, AV nodal block
    • Wide QRS (ventricular escape, 20-40 bpm) = more dangerous, infra-Hisian block
Clinical Significance: Causes include ischemia (especially inferior MI affecting the AV nodal artery), drugs (digoxin, beta-blockers), Lyme disease, post-cardiac surgery. Requires temporary then permanent pacemaker.
Third-degree AV block with independent P waves and ventricular escape
Example: Complete heart block - P waves march at ~80 bpm while the ventricles escape at ~30 bpm with wide QRS complexes. There is no relationship between P waves and QRS.
Complete heart block rhythm strip
Example: Rhythm strip showing complete AV dissociation - P waves occasionally superimpose on T waves or QRS, but never trigger them.

5. Ventricular Tachycardia (VT)

What it is: A potentially life-threatening arrhythmia originating below the Bundle of His. Defined as ≥3 consecutive ventricular beats at rate >100 bpm. Can be monomorphic (uniform QRS) or polymorphic (varying QRS).
ECG Features:
  • Wide QRS complexes (>120 ms) - most important feature
  • Regular or near-regular rhythm at rate 100-250 bpm
  • AV dissociation - P waves independent of QRS (when visible)
  • Fusion beats - partial capture of a QRS by a sinus beat during dissociation (pathognomonic for VT)
  • Capture beats - a normal narrow QRS appearing among the wide complexes (also pathognomonic)
  • Concordance in precordial leads - all QRS complexes positive (positive concordance) or all negative (negative concordance)
  • Northwest axis (extreme left axis deviation) strongly favors VT
Brugada criteria for VT vs. SVT with aberrancy: Absence of RS complex in any precordial lead, AV dissociation, RS interval >100 ms, and morphology criteria.
Wide complex tachycardia - ventricular tachycardia with RBBB morphology and left axis deviation
Example: VT (fascicular/Belhassen type) - wide complex tachycardia with RBBB morphology and marked left axis deviation, a classic pattern of left ventricular VT.
Wide complex tachycardia with bizarre morphology
Example: Wide complex VT at ~116 bpm with bizarre QRS morphology (QRS ~200 ms), no clear P waves, and discordant T waves - classic features of ventricular origin.

6. Ventricular Fibrillation (VF)

What it is: Completely disorganized electrical activity in the ventricles - no effective cardiac output. This is cardiac arrest. The patient will be pulseless and unresponsive. Requires immediate CPR and defibrillation.
ECG Features:
  • No recognizable P waves, QRS complexes, or T waves
  • Completely chaotic, irregular waveforms of varying amplitude, shape, and frequency
  • No isoelectric baseline
  • Coarse VF: larger amplitude oscillations (>0.5 mV) - more amenable to defibrillation
  • Fine VF: smaller amplitude oscillations - often seen in prolonged arrest, may be mistaken for asystole
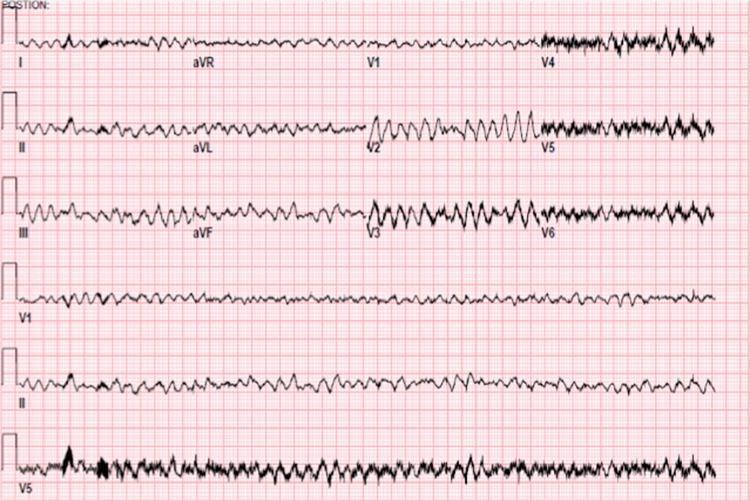
Clinical Significance: Most common arrhythmia in sudden cardiac death. Untreated VF converts to asystole within minutes. Every minute without defibrillation reduces survival by ~10%. Treat with CPR + immediate unsynchronized defibrillation.
Ventricular fibrillation - completely chaotic electrical activity
Example: VF - completely disorganized electrical activity with no identifiable cardiac complexes. Note the coarse fibrillatory waveforms of varying amplitude across all leads.

7. Sinus Bradycardia

What it is: A normal sinus rhythm at a rate below 60 bpm. The sinus node is the pacemaker, but it fires slowly. Can be physiological (athletes, during sleep) or pathological (drugs, sick sinus syndrome, hypothyroidism, inferior MI).
ECG Features:
  • Rate <60 bpm (usually 40-59 bpm in symptomatic cases)
  • Normal P wave before every QRS (upright in II, inverted in aVR)
  • Normal PR interval (120-200 ms)
  • Normal QRS complex (narrow, <120 ms)
  • Regular rhythm
When it's concerning:
  • Symptomatic (syncope, presyncope, fatigue, hypotension)
  • Rate <40 bpm
  • In the context of inferior STEMI (RCA occlusion affecting the SA nodal artery)
  • Not responding to atropine
Management: Atropine 0.5 mg IV for acute symptomatic bradycardia; transcutaneous or transvenous pacing for refractory cases. Treat reversible causes.
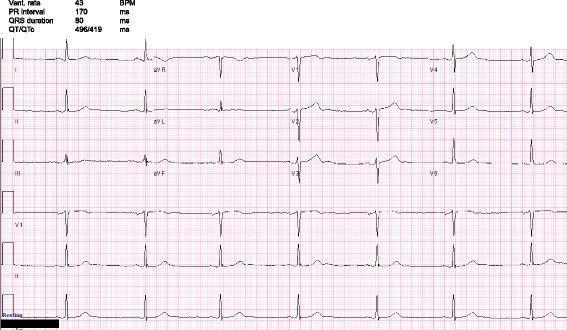
Sinus bradycardia - regular slow rhythm with normal P waves preceding each QRS
Example: Sinus bradycardia at 43 bpm (medication-induced) - each QRS is preceded by a normal P wave with a normal PR interval of 170 ms. QRS and T waves are completely normal.

8. Wolff-Parkinson-White (WPW) Syndrome

What it is: A congenital accessory pathway (Bundle of Kent) bypasses the AV node and directly connects atria to ventricles. This causes ventricular pre-excitation - part of the ventricle depolarizes early before the normal AV node signal arrives. In AF or flutter, the bypass tract can conduct at very fast rates (>300 bpm) - potentially causing VF and sudden death.
ECG Features (the classic triad):
  1. Short PR interval (<120 ms) - impulse bypasses the AV node delay
  2. Delta wave - slurred, slow upstroke at the beginning of the QRS complex (pre-excitation)
  3. Wide QRS (>120 ms) - due to the delta wave widening the complex
  • Secondary ST-T changes discordant with QRS
  • Can produce pseudo-infarct Q waves (negative delta waves)
  • Pathway location determined by delta wave polarity across leads
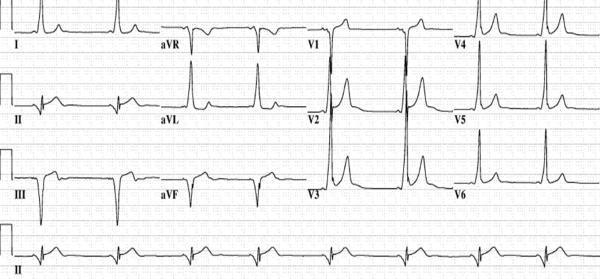
Dangerous pattern: Pre-excited AF - irregularly irregular very fast wide complex rhythm (rate >200 bpm) - treat with procainamide or electrical cardioversion, NOT adenosine or calcium channel blockers (which block the AV node and force all conduction down the accessory pathway).
WPW syndrome - short PR, delta wave, wide QRS with posteroseptal pathway
Example: WPW with posteroseptal pathway - note the short PR interval, clear delta waves slurring the QRS upstroke, and negative delta waves in inferior leads (II, III, aVF) mimicking inferior Q waves.

9. Hyperkalemia (ECG Changes)

What it is: Elevated serum potassium causes progressive, predictable ECG changes that worsen with rising K⁺ levels. This is one of the most important metabolic causes of ECG abnormality - hyperkalemia can cause fatal arrhythmias and requires urgent treatment.
ECG Changes by Serum K⁺ Level:
K⁺ LevelECG Finding
5.5-6.5 mEq/LPeaked (tented) T waves - narrow, tall, symmetric ("church steeple")
6.5-7.0 mEq/LPR prolongation, QRS widening begins
7.0-8.0 mEq/LAbsent/flat P waves, widened QRS (sinusoidal), ST changes
>8.0 mEq/LSine wave pattern - QRS merges with T wave
TerminalVF or asystole
Key mnemonic: "PEAKED T waves → P waves disappear → QRS Widens → Sine wave → Death"
Treatment: Calcium gluconate (membrane stabilization, buys time), insulin + dextrose (shifts K⁺ into cells), sodium bicarbonate, Kayexalate/patiromer (removes K⁺ from body), dialysis in severe/refractory cases.
Hyperkalemia - peaked tented T waves with features of Brugada phenocopy
Example: Hyperkalemia - tall, sharply peaked "tented" T waves prominent in V2-V6. Also note the prolonged PR interval (first-degree AV block) and the coved ST elevation in V1-V2 (Brugada phenocopy unmasked by hyperkalemia).

10. Atrial Flutter

What it is: A macroreentrant circuit in the right atrium, usually cycling around the tricuspid annulus (cavotricuspid isthmus). More organized than AF, producing the characteristic "sawtooth" flutter wave pattern at a regular ~300 bpm atrial rate.
ECG Features:
  • Sawtooth/flutter waves at atrial rate ~300 bpm (range: 250-350 bpm) - best seen in inferior leads (II, III, aVF) and V1
  • Flutter waves are negative in inferior leads (typical/clockwise flutter) - look like inverted saw teeth
  • Regular ventricular rhythm (usually) at a fraction of 300 bpm:
    • 2:1 block → ventricular rate ~150 bpm (most common presentation)
    • 3:1 block → ~100 bpm
    • 4:1 block → ~75 bpm
  • Narrow QRS unless BBB or pre-excitation
  • At 2:1 flutter, flutter waves can be hidden within QRS and T waves - use adenosine or carotid sinus massage to slow AV conduction and unmask the flutter waves
Clinical tip: Any narrow complex tachycardia at exactly 150 bpm should trigger suspicion for atrial flutter with 2:1 block until proven otherwise. The ventricular rate is "exactly" 150 because it's 300/2.

Quick Reference Summary Table

#ECG PatternRateRhythmP WavesQRSKey Feature
1Atrial FibrillationVariable 120-170Irregularly irregularAbsent (f waves)NarrowNo two R-R equal
2STEMIVariableRegularNormalNormalST elevation ≥1-2mm in contiguous leads
3LBBBVariableRegularNormalWide >120msBroad R in I/V5-6, QS in V1
4Complete AV BlockVentricles: 20-40Regular (dissociated)Present but unrelated to QRSWide (ventricular escape)Complete AV dissociation
5Ventricular Tachycardia100-250RegularDissociated (P≠QRS)Wide >120msAV dissociation, fusion/capture beats
6Ventricular FibrillationUninterpretableChaoticAbsentNo QRSCompletely chaotic baseline
7Sinus Bradycardia<60RegularNormal, 1:1NarrowAll normal, just slow
8WPWVariableVariableNormalWide (delta wave)Short PR + delta wave
9HyperkalemiaVariableVariableProgressive disappearanceProgressive wideningPeaked T waves → sine wave
10Atrial Flutter300 atrial / 75-150 ventricularRegularSawtooth waves ~300/minNarrowSawtooth at 300, HR = 150 with 2:1

Key Teaching Points

  • In any wide complex tachycardia, assume VT until proven otherwise - treating SVT drugs in VT can be fatal
  • New LBBB + chest pain = treat as STEMI (call the cath lab)
  • AF + very fast rate (>200 bpm) with wide QRS = pre-excited AF via accessory pathway - do not give AV nodal blockers
  • In AV block, look at the QRS width - narrow = junctional (more stable), wide = ventricular (needs pacing urgently)
  • Hyperkalemia kills silently - check ECG (and urgent K⁺) in any renal failure, crush injury, or acidosis patient

Ok give me an ECG as a test from the first 6 cases

Searching Images

ECG electrocardiogram clinical case quiz
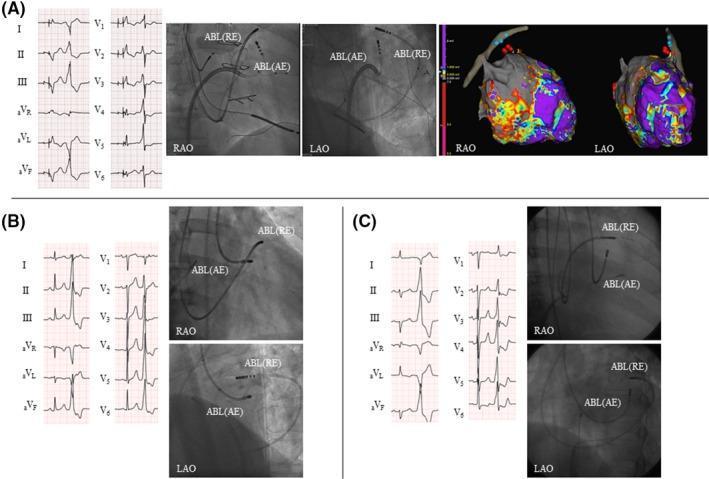
Educational composite image detailing three clinical cases (A, B, C) of bipolar radiofrequency catheter ablation (RFCA) for refractory ventricular premature complexes (VPCs). Each case includes a 12-lead electrocardiogram (ECG) and fluoroscopic images in Right Anterior Oblique (RAO) and Left Anterior Oblique (LAO) views. Case A additionally includes 3D electroanatomical mapping (EnSite) of the left ventricle and coronary sinus. The ECGs demonstrate different morphologies of VPCs, including Right Bundle Branch Block (RBBB) and Left Bundle Branch Block (LBBB) patterns with inferior axes. The fluoroscopic views depict catheter positioning for bipolar ablation, identifying the active electrode (ABL-AE) placed in the left ventricular endocardium and the return electrode (ABL-RE) positioned within the great cardiac vein (GCV) or anterior interventricular vein. The 3D maps in Case A show color-coded voltage/activation data with red tags marking bipolar ablation sites and blue tags marking unipolar sites. This material illustrates the technical approach to targeting intramural or epicardial substrates using a bipolar circuit between the endocardium and the coronary venous system.
Educational composite image detailing three clinical cases (A, B, C) of bipolar radiofrequency catheter ablation (RFCA) for refractory ventricular premature complexes (VPCs). Each case includes a 12-lead electrocardiogram (ECG) and fluoroscopic images in Right Anterior Oblique (RAO) and Left Anterior Oblique (LAO) views. Case A additionally includes 3D electroanatomical mapping (EnSite) of the left ventricle and coronary sinus. The ECGs demonstrate different morphologies of VPCs, including Right Bundle Branch Block (RBBB) and Left Bundle Branch Block (LBBB) patterns with inferior axes. The fluoroscopic views depict catheter positioning for bipolar ablation, identifying the active electrode (ABL-AE) placed in the left ventricular endocardium and the return electrode (ABL-RE) positioned within the great cardiac vein (GCV) or anterior interventricular vein. The 3D maps in Case A show color-coded voltage/activation data with red tags marking bipolar ablation sites and blue tags marking unipolar sites. This material illustrates the technical approach to targeting intramural or epicardial substrates using a bipolar circuit between the endocardium and the coronary venous system.

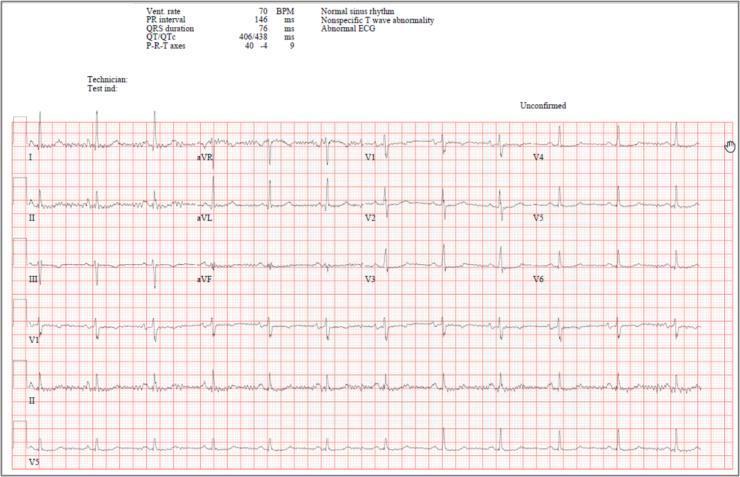
A standard 12-lead electrocardiogram (ECG) recorded on a red grid background, demonstrating clinical baseline data for a patient case. The recording includes standard limb leads (I, II, III), augmented leads (aVR, aVL, aVF), and precordial leads (V1-V6), supplemented by three continuous rhythm strips at the bottom. Automated measurements at the top left indicate a ventricular rate of 70 BPM, a PR interval of 146 ms, a QRS duration of 76 ms, and a QTc of 438 ms. The rhythm is interpreted as normal sinus rhythm based on consistent, upright P waves in leads I, II, and aVF, followed by narrow QRS complexes. Notable morphological findings include nonspecific T wave abnormalities, particularly subtle T wave flattening or inversions in certain leads. This diagnostic image serves as a baseline for monitoring cardiac electrical activity before the initiation of pharmacotherapy (e.g., Remdesivir), providing a reference for heart rate, conduction intervals, and repolarization patterns to detect potential drug-induced bradycardia or QT prolongation.
A standard 12-lead electrocardiogram (ECG) recorded on a red grid background, demonstrating clinical baseline data for a patient case. The recording includes standard limb leads (I, II, III), augmented leads (aVR, aVL, aVF), and precordial leads (V1-V6), supplemented by three continuous rhythm strips at the bottom. Automated measurements at the top left indicate a ventricular rate of 70 BPM, a PR interval of 146 ms, a QRS duration of 76 ms, and a QTc of 438 ms. The rhythm is interpreted as normal sinus rhythm based on consistent, upright P waves in leads I, II, and aVF, followed by narrow QRS complexes. Notable morphological findings include nonspecific T wave abnormalities, particularly subtle T wave flattening or inversions in certain leads. This diagnostic image serves as a baseline for monitoring cardiac electrical activity before the initiation of pharmacotherapy (e.g., Remdesivir), providing a reference for heart rate, conduction intervals, and repolarization patterns to detect potential drug-induced bradycardia or QT prolongation.

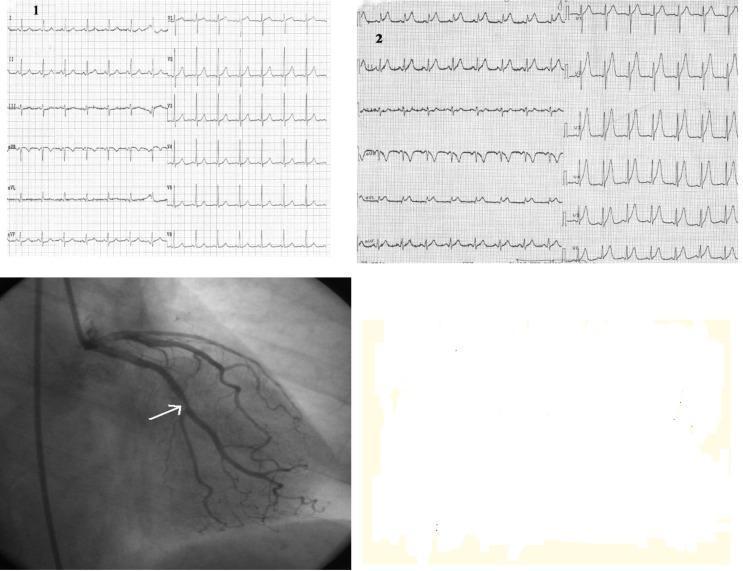
This composite figure presents a clinical case study of acute coronary syndrome through ECG comparison and invasive imaging. Panels 1 and 2 show 12-lead electrocardiogram (ECG) tracings. Panel 1 depicts a baseline sinus rhythm with normal repolarization. Panel 2, recorded during symptomatic chest pain, reveals significant ST-segment elevation in the high lateral (I, aVL) and precordial (V1-V6) leads, accompanied by hyperacute, tall, peaked T-waves, indicative of an acute anterolateral ST-elevation myocardial infarction (STEMI). Below the ECGs, a grayscale coronary angiogram (fluoroscopy) visualizes the left coronary artery system using radiopaque contrast. A white arrow points to a significant focal stenosis within the left circumflex coronary artery, specifically at the origin of the first marginal branch (Mg1). This visual combination illustrates the correlation between dynamic electrocardiographic changes during angina and the underlying obstructive coronary artery disease. The educational focus is on identifying acute ischemic patterns on ECG and their angiographic confirmation in the context of one-vessel coronary disease.
This composite figure presents a clinical case study of acute coronary syndrome through ECG comparison and invasive imaging. Panels 1 and 2 show 12-lead electrocardiogram (ECG) tracings. Panel 1 depicts a baseline sinus rhythm with normal repolarization. Panel 2, recorded during symptomatic chest pain, reveals significant ST-segment elevation in the high lateral (I, aVL) and precordial (V1-V6) leads, accompanied by hyperacute, tall, peaked T-waves, indicative of an acute anterolateral ST-elevation myocardial infarction (STEMI). Below the ECGs, a grayscale coronary angiogram (fluoroscopy) visualizes the left coronary artery system using radiopaque contrast. A white arrow points to a significant focal stenosis within the left circumflex coronary artery, specifically at the origin of the first marginal branch (Mg1). This visual combination illustrates the correlation between dynamic electrocardiographic changes during angina and the underlying obstructive coronary artery disease. The educational focus is on identifying acute ischemic patterns on ECG and their angiographic confirmation in the context of one-vessel coronary disease.

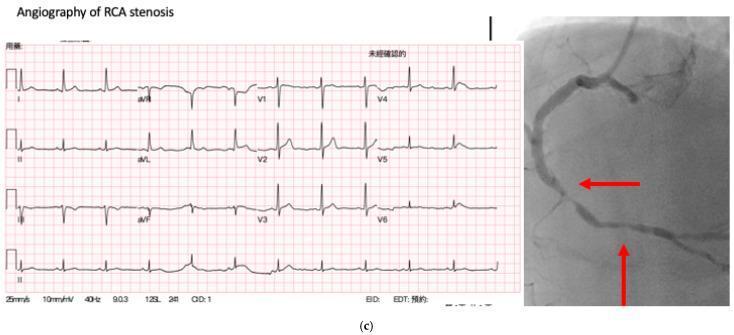
This composite diagnostic image illustrates a clinical case of coronary artery disease (CAD), specifically featuring a 12-lead electrocardiogram (ECG) and a corresponding coronary angiogram of the right coronary artery (RCA). The ECG portion displays a standard 12-lead layout (Leads I, II, III, aVR, aVL, aVF, and V1-V6) on a red grid background, showing rhythmic cardiac waveforms including identifiable P-waves, QRS complexes, and T-waves. The accompanying grayscale coronary angiogram provides radiographic visualization of the RCA. Two red arrows indicate significant focal narrowing, representing high-grade (>70%) stenosis in the vessel lumen. This comparison serves as an educational example of how clinical imaging (angiography) provides definitive evidence of obstructive CAD in a patient whose ECG findings are being analyzed for predictive modeling. The visual components emphasize the anatomical location of coronary lesions in the context of cardiovascular diagnostic workups.
This composite diagnostic image illustrates a clinical case of coronary artery disease (CAD), specifically featuring a 12-lead electrocardiogram (ECG) and a corresponding coronary angiogram of the right coronary artery (RCA). The ECG portion displays a standard 12-lead layout (Leads I, II, III, aVR, aVL, aVF, and V1-V6) on a red grid background, showing rhythmic cardiac waveforms including identifiable P-waves, QRS complexes, and T-waves. The accompanying grayscale coronary angiogram provides radiographic visualization of the RCA. Two red arrows indicate significant focal narrowing, representing high-grade (>70%) stenosis in the vessel lumen. This comparison serves as an educational example of how clinical imaging (angiography) provides definitive evidence of obstructive CAD in a patient whose ECG findings are being analyzed for predictive modeling. The visual components emphasize the anatomical location of coronary lesions in the context of cardiovascular diagnostic workups.

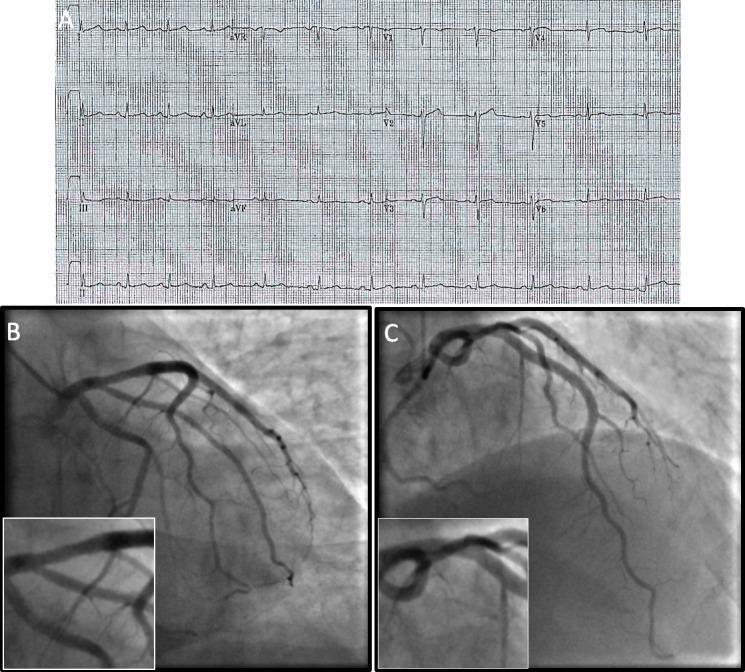
A multi-panel medical diagnostic image set for a cardiology case study. Panel A displays a standard 12-lead Electrocardiogram (ECG) recorded on standard grid paper. The tracing shows leads I, II, III, aVR, aVL, aVF, and precordial leads V1-V6. The ECG exhibits a sinus rhythm with subtle ST-segment changes, relevant for evaluating acute coronary syndrome. Panels B and C are invasive coronary angiograms of the left coronary system. Panel B shows a Right Anterior Oblique (RAO)-caudal view, providing a detailed visualization of the circumflex artery and the proximal Left Anterior Descending (LAD) artery. Panel C presents an Anterior-Posterior (AP)-cranial view, optimized for viewing the mid-to-distal LAD and its diagonal branches. Both angiographic panels include magnified insets focusing on the proximal LAD to assess for subtle atherosclerotic plaques or luminal irregularities. This figure illustrates the clinical workup for a patient presenting with chest pain and elevated troponins, emphasizing the correlation between electrical heart activity and vascular imaging.
A multi-panel medical diagnostic image set for a cardiology case study. Panel A displays a standard 12-lead Electrocardiogram (ECG) recorded on standard grid paper. The tracing shows leads I, II, III, aVR, aVL, aVF, and precordial leads V1-V6. The ECG exhibits a sinus rhythm with subtle ST-segment changes, relevant for evaluating acute coronary syndrome. Panels B and C are invasive coronary angiograms of the left coronary system. Panel B shows a Right Anterior Oblique (RAO)-caudal view, providing a detailed visualization of the circumflex artery and the proximal Left Anterior Descending (LAD) artery. Panel C presents an Anterior-Posterior (AP)-cranial view, optimized for viewing the mid-to-distal LAD and its diagonal branches. Both angiographic panels include magnified insets focusing on the proximal LAD to assess for subtle atherosclerotic plaques or luminal irregularities. This figure illustrates the clinical workup for a patient presenting with chest pain and elevated troponins, emphasizing the correlation between electrical heart activity and vascular imaging.

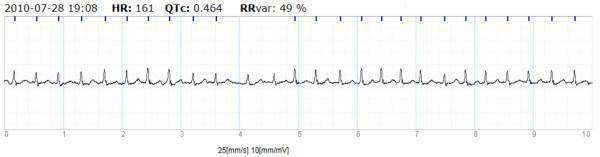
This diagnostic image shows a 10-second single-lead electrocardiogram (ECG) recording obtained from a handheld device, demonstrating a clinical case of atrial fibrillation (AF). The waveform displays a tachycardic, irregularly irregular rhythm with a high frequency of QRS complexes. Key automated measurements visible at the top of the strip include a heart rate (HR) of 161 beats per minute, a corrected QT interval (QTc) of 0.464, and an RR variability (RRvar) of 49%. The baseline lacks distinct, organized P waves, replaced instead by irregular fibrillatory activity. The ECG is presented on a standard grid with a paper speed of 25 mm/s and a sensitivity of 10 mm/mV. This visual serves as an educational example of how portable rhythm monitoring technology can identify paroxysmal or persistent atrial fibrillation in a community or home-based clinical setting.

This diagnostic image shows a 10-second single-lead electrocardiogram (ECG) recording obtained from a handheld device, demonstrating a clinical case of atrial fibrillation (AF). The waveform displays a tachycardic, irregularly irregular rhythm with a high frequency of QRS complexes. Key automated measurements visible at the top of the strip include a heart rate (HR) of 161 beats per minute, a corrected QT interval (QTc) of 0.464, and an RR variability (RRvar) of 49%. The baseline lacks distinct, organized P waves, replaced instead by irregular fibrillatory activity. The ECG is presented on a standard grid with a paper speed of 25 mm/s and a sensitivity of 10 mm/mV. This visual serves as an educational example of how portable rhythm monitoring technology can identify paroxysmal or persistent atrial fibrillation in a community or home-based clinical setting.

Clinical photograph showing two methods of acquiring electrocardiogram (ECG) data using a prototype wrist-worn wearable device. The device features a square digital display and integrated dry electrodes for wire-free recording. The left panel illustrates a single-lead ECG acquisition where the patient places their contralateral index finger on a top-facing electrode while the device is worn on the wrist, creating a Lead I-like circuit. The right panel demonstrates a six-lead ECG acquisition technique; here, the patient presses the device (worn on the wrist) against the skin of the lower abdomen/thigh area. This configuration utilizes three distinct contact points: one on the inner surface of the device against the wearing wrist, one on the top enclosure touched by the finger, and a third on the device's bracelet or rear sensor against the torso. The screen displays real-time status indicators including heart rate and data logging confirmation ('WRITING'). This technology aims to provide clinical-grade multi-lead cardiac monitoring, such as identifying atrial fibrillation (AF), in a mobile, user-operated format.
Clinical photograph showing two methods of acquiring electrocardiogram (ECG) data using a prototype wrist-worn wearable device. The device features a square digital display and integrated dry electrodes for wire-free recording. The left panel illustrates a single-lead ECG acquisition where the patient places their contralateral index finger on a top-facing electrode while the device is worn on the wrist, creating a Lead I-like circuit. The right panel demonstrates a six-lead ECG acquisition technique; here, the patient presses the device (worn on the wrist) against the skin of the lower abdomen/thigh area. This configuration utilizes three distinct contact points: one on the inner surface of the device against the wearing wrist, one on the top enclosure touched by the finger, and a third on the device's bracelet or rear sensor against the torso. The screen displays real-time status indicators including heart rate and data logging confirmation ('WRITING'). This technology aims to provide clinical-grade multi-lead cardiac monitoring, such as identifying atrial fibrillation (AF), in a mobile, user-operated format.

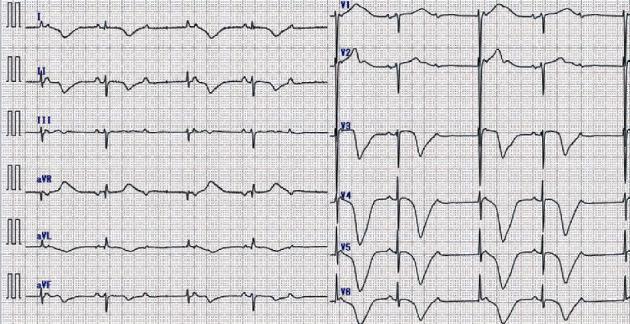
A 12-lead electrocardiogram (ECG) demonstrating a clinical case of complete atrioventricular (AV) block. The tracing shows a slow ventricular rate of approximately 40 beats per minute with evidence of AV dissociation, where P waves and QRS complexes occur independently of one another. The QRS complexes are wide, suggesting a junctional or ventricular escape rhythm. Significant repolarization abnormalities are present, most notably deep, symmetric T-wave inversions in the lateral (I, aVL) and inferior (II, aVF) leads, as well as throughout the precordial leads (V3-V6). These diffuse T-wave changes are characteristic findings that can be associated with Takotsubo cardiomyopathy (TCM) or severe myocardial ischemia. The ECG layout follows a standard format with limb leads (I, II, III, aVR, aVL, aVF) on the left and precordial leads (V1-V6) on the right, providing a comprehensive view of cardiac electrical activity and conduction disturbances.
A 12-lead electrocardiogram (ECG) demonstrating a clinical case of complete atrioventricular (AV) block. The tracing shows a slow ventricular rate of approximately 40 beats per minute with evidence of AV dissociation, where P waves and QRS complexes occur independently of one another. The QRS complexes are wide, suggesting a junctional or ventricular escape rhythm. Significant repolarization abnormalities are present, most notably deep, symmetric T-wave inversions in the lateral (I, aVL) and inferior (II, aVF) leads, as well as throughout the precordial leads (V3-V6). These diffuse T-wave changes are characteristic findings that can be associated with Takotsubo cardiomyopathy (TCM) or severe myocardial ischemia. The ECG layout follows a standard format with limb leads (I, II, III, aVR, aVL, aVF) on the left and precordial leads (V1-V6) on the right, providing a comprehensive view of cardiac electrical activity and conduction disturbances.

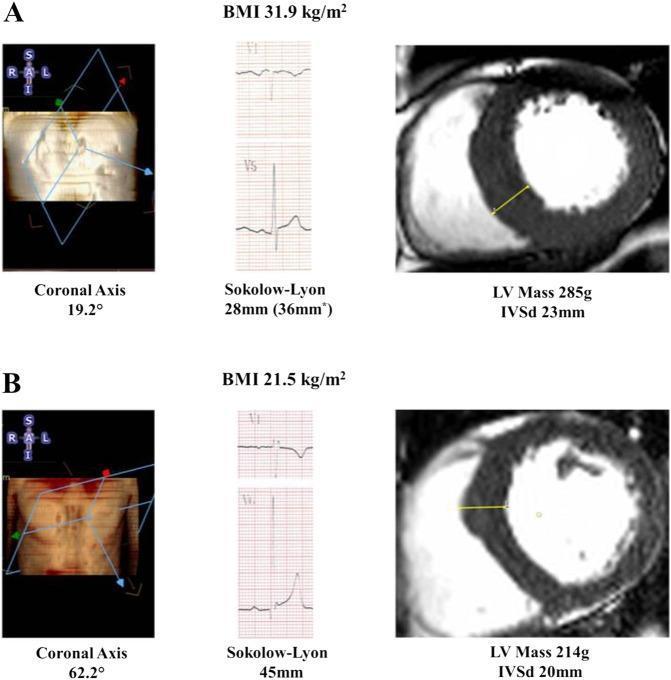
This comparison chart illustrates the impact of Body Mass Index (BMI) and anatomical heart orientation on the diagnostic accuracy of electrocardiogram (ECG) voltage criteria for left ventricular hypertrophy (LVH). The image presents two clinical cases (A and B) featuring three components: a coronal axis scout image, ECG tracings (leads V1 and V5), and cardiac magnetic resonance (CMR) short-axis views. Case A (BMI 31.9 kg/m²) demonstrates a leftward-deviated coronal axis of 19.2°, resulting in a falsely negative Sokolow-Lyon voltage (28mm) despite a high LV mass (285g) and thickened intraventricular septum (IVSd 23mm) on CMR. Case B (BMI 21.5 kg/m²) shows a more vertical coronal axis of 62.2° with a positive Sokolow-Lyon voltage (45mm) and a lower LV mass (214g). The diagram highlights how obesity-related anatomical shifts and increased chest wall distance can attenuate ECG surface voltages, potentially masking pathological hypertrophy. Key educational concepts include the correlation between thoracic anatomy, BMI, and the sensitivity of Sokolow-Lyon criteria in detecting CMR-verified LVH.
This comparison chart illustrates the impact of Body Mass Index (BMI) and anatomical heart orientation on the diagnostic accuracy of electrocardiogram (ECG) voltage criteria for left ventricular hypertrophy (LVH). The image presents two clinical cases (A and B) featuring three components: a coronal axis scout image, ECG tracings (leads V1 and V5), and cardiac magnetic resonance (CMR) short-axis views. Case A (BMI 31.9 kg/m²) demonstrates a leftward-deviated coronal axis of 19.2°, resulting in a falsely negative Sokolow-Lyon voltage (28mm) despite a high LV mass (285g) and thickened intraventricular septum (IVSd 23mm) on CMR. Case B (BMI 21.5 kg/m²) shows a more vertical coronal axis of 62.2° with a positive Sokolow-Lyon voltage (45mm) and a lower LV mass (214g). The diagram highlights how obesity-related anatomical shifts and increased chest wall distance can attenuate ECG surface voltages, potentially masking pathological hypertrophy. Key educational concepts include the correlation between thoracic anatomy, BMI, and the sensitivity of Sokolow-Lyon criteria in detecting CMR-verified LVH.

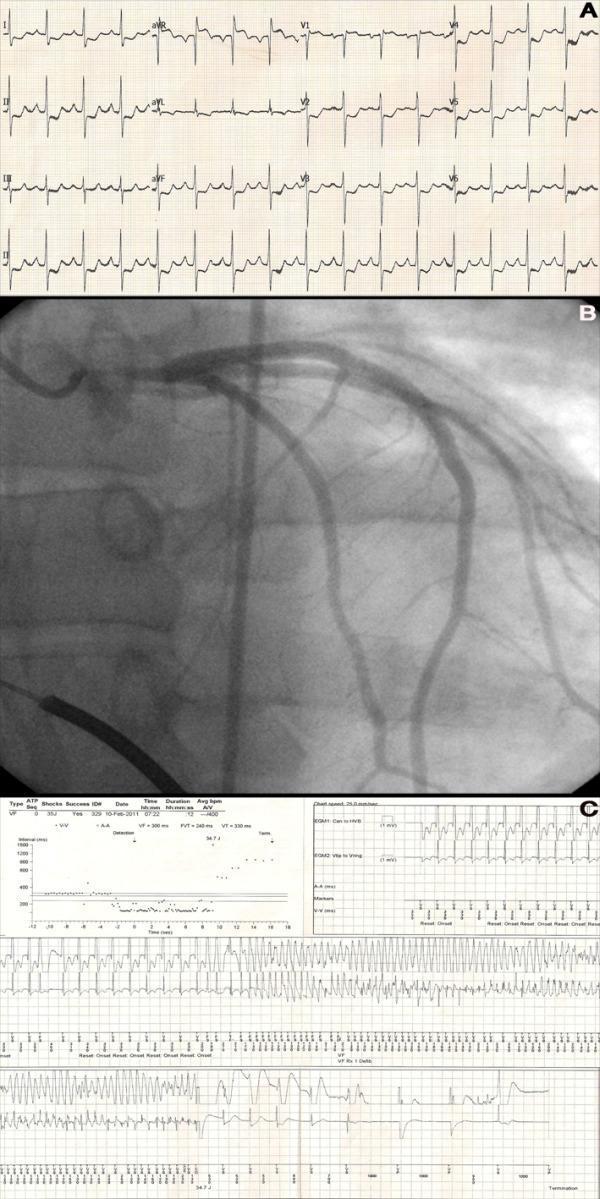
A three-panel figure illustrating a clinical case of acute myocardial ischemia and arrhythmia. Panel A shows a 12-lead electrocardiogram (ECG) with diffuse or global ST-segment depression in the precordial (V2-V6) and limb leads (I, II, aVL, aVF), accompanied by reciprocal ST-segment elevation in lead aVR and V1, a pattern highly suggestive of left main coronary artery occlusion or multi-vessel disease. Panel B presents a coronary angiogram depicting the left coronary system, identifying a significant filling defect within a stent in the left main coronary artery (LMCA), indicating 95% stent thrombosis despite preserved distal TIMI III flow. Panel C displays an implantable cardioverter-defibrillator (ICD) interrogation report, including an interval plot and stored intracardiac electrogram (EGM). The EGM demonstrates a rapid, disorganized ventricular rhythm characteristic of ventricular fibrillation (VF), followed by the delivery of a successful high-energy shock that terminated the arrhythmia and restored a slower, organized rhythm. This composite visualizes the electrical, anatomical, and device-management aspects of a critical cardiac event.

A three-panel figure illustrating a clinical case of acute myocardial ischemia and arrhythmia. Panel A shows a 12-lead electrocardiogram (ECG) with diffuse or global ST-segment depression in the precordial (V2-V6) and limb leads (I, II, aVL, aVF), accompanied by reciprocal ST-segment elevation in lead aVR and V1, a pattern highly suggestive of left main coronary artery occlusion or multi-vessel disease. Panel B presents a coronary angiogram depicting the left coronary system, identifying a significant filling defect within a stent in the left main coronary artery (LMCA), indicating 95% stent thrombosis despite preserved distal TIMI III flow. Panel C displays an implantable cardioverter-defibrillator (ICD) interrogation report, including an interval plot and stored intracardiac electrogram (EGM). The EGM demonstrates a rapid, disorganized ventricular rhythm characteristic of ventricular fibrillation (VF), followed by the delivery of a successful high-energy shock that terminated the arrhythmia and restored a slower, organized rhythm. This composite visualizes the electrical, anatomical, and device-management aspects of a critical cardiac event.

I have a great selection. I'll pick a clean, unambiguous 12-lead ECG from the results - the complete AV block case is a perfect clean test ECG. Let me present it without revealing the answer.

🫀 ECG Test — What's Your Diagnosis?

Clinical scenario: A 68-year-old man presents to the ED with sudden onset dizziness, near-syncope, and feeling "slow." BP is 85/60 mmHg. He is on no cardiac medications. Here is his 12-lead ECG:
ECG Test

Answer the following questions before scrolling down:
  1. What is the ventricular rate?
  2. What is the relationship between the P waves and QRS complexes?
  3. Are the QRS complexes narrow or wide?
  4. What is your diagnosis?
  5. What is your immediate management?

(Take your time - reply with your answers when ready and I'll give you full feedback with the explanation!)

Give me all answers

Here is the full answer breakdown for the ECG test:

✅ ECG Test — Full Answer & Explanation

ECG Answer

Q1. What is the ventricular rate?

~40 beats per minute
Count the QRS complexes - they are slow, widely spaced, and regular at approximately 40 bpm. The atrial rate (P waves) is faster, around 80 bpm. This difference between atrial and ventricular rates is the first major clue.

Q2. What is the relationship between P waves and QRS complexes?

None whatsoever - complete AV dissociation
Look carefully at the P waves. They march through the tracing at their own rate (~80 bpm), completely ignoring the QRS complexes. Some P waves land before a QRS, some land on T waves, some land inside a QRS - but no P wave actually conducts to produce a QRS. The PR interval is never constant. This is the defining feature of the diagnosis.

Q3. Are the QRS complexes narrow or wide?

Wide (>120 ms)
The QRS complexes are broad and abnormal in morphology. This tells you the escape pacemaker is ventricular in origin (below the Bundle of His), not junctional. This is the more dangerous type of complete heart block - ventricular escape rhythms are slower (20-40 bpm), less reliable, and more prone to sudden arrest.
There are also deep, symmetric T-wave inversions in lateral and precordial leads (I, aVL, V3-V6), suggesting associated myocardial ischemia or Takotsubo cardiomyopathy as the underlying cause.

Q4. Diagnosis

🔴 Complete (Third-Degree) AV Block with Ventricular Escape Rhythm

The three diagnostic criteria are all met:
CriterionFinding on this ECG
P waves present at regular rate✅ ~80 bpm, regular
QRS complexes present at slower regular rate✅ ~40 bpm, regular
No relationship between P and QRS✅ PR interval completely variable
The wide QRS confirms a ventricular (infra-Hisian) escape rhythm - the most hemodynamically unstable form.
The deep T-wave inversions throughout the lateral and precordial leads suggest this may be in the context of acute ischemia or Takotsubo cardiomyopathy precipitating the block.

Q5. Immediate Management

Step 1 - Stabilise immediately

  • IV access + continuous cardiac monitoring + defibrillator at bedside
  • Supplemental oxygen
  • 12-lead ECG (already done)

Step 2 - Pharmacological bridge

  • Atropine 0.5 mg IV (repeat up to 3 mg total) - note: often ineffective in infra-Hisian block (below the AV node), but worth trying
  • If atropine fails: Adrenaline (epinephrine) 2-10 mcg/min IV infusion or dopamine 2-10 mcg/kg/min

Step 3 - Pacing (definitive)

  • Transcutaneous pacing immediately if haemodynamically unstable (BP 85/60 as in this case)
  • Followed by transvenous temporary pacing once IV access secured
  • Assess for reversible causes (inferior MI? drug toxicity? Lyme disease? electrolyte disturbance?)
  • If no reversible cause found → permanent pacemaker implantation

Step 4 - Investigate the cause

  • Urgent troponin, electrolytes, TFTs, Lyme serology
  • Echocardiogram (look for wall motion abnormalities - the T-wave inversions here raise concern for Takotsubo)
  • Coronary angiography if ischaemia suspected

Summary at a Glance

Complete (3rd degree) AV block = P waves and QRS complexes completely ignore each other. Wide QRS = ventricular escape = dangerous. This patient needs pacing NOW - he is bradycardic, hypotensive, and near-syncopal.
Memory hook: "The atria and ventricles have broken up. They are both in the room but not talking to each other."

Ready for the next test ECG? I can give you one from any of the other 5 cases (AF, STEMI, LBBB, VT, or VF)!
This is a shared conversation. Sign in to Orris to start your own chat.