I now have comprehensive content and images. Let me update todos and compile the final answer:---
Biopsy Techniques in Orthopedics
Introduction and Importance
A biopsy is the ultimate diagnostic technique for evaluating musculoskeletal neoplasms - both bone and soft-tissue tumors. It must be treated as a carefully planned surgical procedure, not an afterthought. The landmark studies by Mankin et al. (1982 and 1996) demonstrated that improperly performed biopsies:
- Led to major diagnostic errors in 13.5% of cases
- Caused complications in 15.9%
- Resulted in unnecessary amputations in 3% of patients
- Were 2-12x more likely to cause problems when done at a non-specialist center
Campbell's Operative Orthopaedics (15th ed., 2026): "Errors in diagnosis, nonrepresentative or technically poor biopsy specimens, and wound complications have been found to occur more frequently when the biopsy was done by a surgeon at a referring institution rather than by an orthopaedic oncologist."
Golden Rule - Pre-Biopsy Planning
A biopsy should be planned as carefully as the definitive surgical procedure.
Complete the following BEFORE biopsy:
- Full clinical examination
- Laboratory investigations (CBC, LFT, calcium, phosphate, LDH, PSA, protein electrophoresis)
- Complete radiological staging:
- Plain X-rays (AP + lateral)
- MRI of the entire compartment
- CT scan of chest, abdomen, pelvis
- Bone scan (technetium-99)
- PET-CT where indicated
Why this matters: Imaging artifacts from a poorly placed biopsy incision can obscure staging findings; moreover, the pathologist needs correlative imaging to make an accurate diagnosis.
Fundamental Principles of Orthopedic Biopsy (Mankin's Principles)
- The biopsy track must be considered contaminated with tumor cells - both needle and incisional tracks
- The biopsy track must be excised en bloc with the tumor at the time of definitive resection
- Placement of the incision/needle must be within the planned definitive surgical incision
- Refer before you biopsy - if primary malignancy is suspected, refer to a musculoskeletal oncologist first
- Longitudinal incisions only - never transverse incisions on limbs
- Work through a single muscle compartment - never violate intermuscular planes
- Avoid major neurovascular structures
- Meticulous hemostasis - hematoma spreads tumor cells
- The surgeon who biopsies should perform the definitive surgery (or work in close coordination)
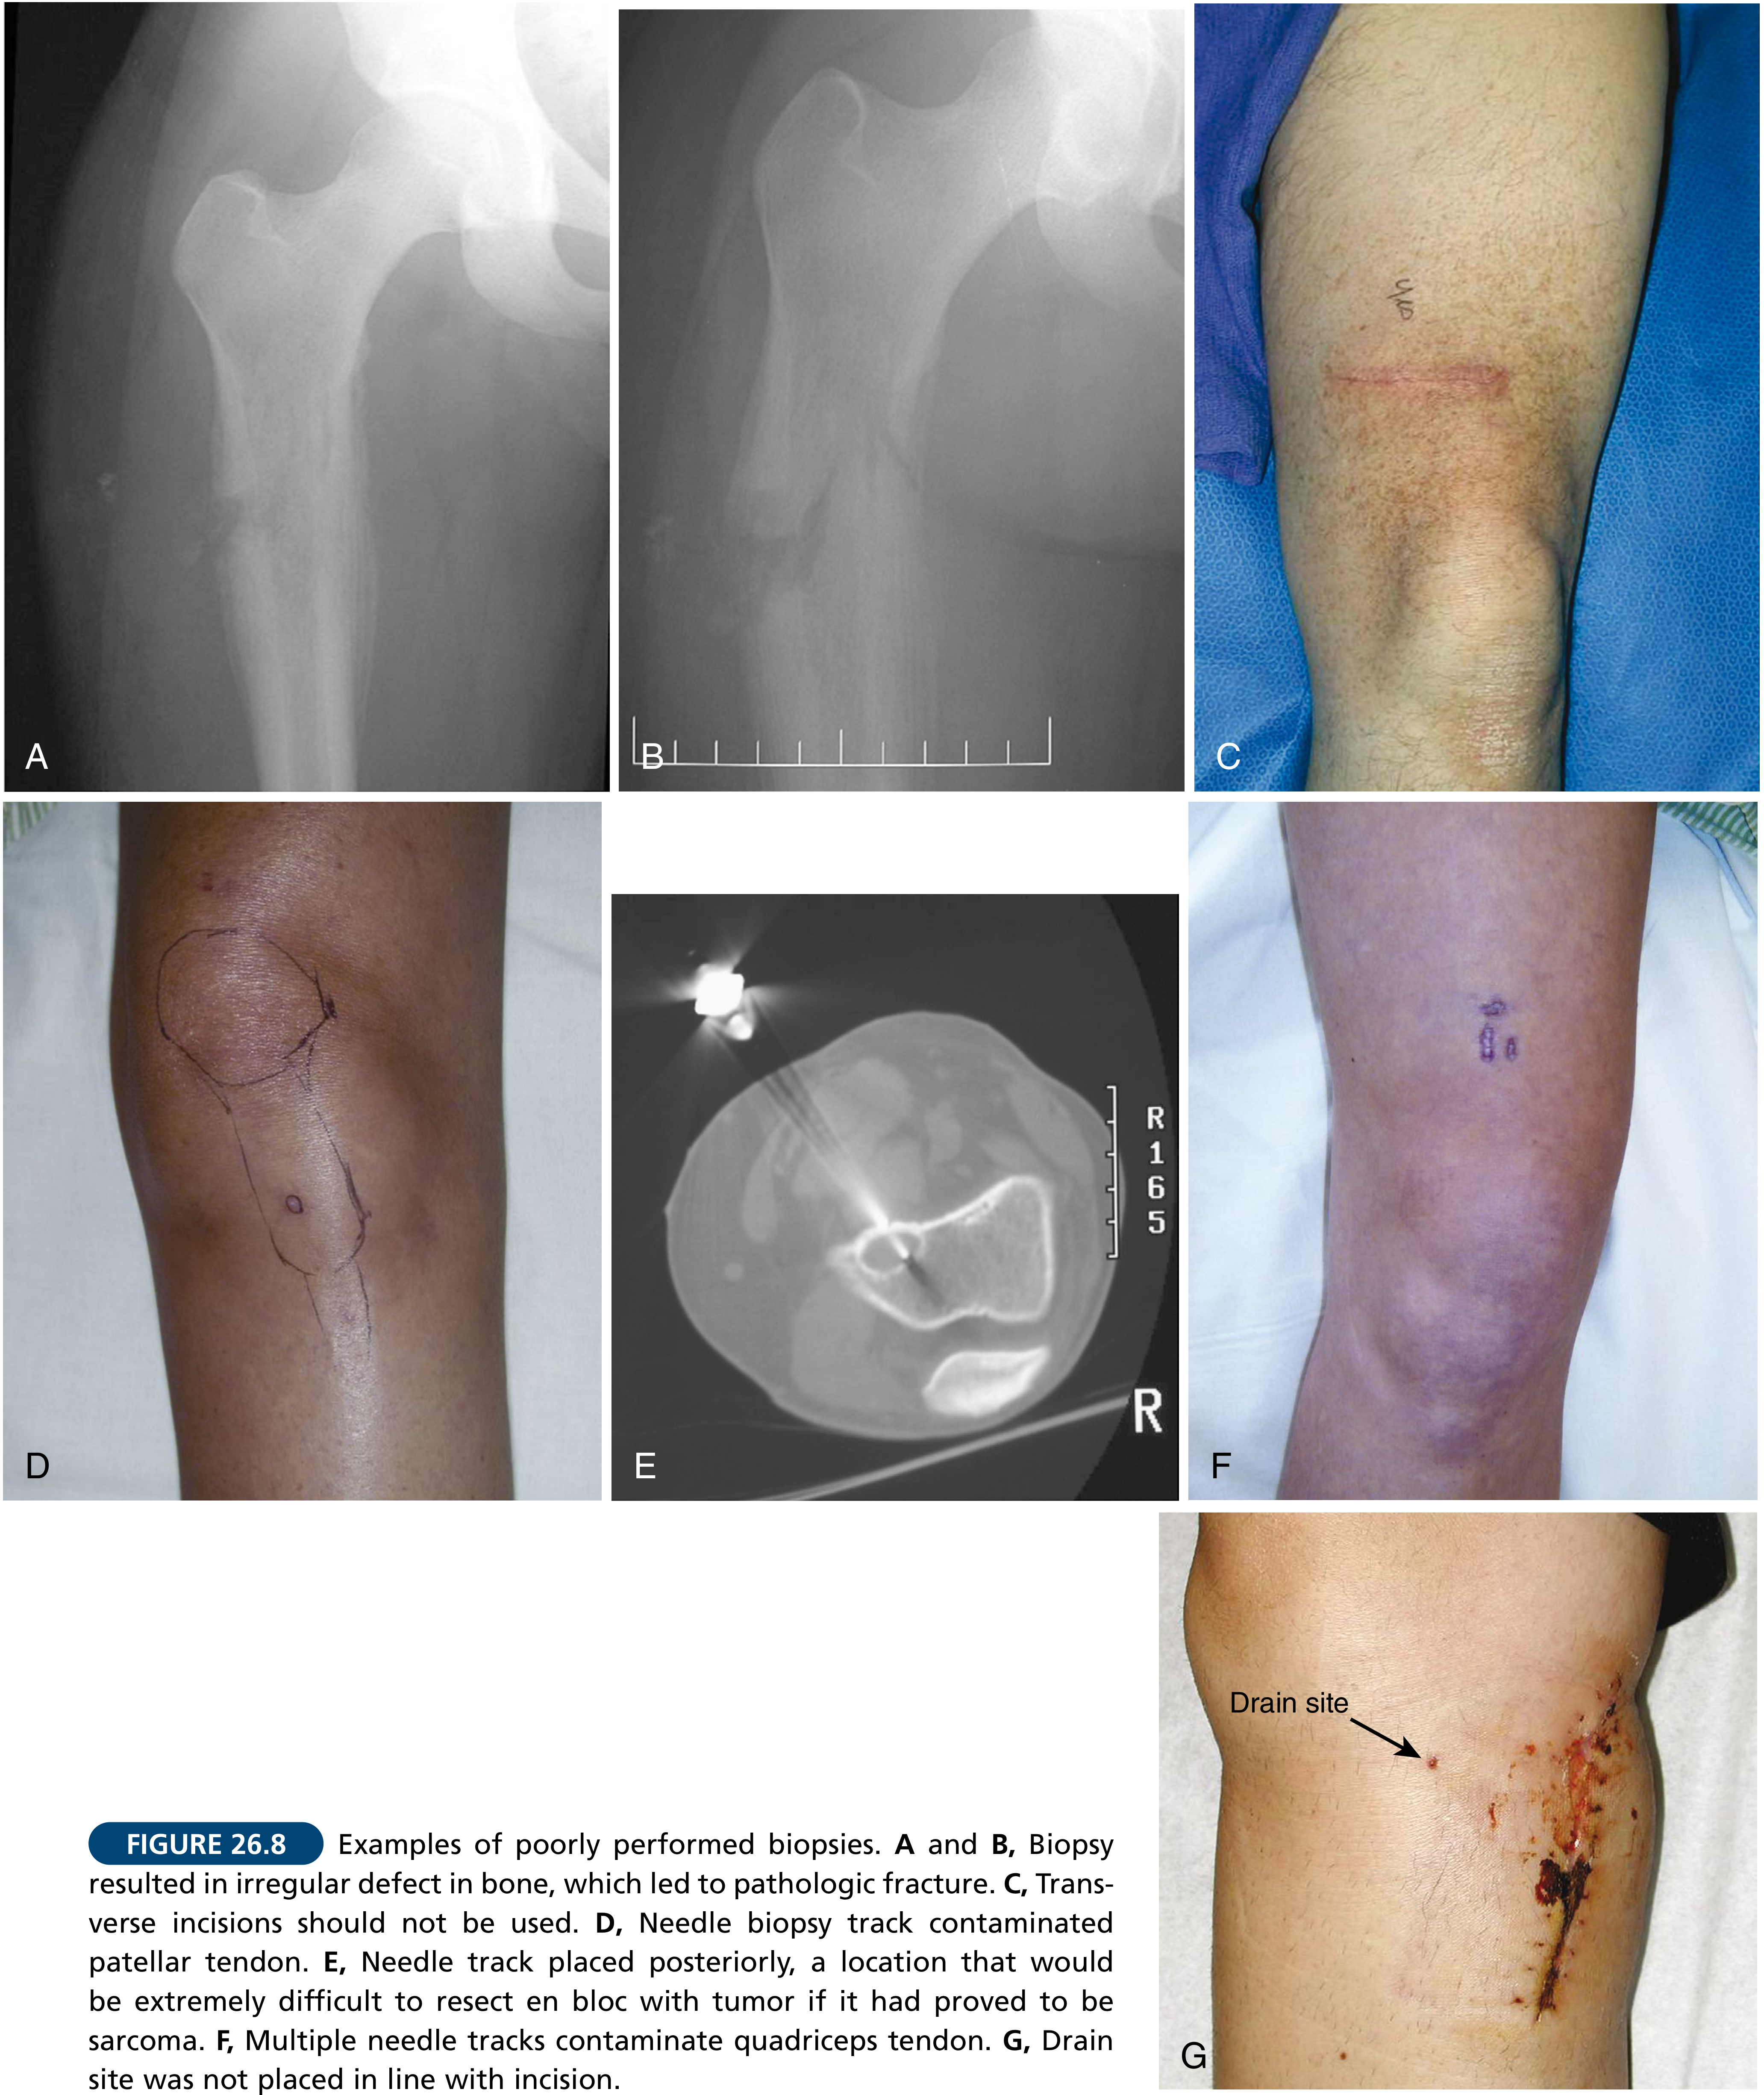
Figure 26.8 (Campbell's, 2026): Examples of poorly performed biopsies. A & B: Irregular bone defect causing pathologic fracture. C: Transverse incision - should NEVER be used. D: Needle track contaminating patellar tendon. E: Posterior needle track - impossible to resect. F: Multiple needle tracks contaminating quadriceps. G: Drain not placed in line with incision.
Classification of Biopsy Types
| BIOPSY TYPE | TISSUE OBTAINED | ADVANTAGES | DISADVANTAGES |
|---|
| Fine-needle aspiration (FNAC) | Cells only | Cost-effective, fewer complications, good for obese patients or tumor near NV bundle | Small sample, needs expert cytopathologist, no tissue architecture |
| Core needle biopsy | Small tissue core | Cost-effective, more tissue than FNAC, preserves architecture | More complications than FNAC, limited volume |
| Incisional biopsy | Adequate sample of mass | Gold standard, adequate tissue for all ancillary studies | Higher complications, may compromise definitive resection |
| Excisional biopsy | Entire lesion | Diagnostic + therapeutic for small lesions | Risk of seeding, increased complications if malignant |
(Campbell's Operative Orthopaedics, 15th ed. 2026, Table 26.4)
Type 1: Fine-Needle Aspiration Cytology (FNAC)
Principle
A thin needle (22-25 gauge) is passed into the lesion to aspirate loose cells for cytological examination. It provides cytology only - no tissue architecture.
Indications
- High suspicion of metastatic disease (most accurate use - 95% accuracy)
- Suspected infection / osteomyelitis (for culture and sensitivity)
- Lymph node assessment
- Recurrent known tumors for rapid confirmation
- Lesions near neurovascular bundles (thin needle = less contamination risk)
Technique
- 22-25 gauge needle attached to a 20 mL syringe
- Local anesthesia
- Needle directed into tumor under imaging guidance (ultrasound/CT) or palpation
- Suction applied while rotating the needle to collect cells
- Material expressed onto glass slides for Giemsa/Papanicolaou staining
Accuracy
- 90% accurate for determining malignancy vs. benign
- Much lower accuracy (~60-70%) for specific tumor type (subtype differentiation)
- Accuracy for metastatic disease: ~95%
- Benign primary tumors: ~60-70% (least accurate)
Advantages
- Outpatient procedure
- Cheap, minimal equipment
- Very low complication rate
- Near-zero contamination risk (22-25G needle tracks don't seed significantly)
Limitations
- No tissue architecture assessment
- Cannot grade tumors
- Cannot perform immunohistochemistry, cytogenetics, flow cytometry on cell aspirate
- Needs a specialist cytopathologist
Type 2: Core Needle Biopsy (CNB)
Core needle biopsy is currently the preferred first-line biopsy method for most musculoskeletal tumors in specialized centers.
Needles Used
For soft-tissue lesions: Tru-Cut needle (spring-loaded gun)
Step-by-step Tru-Cut needle mechanism: (1) Needle with slot positioned at lesion edge, (2) Push inner needle into lesion, (3) Slide outer sheath over to cut specimen, (4) Withdraw entire assembly with core sample trapped in slot.
For bone lesions: Jamshidi needle / Trephine
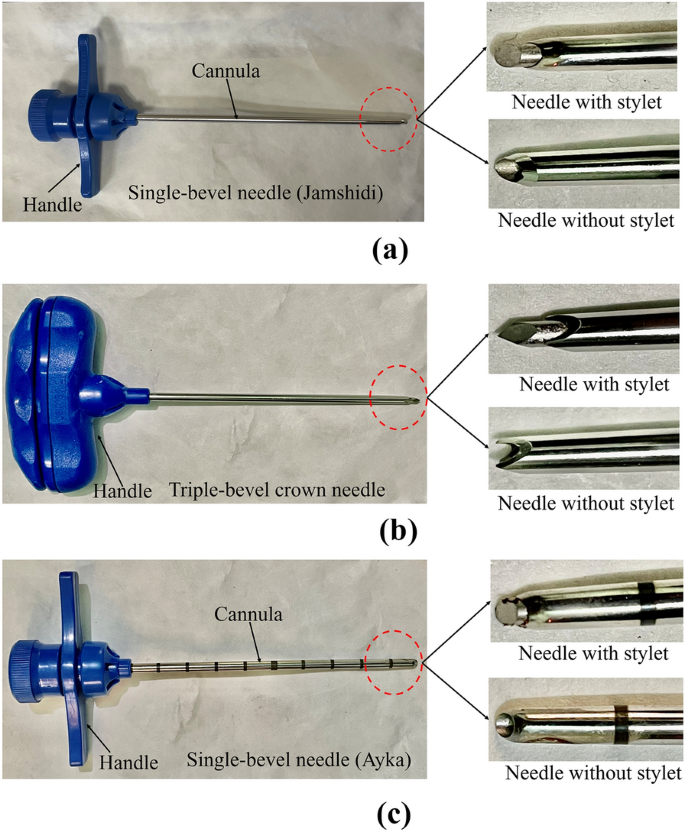
Types of bone biopsy needles: (a) Jamshidi single-bevel needle with cannula and stylet, (b) Triple-bevel crown needle, (c) Ayka single-bevel needle
Technique - Soft Tissue (Tru-Cut)
- Local anesthetic infiltration (minimal - don't over-infiltrate, extends contamination zone)
- Small stab incision (same axis as planned surgical incision)
- Spring-loaded Tru-Cut gun introduced until tip enters tumor
- Trigger fired: inner needle advances, slots into tumor; outer sheath slides forward cutting the core
- Needle withdrawn with core specimen in the slot
- 2-3 cores obtained from same skin puncture (different angulations)
- Each core placed in formalin (one kept fresh for culture/molecular studies)
Technique - Bone (Jamshidi Needle)
- Stab incision through skin
- Jamshidi needle (outer cannula + inner trocar) directed to bone surface
- Rotatory drilling motion used to penetrate outer cortex
- Trocar withdrawn; cannula advanced into bone marrow/tumor
- Cannula rotated to core out tissue
- Withdrawn; specimen pushed out with stylet
- Hole plugged with bone wax or methylcellulose
Image Guidance Options
- CT-guided (gold standard for deep/inaccessible lesions)
- Ultrasound-guided (soft tissue, superficial lesions, real-time)
- Fluoroscopy-guided (bone lesions in theatre)
- MRI-guided (rarely, when CT/US insufficient)
Core needle biopsy of thigh soft-tissue mass. Note the planned definitive surgical incision is already marked on the skin - the biopsy needle enters exactly in line with this mark to allow en-bloc excision of the needle track.
Accuracy of CNB
- Overall diagnostic accuracy: 84-98% (multiple series)
- Determining malignant vs. benign: 97% accurate (252-patient series)
- Specific histopathologic diagnosis and grade: 81% accurate
- CT-guided CNB (Ghelman et al.): 85% histologic diagnoses from 76 specimens
- Kattapuram et al.: 92% accurate diagnoses
Advantages over Open Biopsy
- Outpatient procedure
- Lower complication rate
- Less contamination
- Cheaper
- Multiple cores can be taken through one skin puncture
Indications for CNB over Open
- Most primary bone and soft tissue tumors (first-line at specialist centers)
- Deep lesions where open biopsy would be highly morbid
- Metastatic disease confirmation
- When pre-operative chemotherapy is being considered
Type 3: Incisional (Open) Biopsy
Definition
Surgical removal of a representative portion of the tumor through a formal incision. The gold standard for tissue yield.
When to Use (Indications)
- Core needle biopsy inconclusive or non-diagnostic
- Lesions requiring large tissue volume for ancillary studies (cytogenetics, flow cytometry, molecular studies)
- Cartilaginous tumors (chondrosarcoma grade differentiation requires architectural assessment)
- Small, surgically accessible tumors in expendable locations
- When pathologist requests additional tissue after CNB
- Primary lymphoma of bone (needs large tissue for immunophenotyping)
Critical Technical Rules
1. Incision Placement
- Always longitudinal (along the axis of the limb) - NEVER transverse
- Placed within the planned definitive surgical incision
- Must allow en-bloc excision of the entire track with the tumor
2. Approach
- Through a single muscle belly (not intermuscular plane)
- Shortest route to tumor
- Avoid major NV structures
3. Bone Window
- If cortical bone must be opened: make a round or oval window - NOT rectangular or irregular
- Oval/round windows distribute stress uniformly; rectangular windows create stress risers leading to pathological fracture
- Plug the window with methylmethacrylate (PMMA bone cement) to prevent hematoma and fracture
4. Tourniquet
- If used: elevate limb gently (do NOT exsanguinate with Esmarch bandage - this squeezes tumor cells into circulation)
- Release tourniquet and achieve meticulous hemostasis before closing (contaminated hematoma = contaminated field)
5. Frozen Section
- Send specimen intraoperatively to confirm diagnostic tissue has been obtained
- If negative, take more samples before closing
6. Drain
- If used: exit in-line with the incision (not separately) so drain track can be excised with tumor
- A drain exiting separately from the wound contaminates a whole new tissue corridor
7. Wound Closure
- Close tightly in layers
- Do NOT use wide retention sutures (they contaminate a wider area)
- Apply compression dressing
8. Sample the Right Area
- Soft-tissue extension of a bone lesion: sample the leading edge (most viable tumor)
- Avoid sampling just the pseudocapsule
- Do NOT sample the center of large tumors (often necrotic)
Advantages
- Maximum tissue for diagnosis
- Allows grading, molecular studies, cytogenetics, flow cytometry
- Best for heterogeneous tumors
Disadvantages
- Higher complication rate (bleeding, infection, wound dehiscence, pathological fracture, hematoma)
- Greater contamination of tissue planes
- Longer recovery
- Should be done only in a specialist center
Type 4: Excisional Biopsy
Definition
The entire tumor is removed as the biopsy. Serves as both diagnosis and treatment in one procedure.
Indications
- Small lesions (< 3 cm) in expendable bones (fibula, rib, clavicle, iliac wing)
- Lesions strongly suspected to be benign (e.g., small enchondroma, fibrous cortical defect)
- Soft tissue lipomas that are clearly benign radiologically
- Superficial, small soft-tissue nodules unlikely to be malignant
Contraindications
- Any lesion where malignancy cannot be excluded prior to excision
- Large tumors (cannot achieve adequate margins)
- Tumors where pre-operative staging is incomplete
Risks
- If malignancy is confirmed on final pathology, the contaminated pseudocapsule margins mean the patient will need re-excision with wider margins, radiation, or in the worst case - amputation
- The "whoops" lesion: excision of what was thought to be benign, found to be malignant
Type 5: Image-Guided Percutaneous Biopsy
CT-Guided Biopsy
The current gold standard for deep or complex lesions.
Process:
- Patient positioned in CT gantry
- Scout images obtained; target lesion identified
- Needle trajectory planned: avoids NV structures, crosses minimum number of compartments, stays in planned surgical corridor
- Needle advanced under intermittent CT guidance
- Position confirmed within lesion before firing/coring
- Multiple cores obtained (2-3 minimum)
Advantages:
- Precise needle placement
- Avoids neurovascular structures
- Real-time confirmation of needle position within lesion
- Can target soft-tissue component, viable edges, or specific zones
Accuracy: 85-92% overall; highest for metastatic disease
Ultrasound-Guided Biopsy
- Used for superficial soft-tissue masses and vascular lesions
- Real-time needle visualization
- No ionizing radiation
- Cannot penetrate intact cortical bone
Fluoroscopy-Guided Biopsy
- Used for bone lesions accessible under C-arm
- Quick, good for lytic lesions
- Less precise than CT for small or deep lesions
MRI-Guided Biopsy
- Rarely used; MRI-compatible needles required
- Best tissue contrast, but expensive and time-consuming
Type 6: Trephine Biopsy (Bone Marrow Biopsy)
Specific Use
For diffuse bone marrow lesions (myeloma, lymphoma, leukemia, metastatic disease with marrow involvement), and in the posterior superior iliac spine (PSIS) for systemic marrow assessment.
Technique (Jamshidi - PSIS)
- Patient prone or lateral decubitus
- Posterior superior iliac spine identified and marked
- Local anesthetic to periosteum (most painful step)
- Small skin incision
- Jamshidi needle with stylet locked - advanced through skin and subcutaneous tissue to bone
- Rotatory clockwise-counterclockwise motion used to penetrate cortex
- Stylet removed; cannula advanced 1.5-2 cm into marrow
- Rotate 360° CW and then CCW to free the core
- Withdraw while rotating counterclockwise
- Extractor used to push out the bone core specimen
- Placed in formalin; specimen should be 1.5-2 cm long for adequate assessment
Combination with Aspirate
- Aspirate first (before biopsy needle traumatizes marrow): 0.5-2 mL aspirated for cytology, cytogenetics, flow cytometry
- Then trephine core for histology
Special Situations in Orthopedic Biopsy
Spine Tumors
- Usually CT-guided transpedicular approach
- Coaxial bone needle (Cook's needle) used
- Must plan approach to stay within planned surgical corridor
- Weinstein-Boriani-Biagini classification used to plan which zone to sample
Pelvic Tumors
- High risk area: close proximity to iliac vessels, bowel, bladder
- CT guidance essential
- Consider pre-operative embolization for hypervascular lesions (renal cell carcinoma metastases, thyroid metastases)
- Approach: lateral, not medial (to avoid bowel/bladder contamination)
Suspected Renal / Thyroid Metastases
- Pre-biopsy embolization reduces bleeding risk significantly
- CT-guided core needle is preferred
- Do NOT perform open biopsy without embolization
Infection vs. Tumor (Cannot Differentiate Clinically)
- Rule: Culture what you biopsy and biopsy what you culture
- Always send tissue for both microbiology AND histology
- Acid-fast bacilli (AFB) culture and sensitivity for suspected tuberculosis (6-8 week incubation period required)
Complications of Biopsy
| Complication | Needle Biopsy | Open Biopsy | Notes |
|---|
| Hematoma | Less common | 8-15% | Greatest risk with open biopsy |
| Infection | < 1% | 2-5% | Higher with immunosuppressed patients |
| Pathological fracture | Rare | Occasional | Round/oval window reduces this risk |
| Tumor seeding / track contamination | Present (must plan accordingly) | Higher volume contamination | Track MUST be excised en bloc |
| Non-diagnostic specimen | 2-16% | 5-10% | Frozen section reduces this |
| Wound dehiscence | N/A | Occasional | Especially post-radiotherapy |
| Unnecessary amputation | Rare | Up to 3% (Mankin) | If track not planned correctly |
Local recurrence from biopsy track seeding:
- Local recurrence rate after open biopsy increases 5-fold (from 7% to 38%) if the scar is not removed at definitive resection
- 5-year survival after local recurrence of osteosarcoma: 29%; Ewing sarcoma: only 14%
Specimen Handling
- Never crush the specimen with forceps - use gentle technique
- Fresh tissue for: cytogenetics, molecular studies, flow cytometry (kept on ice, not formalin)
- Formalin-fixed (10% buffered formalin): for routine histology and immunohistochemistry
- Additional aliquot in glutaraldehyde for electron microscopy if needed
- Label with: patient name, site, surgeon, date, orientation markers if relevant
- Send with clinical/imaging summary for the pathologist
- Frozen section intraoperatively: confirms representative tumor tissue obtained before closing
Choosing the Right Biopsy Method
Suspected Lesion
    |
    ├── Clearly benign, small (< 3 cm), expendable bone?
    |       → EXCISIONAL BIOPSY
    |
    ├── Metastatic disease highly suspected?
    |       → FNAC (fast, cheap) ± CNB
    |
    ├── Primary bone tumor (any size)?
    |       → CORE NEEDLE BIOPSY (CT-guided preferred)
    |       → Open INCISIONAL biopsy if CNB non-diagnostic
    |
    ├── Soft tissue mass, intermediate/large?
    |       → CORE NEEDLE BIOPSY (US or CT-guided)
    |       → Open INCISIONAL biopsy if CNB inconclusive
    |
    ├── Diffuse marrow disease (myeloma, lymphoma)?
    |       → TREPHINE BIOPSY (PSIS) + aspirate
    |
    └── Deep/inaccessible lesion?
            → CT-GUIDED core needle biopsy
Summary Comparison
| Feature | FNAC | Core Needle | Incisional Open | Excisional | Trephine |
|---|
| Tissue type | Cells | Core | Block | Whole tumor | Bone core |
| Anesthesia | LA | LA | LA/GA | LA/GA | LA |
| Setting | Outpatient | Outpatient | OT/Day surgery | OT | Outpatient |
| Accuracy | ~90% benign/malignant | 84-98% | 95-100% | 100% | High for marrow |
| Architecture preserved | No | Yes | Yes | Yes | Yes |
| Complication rate | Very low | Low | Moderate-high | High | Low |
| Contamination risk | Very low | Low (plan track) | Moderate | High | Low |
| Tissue for ancillary tests | Limited | Usually adequate | Excellent | Excellent | Adequate |
| Best for | Metastases, infection | Primary bone/ST tumors | Complex tumors | Small benign | Marrow disease |
Key Teaching Points (Mnemonics)
"LONE" rule for incision:
- Longitudinal only (never transverse)
- One compartment (single muscle belly)
- Not near neurovascular bundles
- En-bloc excision planned for track
"ROAD" for bone window:
- Round or Oval defect only
- Avoid rectangular/irregular shapes
- Defect plugged (with methylmethacrylate)
Sources:
- Campbell's Operative Orthopaedics, 15th ed. (2026), Chapter 26, pp. 1091-1092 - Biopsy section
- Mankin HJ et al., "The hazards of biopsy, revisited." J Bone Joint Surg (1996)
- Agarwal M et al., "Biopsy for Musculoskeletal Tumors - An Orthopaedic Surgeon's Guide." J Clin Orthop (2016)
- Anatomically Based Guidelines for Core Needle Biopsy of Bone Tumors (Radiographics, 2007)
- Biopsy of bone tumors: a literature review, PMC 11164262 (2024)Here is the complete, detailed guide on biopsy techniques in orthopedics:
Biopsy Techniques in Orthopedics
Introduction and Why It Matters
Biopsy is the ultimate diagnostic tool for musculoskeletal neoplasms - it provides tissue for histopathological confirmation of diagnosis, grading, and ancillary studies. However, it carries unique risks in orthopedic oncology: a poorly planned biopsy can contaminate tissue planes, compromise limb salvage surgery, cause pathological fracture, or directly lead to unnecessary amputation.
The landmark studies by Mankin et al. (1982 and 1996, 597 patients) found:
- Major diagnostic errors in 13.5% of patients
- Complication rate of 15.9%
- Unnecessary amputations in 3%
- Problems 2-12x more frequent when biopsy was performed at non-specialist centers
"Errors in diagnosis, nonrepresentative or technically poor biopsy specimens, and wound complications have been found to occur more frequently when the biopsy was done by a surgeon at a referring institution rather than by an orthopaedic oncologist." - Campbell's Operative Orthopaedics, 15th ed. (2026)
Pre-Biopsy Planning (Mandatory Steps)
Complete ALL of the following BEFORE performing a biopsy:
| Step | What to Do |
|---|
| Clinical | Full history, physical exam, define compartment, assess NV status |
| Labs | CBC, ESR, CRP, LFT, calcium, phosphate, LDH, alkaline phosphatase, PSA (males), serum protein electrophoresis |
| Plain X-ray | AP + lateral of entire bone involved (check for skip lesions) |
| MRI | Entire compartment (most important for surgical planning) |
| CT chest/abdomen/pelvis | Staging for suspected malignancy |
| Bone scan (Tc-99m) | Skip lesions, polyostotic disease, metastases |
| PET-CT | Where available, for high-grade lesions |
The pathologist needs correlative imaging to make an accurate diagnosis. A biopsy without imaging context is far less valuable.
The 10 Golden Rules of Orthopedic Biopsy (Mankin's Principles)
- Refer before you biopsy - if primary malignancy is suspected, send to a musculoskeletal oncologist first
- The biopsy track is contaminated - treat both needle and open incision tracks as permanently seeded with tumor cells
- The track must be excised en bloc with the tumor at definitive surgery
- Incision placement is critical - must lie within the planned limb salvage incision
- Longitudinal incisions only - transverse incisions on limbs are absolutely forbidden
- Single compartment approach - never violate intermuscular planes
- Avoid major neurovascular structures at all costs
- Meticulous hemostasis - hematoma dissects tumor cells through tissue planes
- Plugging of bone windows with methylmethacrylate cement to prevent fracture and hematoma
- The biopsy surgeon = the definitive surgeon (or must communicate in intimate detail)
Classification of Biopsy Techniques
Orthopedic biopsies are broadly divided into:
BIOPSY TECHNIQUES
│
├── PERCUTANEOUS (Minimally Invasive)
│   ├── Fine-Needle Aspiration Cytology (FNAC)
│   ├── Core Needle Biopsy (Tru-Cut / Jamshidi)
│   └── Image-Guided (CT / Ultrasound / Fluoroscopy)
│
└── OPEN (Surgical)
    ├── Incisional Biopsy (Gold standard tissue yield)
    └── Excisional Biopsy (Diagnosis + treatment together)
And the specialized:
- Trephine Biopsy (bone marrow)
Type 1: Fine-Needle Aspiration Cytology (FNAC)
Principle
A thin hollow needle (22-25 gauge) is inserted into the lesion to aspirate loose cells for cytological smear examination. Provides cytology only - no tissue architecture.
Indications
- Strongly suspected metastatic bone disease (95% accuracy)
- Suspected osteomyelitis / infection (for culture + sensitivity)
- Lymph node assessment
- Known primary tumor: rapid confirmation of recurrence
- Lesions very close to neurovascular bundles (thin needle = minimal contamination)
Technique
- Clean skin with antiseptic
- Local anesthetic to skin and subcutaneous tissue (do not over-inject - extends contamination zone)
- 22-25G needle on a 20 mL syringe introduced directly into tumor
- Strong suction applied while making 3-4 passes through tumor in different directions
- Release suction before withdrawing needle (prevents aspirate going back into syringe)
- Material expressed onto glass slides, smeared, and fixed immediately
- Staining: Giemsa, Papanicolaou (Pap), or Diff-Quik
Accuracy
- Distinguishing malignant vs. benign: ~90%
- Specific tumor type identification: 60-70% (limited without architecture)
- Metastatic disease: ~95% (most accurate application)
Advantages
- Outpatient, no incision
- Essentially zero track-seeding risk (< 1 mm needle)
- Rapid results (same day)
- Very low complication rate
- Cheap
Disadvantages
- No tissue architecture (cannot grade primary tumors)
- Cannot perform immunohistochemistry, cytogenetics, or flow cytometry reliably
- Requires a specialist cytopathologist
- Not adequate for primary bone sarcomas as the sole biopsy
Type 2: Core Needle Biopsy (CNB)
Core needle biopsy is the preferred first-line technique for most musculoskeletal tumors at specialist centers. It provides actual tissue cores, preserving histological architecture.
Needles Used
For soft tissue: Tru-Cut (Biopsy gun)
Principle of Tru-Cut Biopsy: (1) Sheath and inner needle with specimen slot positioned at lesion margin. (2) Inner needle pushed into lesion - tumor enters the slot. (3) Outer sheath slides forward over the inner needle, cutting the tissue core. (4) Entire assembly withdrawn with specimen trapped.
- A spring-loaded gun mechanism reduces crushing artifact and patient discomfort
- Disposable guns available commercially
- Needle size: typically 14-18 gauge
For bone: Jamshidi needle / Trephine
Bone biopsy trephines: (a) Jamshidi single-bevel needle - most widely used, (b) Triple-bevel crown needle - better for hard sclerotic bone, (c) Ayka single-bevel needle. All consist of cannula + stylet; stylet is removed after cortex penetration to collect the core.
Technique - Soft Tissue (Tru-Cut Gun)
- Plan needle trajectory to be within planned surgical incision corridor
- Minimal local anesthetic (over-infiltration widens contamination zone)
- Small stab skin incision with No.11 blade
- Spring-loaded biopsy gun introduced until tip at tumor margin
- Safety released, gun fired: inner needle advances into tumor, sheath cuts core
- Entire assembly withdrawn; core removed from slot and placed in formalin
- Repeat 2-3 times through the same skin puncture at slightly different angles
- One core kept fresh (unfixed) for cytogenetics/molecular studies
Technique - Bone (Jamshidi)
- Stab incision in line with planned surgical incision
- Jamshidi needle (with inner trocar locked) directed to bone cortex
- Rotatory drilling motion (clockwise + counterclockwise alternating) to penetrate outer cortex
- Feel for loss of resistance when marrow cavity entered
- Inner trocar removed; cannula advanced further into tumor
- Rotate cannula to core out tissue
- Withdraw while rotating; use stylet/extractor to push specimen out from tip end
- Plug cortical hole with bone wax or PMMA cement
- Take 2-3 cores
Image Guidance
| Modality | Best Used For | Advantage |
|---|
| CT-guided | Deep lesions, spine, pelvis, chest wall | Most precise, avoids NV structures, confirms needle position |
| Ultrasound-guided | Superficial soft-tissue masses, solid cystic differentiation | Real-time, no radiation, cheap |
| Fluoroscopy (C-arm) | Lytic bone lesions in accessible areas | Quick, available in OT |
| MRI-guided | Rarely; when CT/US insufficient | Best tissue contrast; expensive, needs compatible needles |
Accuracy of CNB
- Overall diagnostic accuracy: 84-98% across multiple studies
- Malignant vs. benign determination: 97% (series of 252 patients)
- Specific diagnosis and grade: 81%
- CT-guided series (Ghelman): 85% histologic diagnoses
- CT-guided series (Kattapuram et al.): 92% accurate diagnoses
- Metastatic disease: 95% (most accurate)
- Benign primary tumors: ~82% (least accurate - may need open biopsy)
Advantages over Open Biopsy
- Outpatient procedure (no general anesthesia needed)
- Lower complication rate
- Preserves tissue architecture (unlike FNAC)
- Multiple cores from single skin puncture
- Smaller contamination zone
- Faster recovery
When CNB Should Be Escalated to Open Biopsy
- Non-diagnostic CNB (repeat CNB first; if still non-diagnostic - open biopsy)
- Cartilaginous lesions (grading chondrosarcoma requires architecture and cellularity assessment over large area)
- Primary lymphoma of bone (needs ample tissue for immunophenotyping)
- When ancillary studies require more tissue than cores provide
Type 3: Incisional (Open) Biopsy
Definition
Surgical removal of a representative sample of the lesion through a formal incision. The gold standard for tissue quantity and quality.
Indications
- CNB non-diagnostic or inconclusive
- Large primary bone tumors needing grading
- Cartilaginous tumors (chondrosarcoma grading)
- Lymphoma of bone
- Complex tumors requiring cytogenetics, flow cytometry, molecular studies
- Surgeons performing definitive surgery at the same center
Technique - Step by Step
Incision:
- Always longitudinal along the limb axis
- Centered over the most accessible/prominent part of the tumor
- Shortest path to tumor
- Must be placeable within the definitive surgical incision
Deep dissection:
- Through a single muscle belly (e.g., through vastus lateralis, not between vastus and rectus)
- Never through intermuscular planes (these connect to multiple compartments - wide contamination)
- Avoid neurovascular bundles
Sampling the tumor:
- Sample the leading edge (soft-tissue extension) - most viable, most representative
- Avoid the center of large tumors (necrotic, non-diagnostic)
- Avoid sampling just the pseudocapsule
- Take 2-3 pieces of representative tissue
Bone window (if required):
- Create a round or oval defect - NOT rectangular, not irregular
- Round/oval windows distribute mechanical stress uniformly, preventing pathologic fracture
- Rectangular windows create stress risers at corners
- Plug with methylmethacrylate (PMMA) after sampling to prevent hematoma and reduce fracture risk
Frozen section:
- Send tissue to pathologist intraoperatively
- Confirms: "Is this diagnostic tumor tissue?"
- If negative: take more tissue before closing
Hemostasis and closure:
- Release tourniquet and achieve perfect hemostasis before closing (contaminated hematoma dissects tumor cells everywhere)
- Close tightly in layers
- No wide retention/tension sutures
- If drain needed: exit in line with the wound (NOT through a separate stab far from the incision)
What NOT to Do
Campbell's Fig. 26.8 - Errors to avoid: (A,B) Irregular oval bone defects causing pathological fracture. (C) Transverse incision - absolutely forbidden. (D) Needle track through patellar tendon. (E) Posterior needle track impossible to resect. (F) Multiple needle tracks contaminating quadriceps. (G) Drain placed separately from incision, creating a second contaminated corridor.
Type 4: Excisional Biopsy
Definition
The entire tumor is removed at biopsy - simultaneously serves as diagnosis and treatment.
Indications
- Small lesions (< 3 cm) in expendable bones: fibula head, rib, small bones of hand/foot, clavicle, iliac crest
- Lesions where imaging very strongly suggests benign (osteoid osteoma, fibrous cortical defect, small enchondroma)
- Small superficial soft-tissue masses radiologically consistent with lipoma
Risks and "Whoops" Lesion
The greatest risk: if the excised specimen returns as malignant, the surgeon has:
- No pre-operative staging (compromised)
- A contaminated pseudocapsule (margins likely inadequate)
- Need for re-excision with much wider margins, possible radiation, or amputation
This is called the "whoops" (unplanned) excision - one of the most avoidable catastrophes in orthopedic oncology.
Rule: Never excise a lesion when malignancy cannot be confidently excluded by imaging + clinical features.
Type 5: Trephine Biopsy (Bone Marrow Biopsy)
Specific Application
Assessment of diffuse bone marrow pathology: multiple myeloma, lymphoma, leukemia, aplastic anemia, metastatic disease with marrow infiltration.
Site: Posterior Superior Iliac Spine (PSIS)
Technique - Jamshidi at PSIS
- Patient prone or lateral decubitus
- PSIS identified and marked (most accessible, greatest marrow volume)
- Local anesthetic - skin, subcutaneous, and periosteum (most painful; wait 2-3 minutes)
- Small skin incision with No. 11 blade
- Jamshidi needle with stylet locked - advanced to bone, then rotated through cortex
- Once cortex penetrated (sudden loss of resistance): advance 1-2 cm into marrow
- Rotate 360° CW then CCW to sever specimen from surrounding marrow
- Withdraw slowly while rotating counterclockwise
- Extractor rod inserted through the top to push specimen out distally (not proximally - avoids crushing)
- Specimen should be 1.5-2.5 cm long for adequate assessment
Aspirate + Trephine Together
- Aspirate first (before trephine traumatizes marrow architecture): 0.5-2 mL into EDTA tubes
- Aspirate for: morphology, flow cytometry, cytogenetics (karyotype/FISH), molecular studies
- Trephine after: for histology, IHC, gene rearrangement studies on fixed tissue
Specimen Handling - Universal Rules
| Specimen Type | Container | Used For |
|---|
| Fixed in 10% neutral buffered formalin | Histology jar | Routine H&E, immunohistochemistry (IHC) |
| Fresh / unfixed (on ice) | Sterile container, kept cold | Cytogenetics, FISH, flow cytometry, molecular studies |
| In glutaraldehyde | Electron microscopy tube | Ultrastructural analysis (rarely needed) |
| Swab / fresh tissue in saline | Microbiology | Culture: aerobic, anaerobic, AFB, fungal |
- Always send with clinical and imaging summary for the pathologist
- Label clearly: patient ID, site, orientation if relevant
- Do not crush with forceps - use atraumatic handling
Complications
| Complication | Needle | Open | Key Prevention |
|---|
| Hematoma | Rare | 8-15% | Tourniquet release + hemostasis before closure |
| Infection | < 1% | 2-5% | Sterile technique, prophylactic antibiotics |
| Pathological fracture | Rare | Occasional | Round/oval window + PMMA plugging |
| Tumor seeding/contamination | Low (plan track) | Moderate | Longitudinal incision, single compartment |
| Wound dehiscence | N/A | Occasional | Tight layered closure, compression dressing |
| Non-representative specimen | 2-16% | 5-10% | Frozen section confirmation intraoperatively |
| Unnecessary amputation | Rare | Up to 3% | Referral to specialist center first |
Critical seeding statistic: Local recurrence rate after sarcoma surgery increases 5-fold (7% to 38%) if the biopsy scar is not resected en bloc with the tumor. 5-year survival after local recurrence: osteosarcoma 29%, Ewing sarcoma only 14%.
Summary Table
| Feature | FNAC | Core Needle | Incisional Open | Excisional | Trephine |
|---|
| Tissue obtained | Cells only | Tissue cores | Block of tumor | Entire tumor | Bone core |
| Architecture preserved | No | Yes | Yes | Yes | Yes |
| Anesthesia | LA | LA | LA/GA | LA/GA | LA |
| Setting | Outpatient | Outpatient | Day surgery/OT | OT | Outpatient |
| Accuracy | 90% (B/M), 60-70% (type) | 84-98% | 95-100% | 100% | High for marrow |
| Complication rate | Very low | Low | Moderate-high | High | Low |
| Contamination risk | Near zero | Low (plan track) | Moderate | High if malignant | Low |
| Ancillary studies | Limited | Usually sufficient | Excellent | Excellent | Adequate |
| Best for | Metastases, infection | Primary tumors (first-line) | Complex, inconclusive CNB | Small benign lesions | Marrow disease |
Key Mnemonics
"LONE" rule for incision placement:
- Longitudinal only
- One compartment (single muscle)
- Not near neurovascular structures
- En-bloc excision planned for entire track
"ROAD" for bone window:
- Round or Oval defect only (never rectangular)
- Avoid stress risers
- Defect plugged with PMMA immediately
Sources:
- Campbell's Operative Orthopaedics, 15th ed. (2026), Chapter 26, pp. 1091-1092
- Mankin HJ et al. "The hazards of the biopsy, revisited." J Bone Joint Surg Am. 1996;78(5):656-663
- Agarwal M et al. "Biopsy for Musculoskeletal Tumors." J Clin Orthop. 2016
- Anatomically Based Guidelines for Core Needle Biopsy of Bone Tumors. Radiographics 2007;27(1)
- Biopsy of bone tumors: a literature review. PMC 11164262 (2024)