
Explain the energetics of oxidative phosphorylation
oxidative phosphorylation electron transport chain ATP synthesis diagram
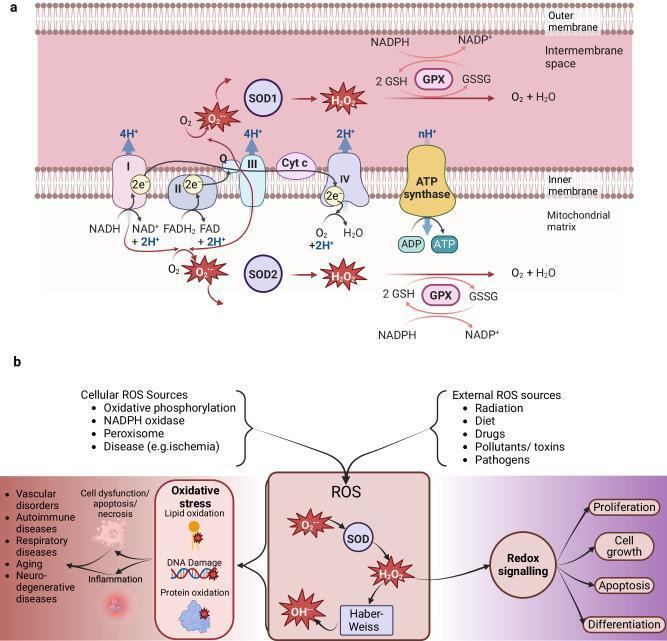
A two-part medical illustration depicting mitochondrial oxidative phosphorylation and the broader landscape of reactive oxygen species (ROS) biology. Section (a) shows the electron transport chain (ETC) within the inner mitochondrial membrane, detailing complexes I-IV, ubiquinone (Q), and cytochrome c. It illustrates electron flow from NADH/FADH2 leading to proton pumping into the intermembrane space and ATP synthesis via ATP synthase. The diagram highlights 'leaky' electrons from complexes I and III reacting with O2 to form superoxide (O2•-), which is subsequently neutralized by superoxide dismutase (SOD) and glutathione peroxidase (GPX). Section (b) outlines cellular and external ROS sources, including NADPH oxidase, peroxisomes, radiation, and pathogens. It demonstrates the dual nature of ROS: contributing to pathological oxidative stress (DNA damage, lipid oxidation, protein oxidation) leading to diseases like vascular disorders and neurodegeneration, while simultaneously acting as essential mediators in physiological redox signaling for cell growth, proliferation, apoptosis, and differentiation.
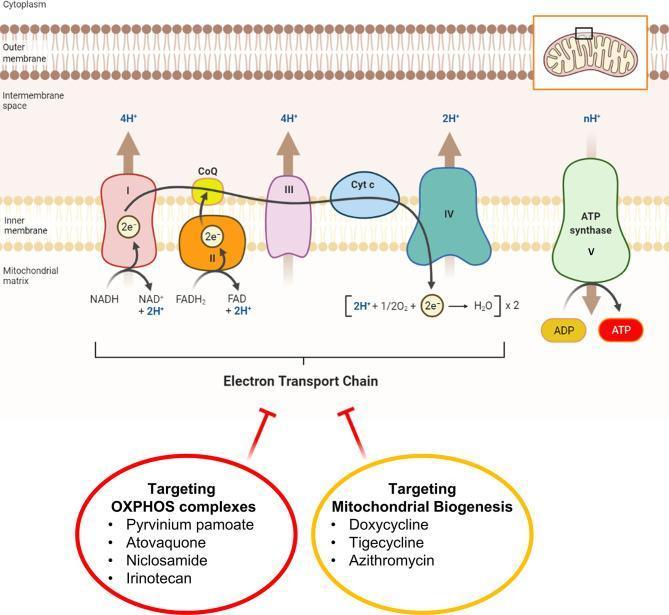
A pathophysiology diagram illustrating the mitochondrial oxidative phosphorylation (OXPHOS) system and its therapeutic inhibitors. The top schematic shows the inner mitochondrial membrane containing the Electron Transport Chain (ETC) complexes I through IV, Coenzyme Q (CoQ), and Cytochrome c (Cyt c), alongside ATP synthase (Complex V). It depicts the flow of electrons (2e-) from NADH and FADH2, the pumping of protons (H+) into the intermembrane space, and the final reduction of oxygen to water. Complex V is shown utilizing the proton gradient to convert ADP to ATP. The lower section identifies two pharmacological strategies for ATP depletion in cancer cells: 'Targeting OXPHOS complexes' using drugs like Pyrvinium pamoate, Atovaquone, Niclosamide, and Irinotecan; and 'Targeting Mitochondrial Biogenesis' using antibiotics such as Doxycycline, Tigecycline, and Azithromycin. Inhibitory arrows indicate these drugs disrupt mitochondrial function to target cancer stem cells (CSCs).
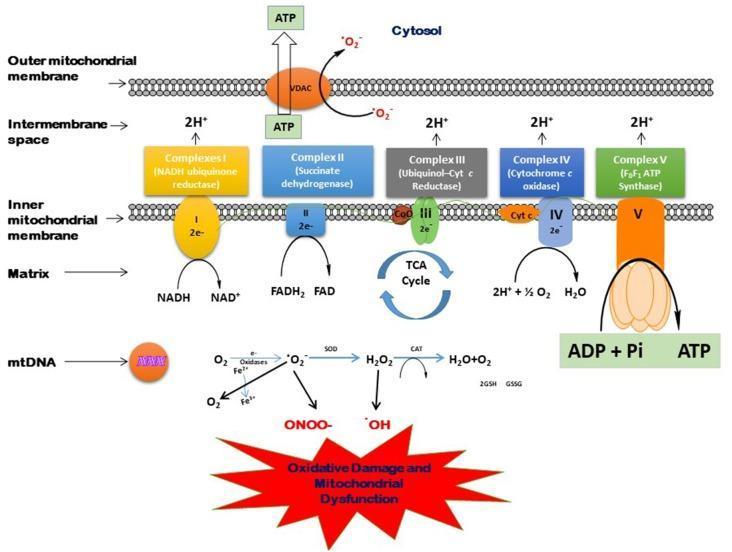
This pathophysiology diagram illustrates mitochondrial bioenergetics, specifically the electron transport chain (ETC), ATP synthesis, and the generation of reactive oxygen/nitrogen species (ROS/RNS). The upper portion details the inner mitochondrial membrane containing Complexes I through V. Complex I (NADH ubiquinone reductase) and Complex II (Succinate dehydrogenase) receive electrons from NADH and FADH2, respectively. Electrons flow through ubiquinone (CoQ) and cytochrome c (Cyt c) to Complex IV (Cytochrome c oxidase), which reduces O2 to H2O. Complexes I, III, and IV pump protons (H+) into the intermembrane space, creating a gradient that drives Complex V (F0F1 ATP Synthase) to convert ADP + Pi into ATP. ATP then exits to the cytosol via the VDAC channel. The lower section depicts oxidative stress pathways: O2 is converted to superoxide (•O2-) by oxidases or mitochondrial leakage. Superoxide is neutralized by Superoxide Dismutase (SOD) into H2O2, which Catalase (CAT) or the GSH/GSSG cycle converts to water. Alternatively, superoxide reacts with NO to form peroxynitrite (ONOO-) or leads to hydroxyl radicals (•OH), resulting in oxidative damage, mtDNA mutations, and mitochondrial dysfunction.
Energetics of Oxidative Phosphorylation
1. Thermodynamic Foundation
Free Energy (DeltaG)
DeltaG = DeltaH - T*DeltaS
- A negative DeltaG means the reaction is exergonic (spontaneous; energy is released).
- A positive DeltaG means the reaction is endergonic (energy must be supplied).
- DeltaG = 0 means the system is at equilibrium.
DeltaG = DeltaG° + RT ln([Products]/[Reactants])
Reduction Potentials and DeltaG
DeltaG°' = -n * F * DeltaE°'
- n = number of electrons transferred
- F = Faraday's constant (23.06 kcal/V·mol or 96,485 J/V·mol)
- DeltaE°' = difference in standard reduction potentials
2. The Electron Transport Chain (ETC)
Electron Carriers and Their Order
| Carrier | Accepts/Donates | Location |
|---|---|---|
| NADH | 2e- (hydride) | Matrix |
| FMN (in Complex I) | 2e- | Membrane |
| Fe-S centers | 1e- at a time | Membrane |
| Coenzyme Q (CoQ/Ubiquinone) | 1 or 2 e- | Membrane lipid |
| Cytochrome b, c1 (Complex III) | 1e- via Fe2+/Fe3+ | Membrane |
| Cytochrome c | 1e- | Intermembrane space |
| Cytochromes a, a3 (Complex IV) | 1e- + Cu | Membrane |
| O2 | Final acceptor (4e- → 2 H2O) | Matrix |
Proton Pumping at Each Complex
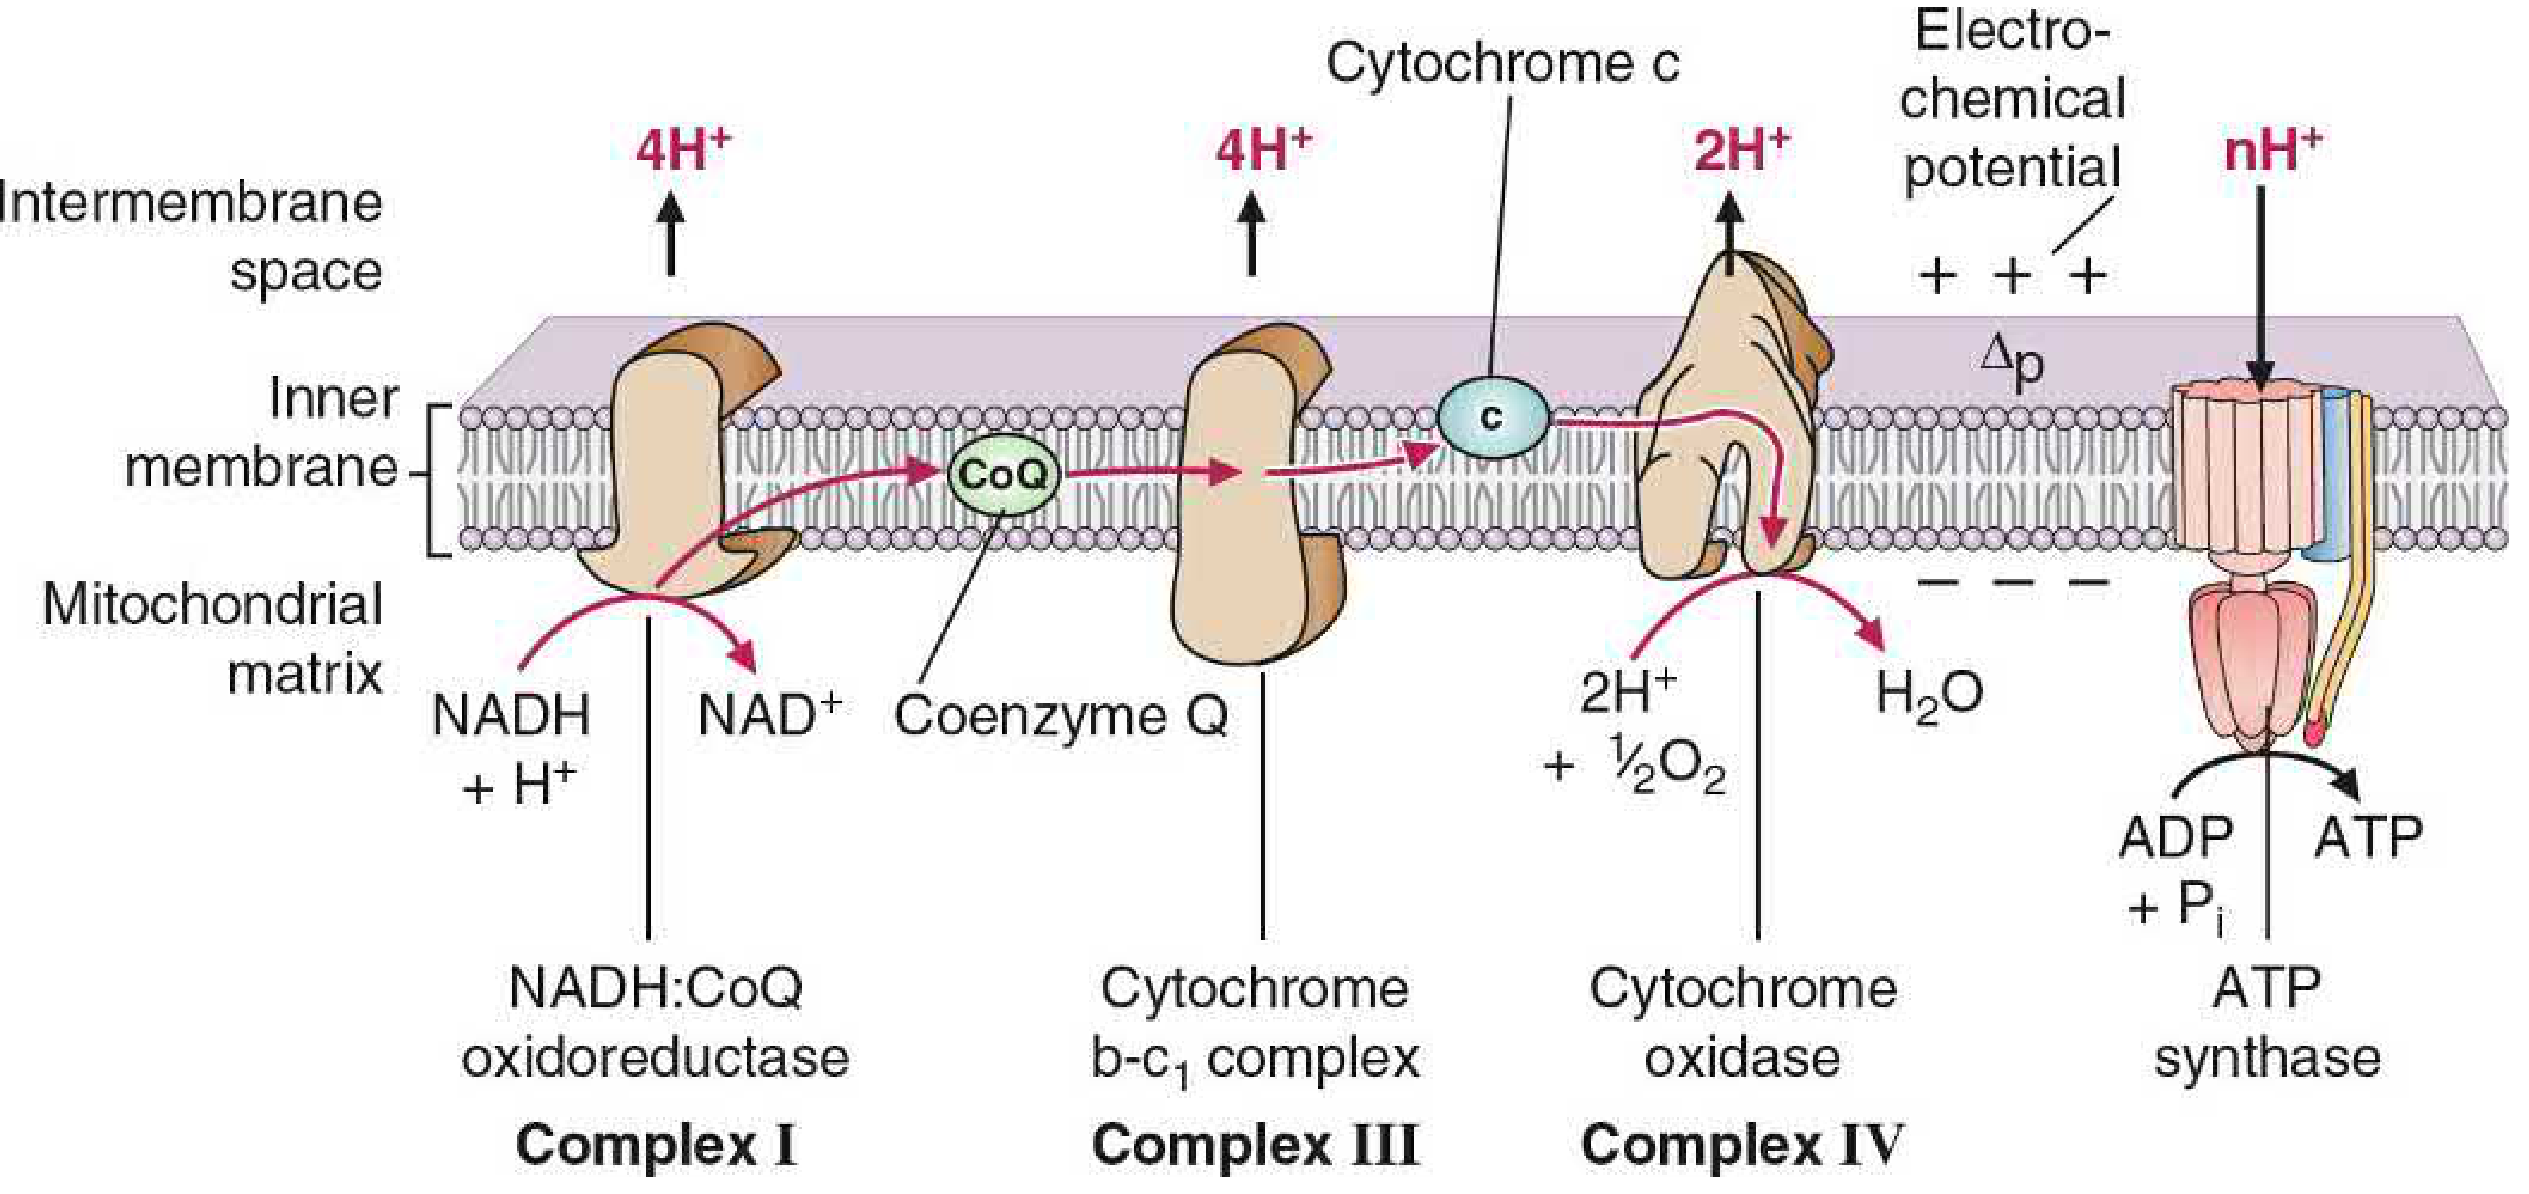
- Complex I: pumps 4 H+ per 2 electrons from NADH to CoQ
- Complex III: pumps 4 H+ per 2 electrons from CoQH2 to cytochrome c (via the Q-cycle)
- Complex IV: pumps 2 H+ per 2 electrons from cytochrome c to O2
3. The Proton Motive Force (Dp)
- Membrane potential (DeltaPsi): the electrical component, with the matrix side negatively charged (roughly -180 mV)
- pH gradient (DeltapH): the chemical component, with the matrix more alkaline than the intermembrane space
4. ATP Synthase (Complex V)
- F0 (membrane subunit): contains the proton channel/pore spanning the inner membrane
- F1 (matrix headpiece): contains the catalytic sites that synthesize ATP from ADP + Pi
- Open (O) - binds ADP and Pi loosely
- Loose (L) - ADP + Pi bound but not yet converted
- Tight (T) - conformational change synthesizes and traps ATP
5. ATP Yield
| Electron donor | H+ pumped | ATP yield |
|---|---|---|
| NADH | 10 H+ | ~2.5 ATP |
| FADH2 (via Complex II) | 6 H+ | ~1.5 ATP |
- 10 NADH x 2.5 = 25 ATP
- 2 FADH2 x 1.5 = 3 ATP
- 4 ATP from substrate-level phosphorylation
- Total: ~30-32 ATP per glucose (net)
6. Coupling and Regulation
- When cellular energy demand rises, ADP accumulates. This drives proton flux through ATP synthase, which collapses the gradient slightly, which in turn accelerates electron transport to restore Dp. This is known as respiratory control.
- Conversely, when ATP is abundant and ADP is low, the gradient builds up, slowing electron transport.
Uncoupling
Chemical Inhibitors
| Inhibitor | Target | Effect |
|---|---|---|
| Rotenone, amytal | Complex I | Block NADH oxidation |
| Antimycin A | Complex III | Block electron flow to cytochrome c |
| Cyanide, CO | Complex IV | Prevent O2 reduction |
| Oligomycin | F0 of ATP synthase | Block proton channel |
| Atractyloside | ANT translocase | Block ADP/ATP exchange |
| DNP | Inner membrane | Proton uncoupler |
7. Clinical Relevance
- OXPHOS diseases (mitochondrial myopathies): mutations in mtDNA or nuclear DNA encoding ETC subunits reduce ATP capacity. Symptoms include myopathy, encephalopathy, and lactic acidosis (Kearns-Sayre syndrome, MELAS, MERRF).
- Ischemia/reperfusion injury: lack of O2 halts electron flow and ATP production. When O2 returns, the sudden burst of electron transport generates reactive oxygen species (ROS).
- Doxorubicin cardiotoxicity: the anthracycline binds cardiolipin in the inner mitochondrial membrane, inhibits Complex IV and ATP synthase, and generates free radicals, leading to mitochondrial damage and cardiomyopathy.
- Cyanide poisoning: cyanide binds tightly to cytochrome c oxidase (Complex IV), preventing O2 reduction and halting the entire chain. All tissues (especially CNS and heart) become acutely ATP-depleted.
Summary
| Step | Energy Currency |
|---|---|
| Fuel oxidation (glycolysis, TCA) | NADH, FADH2 produced |
| ETC electron flow | Proton gradient (Dp) built |
| ATP synthase | Dp converted to ATP |
- Basic Medical Biochemistry: A Clinical Approach, 6th ed., Chapter 24 (Oxidative Phosphorylation and Mitochondrial Function)
- Biochemistry, 8th ed. - Lippincott Illustrated Reviews, Chapter 6 (Bioenergetics and Oxidative Phosphorylation)