
/generatehandwrittenimages Describe the mechanism of mechanotransduction in auditory hair cells of organ of corti . Describe the significance of endocochlear potentials for md physiology 10 marks theory question. You can make many images and not just one for completing the answer
hair cell mechanotransduction stereocilia tip links organ of corti
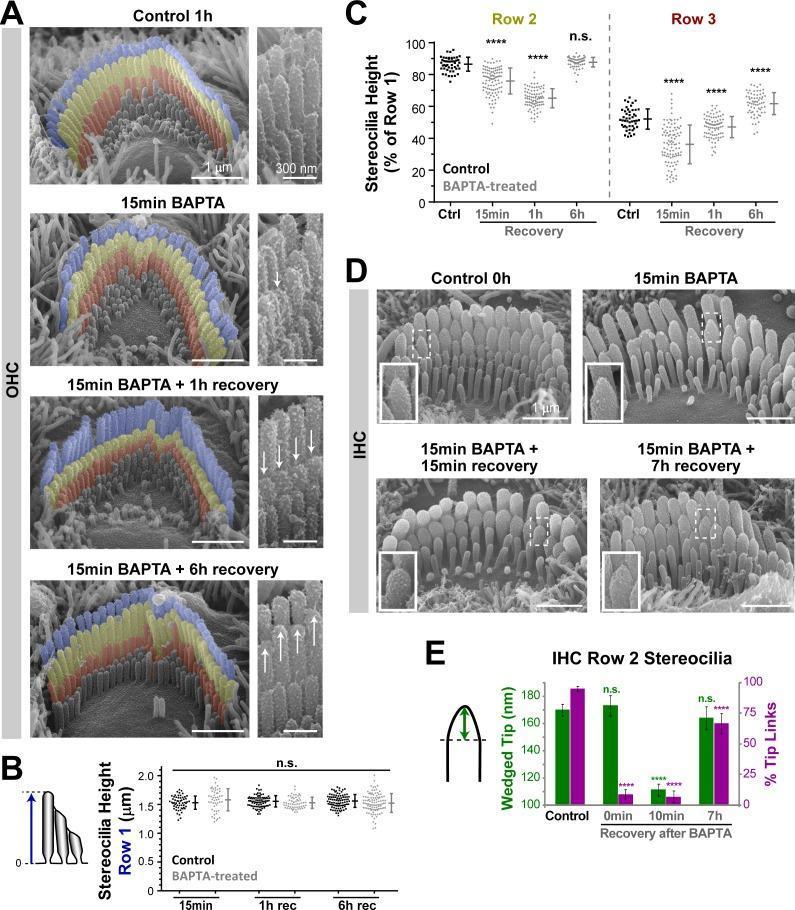
This composite educational graphic features scanning electron microscopy (SEM) images and corresponding quantitative plots illustrating the structural remodeling of hair cell stereocilia in the mouse organ of Corti. Panel A displays false-colored SEM images of outer hair cell (OHC) bundles across four states: control, immediately following BAPTA treatment (disrupting tip links), and during 1-hour and 6-hour recovery periods. The images demonstrate selective shortening of the shorter stereocilia rows (Row 2 and Row 3) after BAPTA exposure, followed by regrowth during recovery, while the tallest row (Row 1) remains stable. High-magnification insets use arrows to highlight these morphological changes. Panels B and C provide dot plots quantifying absolute heights of Row 1 and relative heights of Rows 2 and 3, statistically confirming that shortening is limited to transducing rows. Panels D and E show inner hair cell (IHC) bundles, highlighting the transformation of stereocilia tips from a 'wedged' morphology to a rounded shape following BAPTA treatment, with eventual restoration of the wedge shape upon tip link regeneration. These findings illustrate the role of mechanotransduction (MET) current and calcium signaling in maintaining hair bundle architecture.
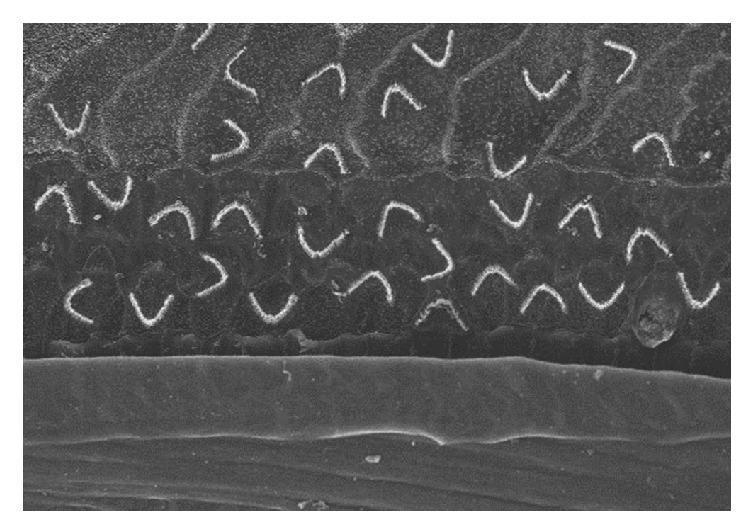
High-magnification scanning electron micrograph (SEM) showing a surface view of hair cell stereocilia bundles within the mammalian organ of Corti. The image illustrates a state of marked architectural disorganization, where numerous V-shaped stereocilia bundles appear randomly oriented and irregularly spaced across the reticular lamina. This pathological or experimental arrangement contrasts with the highly ordered, uniform rows (typically one row of inner hair cells and three rows of outer hair cells) seen in healthy cochlear tissue. The disorganized bundles are situated over regions that would typically be occupied by supporting cells, suggesting incomplete integration or ectopic differentiation following stem-cell-based regenerative therapy. The underlying cellular surface appears relatively smooth with poorly defined cell boundaries. This visual demonstrates key challenges in sensory hair cell regeneration, specifically the difficulty in achieving precise planar cell polarity and anatomical alignment required for functional mechanotransduction.
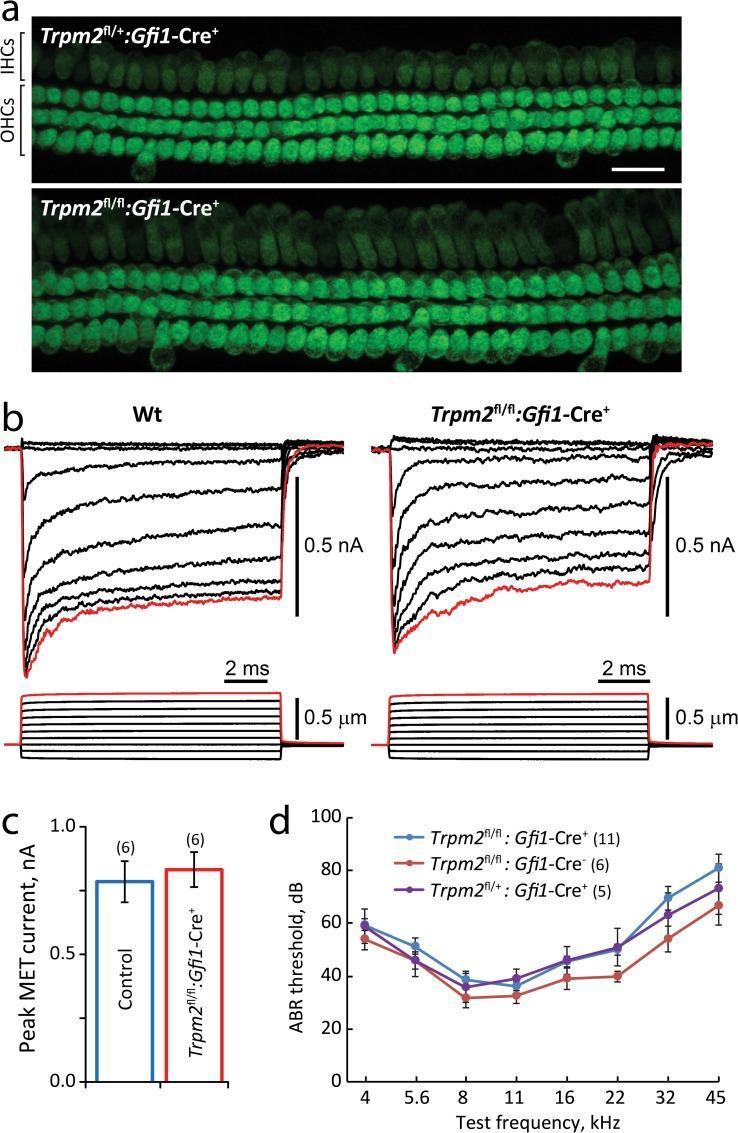
This composite figure illustrates the physiological analysis of the Trpm2 ion channel in auditory hair cell mechanotransduction. Panel (a) presents fluorescence microscopy images of inner hair cells (IHCs) and outer hair cells (OHCs) from the organ of Corti. Both control (Trpm2fl/+:Gfi1-Cre+) and Trpm2-deleted (Trpm2fl/fl:Gfi1-Cre+) mice exhibit robust FM1-43 dye accumulation, indicating intact mechanotransduction pore activity. Panel (b) shows whole-cell patch-clamp recordings of OHC transduction currents in response to graded stereocilia bundle deflections (0.5 µm). The electrophysiological traces reveal high-amplitude, rapidly adapting currents in both wild-type and Trpm2-deleted mice, with similar kinetics. Panel (c) provides a bar graph comparing average peak mechanotransduction (MET) currents, showing no significant difference between control and mutant groups. Panel (d) displays Auditory Brainstem Response (ABR) thresholds across a frequency range (4 to 45 kHz), demonstrating that Trpm2-deleted mice maintain normal hearing thresholds. Collectively, the visual evidence demonstrates that the Trpm2 channel is not essential for primary mechanotransduction or peripheral auditory function.
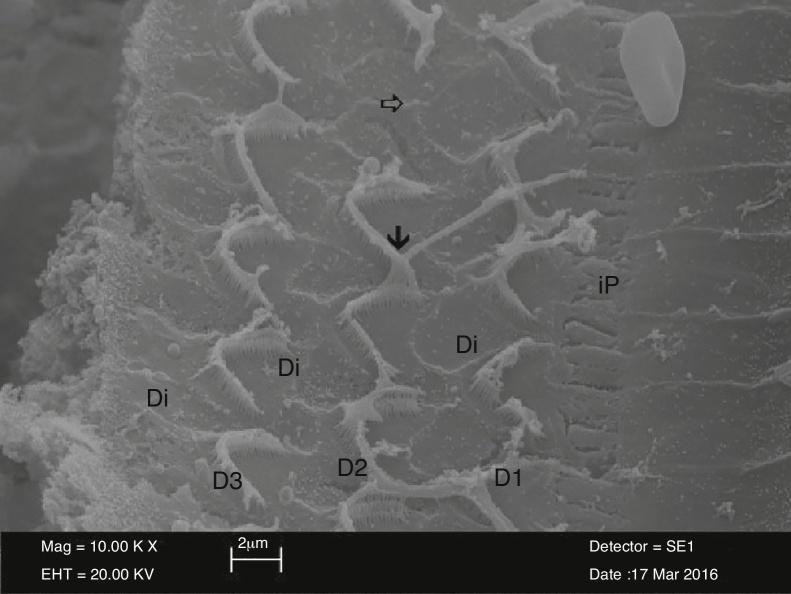
Scanning electron microscopy (SEM) image at 10,000x magnification showing the surface morphology of the Organ of Corti. The micrograph displays three rows of outer hair cells (labeled D1, D2, and D3) interspersed with supporting Deiters cells (Di) and adjacent to an inner pillar cell (iP). While the characteristic 'W' or 'V' shape arrangement of the stereocilia bundles is partially preserved, significant pathological changes are visible. A solid black arrow identifies apical adhesions where individual stereocilia have fused, making them indistinguishable from one another. A hollow white arrow indicates an area of outer hair cell loss and stereocilia degradation, representing structural irregularities in the sensory epithelium. This diagnostic image illustrates cellular-level ototoxicity or mechanical damage to the cochlear structures, focusing on the relationship between sensory hair cells and the reticular lamina formed by supporting cells.
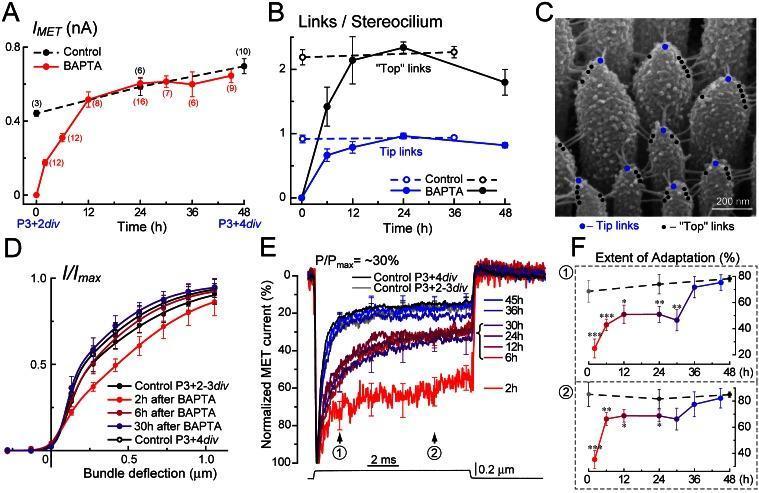
Educational panel illustrating the regeneration of mechanotransduction (MET) in inner ear hair cells (IHCs). Panel C features a high-resolution scanning electron micrograph (SEM) of IHC stereocilia, showing individual filaments. Extracellular 'tip links' (blue dots) connect shorter stereocilia to adjacent taller ones, while 'top links' (black dots) interconnect stereocilia within the same row. Accompanying graphs quantify MET recovery after BAPTA-induced link disruption. Graph A shows the regeneration of maximal MET current over 48 hours. Graph B tracks the physical recovery of tip and top link density. Graph D displays current-displacement relationships, showing the sensitivity of the MET apparatus during regeneration. Graph E illustrates normalized MET current traces, highlighting changes in the kinetics of adaptation. Panel F provides a time-course of the extent of adaptation at 1.6 ms and 7.6 ms post-deflection, comparing BAPTA-treated cells (red) to untreated controls (dashed lines), demonstrating a delayed recovery of physiological adaptation relative to structural link reassembly.
endocochlear potential stria vascularis potassium cochlea diagram
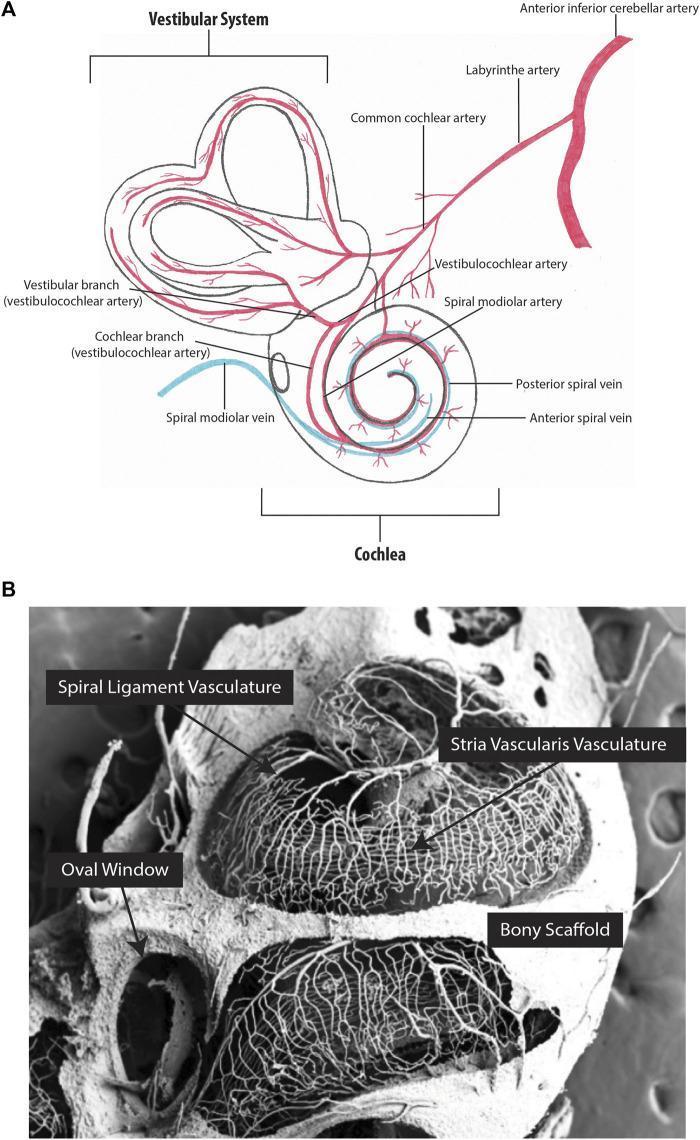
This figure illustrates the vascular anatomy of the inner ear through an anatomical diagram and a scanning electron micrograph (SEM). Panel A is an anatomical diagram showing the arterial supply (red) and venous drainage (blue) of the vestibular system and cochlea, featuring the labyrinthine artery, vestibulocochlear artery, spiral modiolar artery/vein, and anterior/posterior spiral veins. Panel B displays a high-resolution partial corrosion cast of a mouse cochlea using SEM. The image highlights the microvasculature, specifically contrasting the stria vascularis vasculature with the spiral ligament vasculature. The capillaries of the stria vascularis are shown as a dense, highly organized network of parallel vessels running along the cochlear length, whereas the spiral ligament vasculature appears more diffuse and less linear. Key landmarks such as the oval window and the bony scaffold of the temporal bone are labeled. This content is designed to teach cochlear microcirculation and homeostatic structures like the blood-labyrinth barrier, relevant to otorhinolaryngology and auditory physiology.
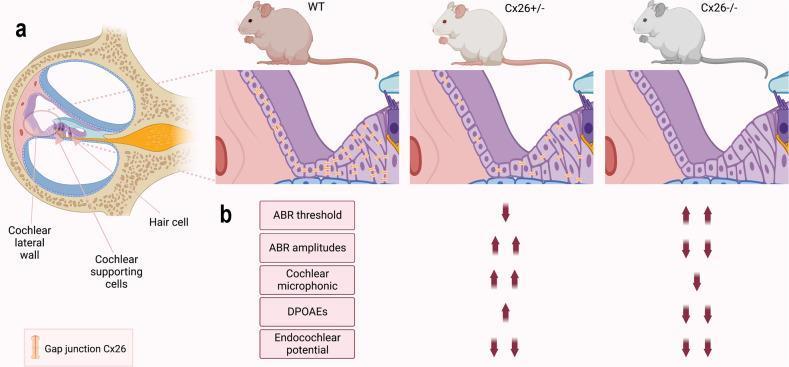
Educational diagram and comparative chart illustrating the pathophysiology of hearing sensitivity in relation to Connexin 26 (Cx26) gap junction networks within the cochlea. Section (a) features anatomical diagrams of the cochlear lateral wall and supporting cells across three mouse genotypes: Wild-type (WT), Cx26+/- (heterozygous deletion), and Cx26-/- (homozygous deletion). Gap junctions (Cx26) are represented by orange rectangular icons between cells; WT shows high density, Cx26+/- shows reduced density, and Cx26-/- shows a total absence. Section (b) is a comparative table summarizing auditory function changes. In Cx26+/- mice, downward arrows indicate decreased ABR thresholds and endocochlear potential, while upward arrows signify increased ABR amplitudes, cochlear microphonics (CM), and Distortion Product Otoacoustic Emissions (DPOAEs), suggesting hyperacusis-like hearing oversensitivity. In contrast, Cx26-/- mice show increased ABR thresholds and decreased levels across all other auditory parameters (ABR amplitudes, CM, DPOAEs, and endocochlear potential), indicating profound hearing loss. The image summarizes how partial gap junction loss triggers compensatory mechanisms that enhance cochlear amplification.
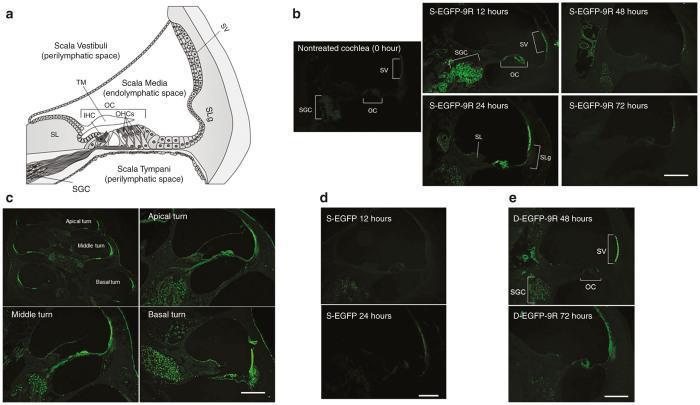
This composite educational graphic illustrates the anatomical structure and protein transduction efficiency of the mammalian cochlea. Panel (a) is an anatomical diagram showing a cross-section of the cochlea, labeling the scala vestibuli, scala media, scala tympani, stria vascularis (SV), organ of Corti (OC), and spiral ganglion cells (SGC). Panels (b) through (e) feature fluorescence microscopy images tracking enhanced green fluorescent protein (EGFP) expression. The clinical significance focuses on a delivery system using cell-penetrating peptides (9R) to overcome the blood-labyrinth barrier. The images compare single (s-EGFP-9R) versus double (d-EGFP-9R) applications over a timeline of 12 to 72 hours. Key findings show that s-EGFP-9R yields peak fluorescence in the SV, OC, and SGC at 12–24 hours, which then diminishes by 72 hours. In contrast, the d-EGFP-9R group demonstrates sustained, significant EGFP expression at the 48-hour mark. These visualizations serve to demonstrate localized drug delivery effectiveness within specific otic compartments, relevant for treating sensorineural hearing loss and inner ear pathology.
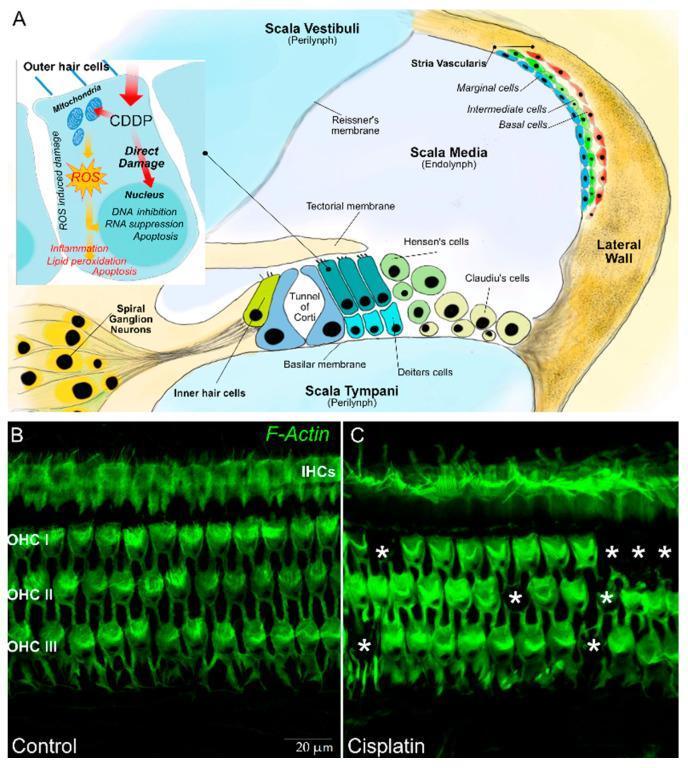
Educational medical composite depicting the anatomy and pathophysiology of the mammalian cochlea and ototoxicity. Panel A is an anatomical diagram showing a transverse section of the cochlear duct, labeling the scala vestibuli, scala media (containing endolymph), and scala tympani. Key structures include the organ of Corti with inner hair cells (IHC), three rows of outer hair cells (OHC), the tectorial membrane, stria vascularis, and spiral ganglion neurons. An inset illustrates the mechanism of cisplatin (CDDP) ototoxicity, highlighting reactive oxygen species (ROS) production, mitochondrial damage, and apoptosis. Panels B and C are fluorescence microscopy images of surface preparations of the organ of Corti stained for F-actin (green), visualizing stereociliary arrays and cuticular plates. Panel B (control) displays a highly organized single row of IHCs and three parallel rows of OHCs. Panel C (cisplatin-treated) demonstrates pathological hair cell loss, indicated by asterisks highlighting gaps in the OHC rows. This visual serves to teach the cellular organization of the auditory system and the mechanism of drug-induced sensorineural hearing loss.
Handwritten medical notes style, lined paper background, neat blue ink handwriting. Title at top: "MECHANOTRANSDUCTION IN AUDITORY HAIR CELLS OF ORGAN OF CORTI" underlined twice. Section 1: "STRUCTURE OF ORGAN OF CORTI" with a hand-drawn labeled diagram showing: cross-section of cochlea with scala vestibuli, scala media (endolymph), scala tympani (perilymph), Reissner membrane, basilar membrane, tectorial membrane. Organ of Corti detail showing: inner hair cell (1 row, ~3500 cells), outer hair cells (3-4 rows, ~12000 cells), stereocilia projecting up into tectorial membrane, spiral ganglion, cochlear nerve fibers. Labels written in neat handwriting with arrows. Below the diagram, written text: "- Cochlea has 3 chambers: scala vestibuli, scala media, scala tympani" / "- Scala media filled with ENDOLYMPH (high K+, low Na+)" / "- Scala vestibuli & tympani filled with PERILYMPH (like CSF)" / "- Hair cells sit on basilar membrane; cilia touch tectorial membrane"
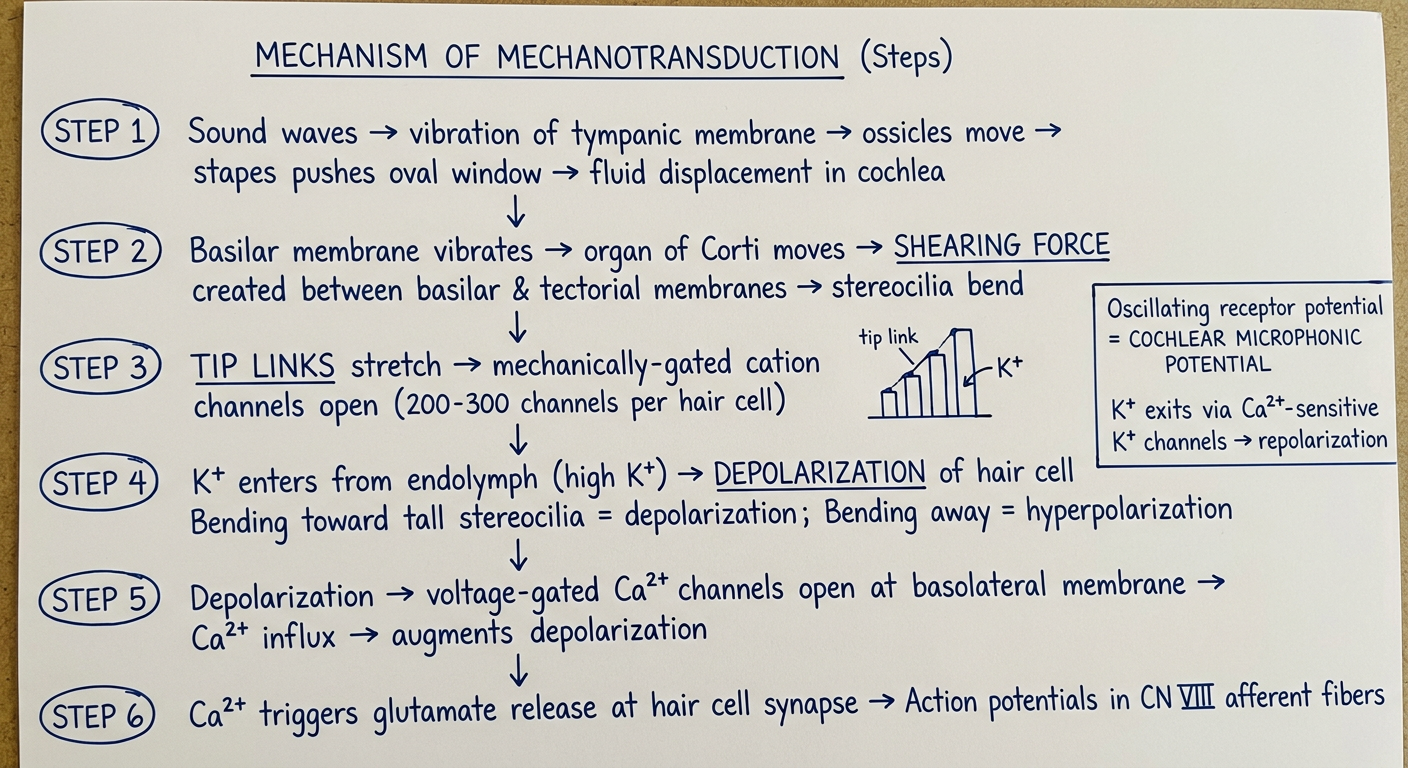
Handwritten medical exam notes on ruled white paper, blue ink, neat medical student handwriting. Title: "MECHANISM OF MECHANOTRANSDUCTION (Steps)" underlined. A hand-drawn flowchart/step diagram: STEP 1 (circled): "Sound waves → vibration of tympanic membrane → ossicles move → stapes pushes oval window → fluid displacement in cochlea" Arrow down STEP 2 (circled): "Basilar membrane vibrates → organ of Corti moves → SHEARING FORCE created between basilar & tectorial membranes → stereocilia bend" Arrow down STEP 3 (circled): "TIP LINKS stretch → mechanically-gated cation channels open (200-300 channels per hair cell)" with small diagram of stereocilia bundle showing tall and short stereocilia with tip link between them, arrow showing K+ entry Arrow down STEP 4 (circled): "K+ enters from endolymph (high K+) → DEPOLARIZATION of hair cell" with note: "Bending toward tall stereocilia = depolarization; Bending away = hyperpolarization" Arrow down STEP 5 (circled): "Depolarization → voltage-gated Ca²⁺ channels open at basolateral membrane → Ca²⁺ influx → augments depolarization" Arrow down STEP 6 (circled): "Ca²⁺ triggers glutamate release at hair cell synapse → Action potentials in CN VIII afferent fibers" Side note box: "Oscillating receptor potential = COCHLEAR MICROPHONIC POTENTIAL" "K+ exits via Ca²⁺-sensitive K+ channels → repolarization"
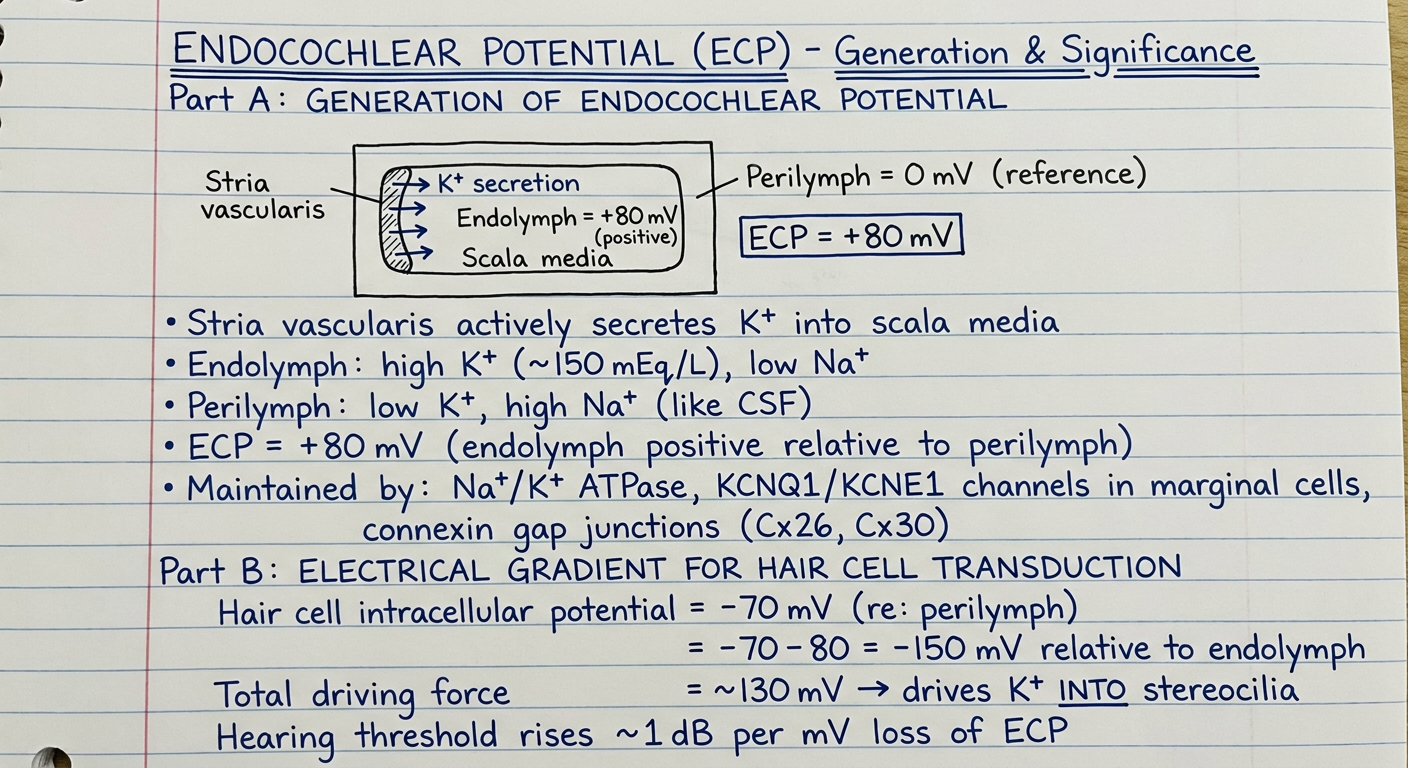
Handwritten medical exam answer on ruled paper, blue ink, neat student handwriting. Title: "ENDOCOCHLEAR POTENTIAL (ECP) - Generation & Significance" underlined twice. Part A: "GENERATION OF ENDOCOCHLEAR POTENTIAL" Drawn box diagram of cochlear cross-section showing: Stria vascularis on outer wall of scala media, with arrows showing K+ secretion from stria vascularis into scala media endolymph. Label: "Endolymph = +80 mV (positive)" and "Perilymph = 0 mV (reference)" and "ECP = +80 mV" Written text below diagram: "• Stria vascularis actively secretes K+ into scala media" "• Endolymph: high K+ (~150 mEq/L), low Na+" "• Perilymph: low K+, high Na+ (like CSF)" "• ECP = +80 mV (endolymph positive relative to perilymph)" "• Maintained by: Na+/K+ ATPase, KCNQ1/KCNE1 channels in marginal cells, connexin gap junctions (Cx26, Cx30)" Part B: "ELECTRICAL GRADIENT FOR HAIR CELL TRANSDUCTION" Small table/diagram: "Hair cell intracellular potential = -70 mV (re: perilymph)" "= -70 - 80 = -150 mV relative to endolymph" "Total driving force = ~130 mV → drives K+ INTO stereocilia" "Hearing threshold rises ~1 dB per mV loss of ECP"
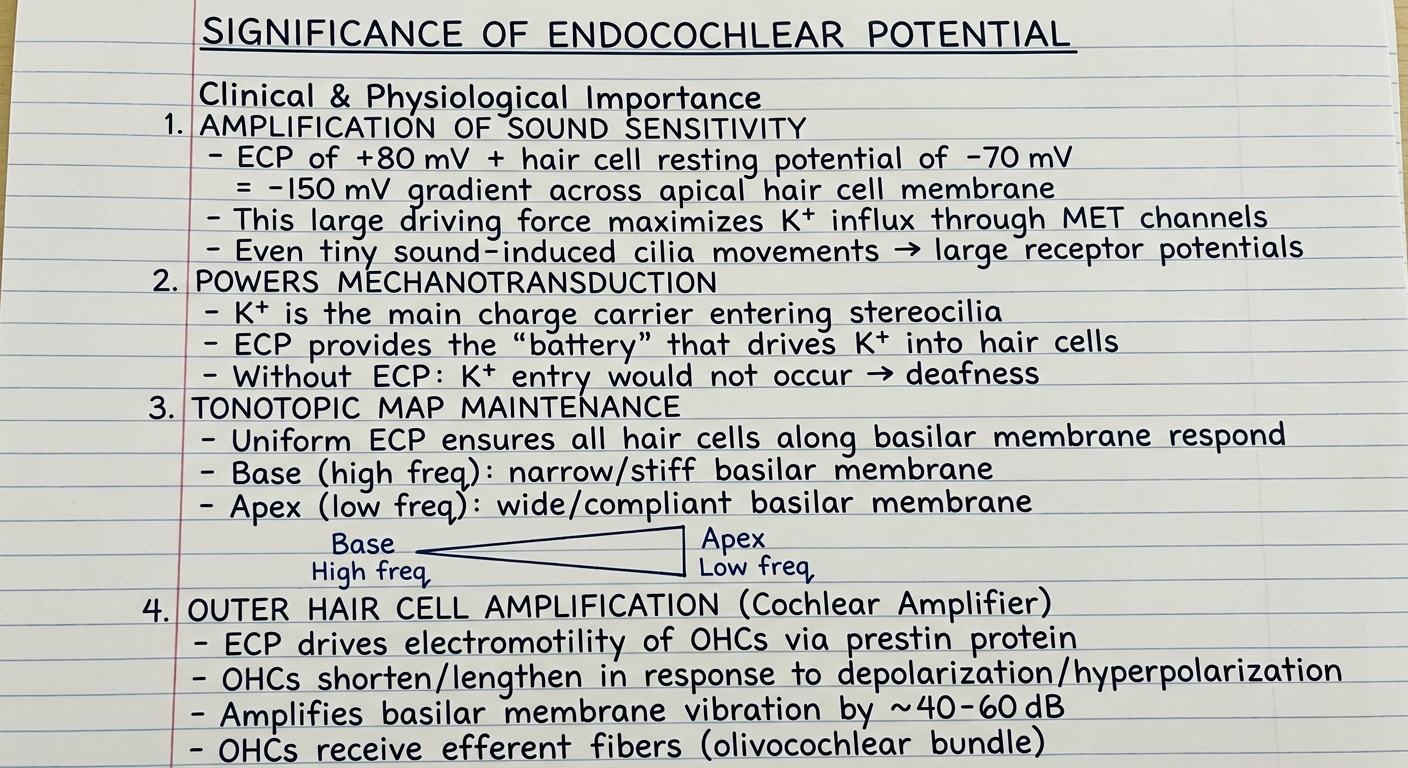
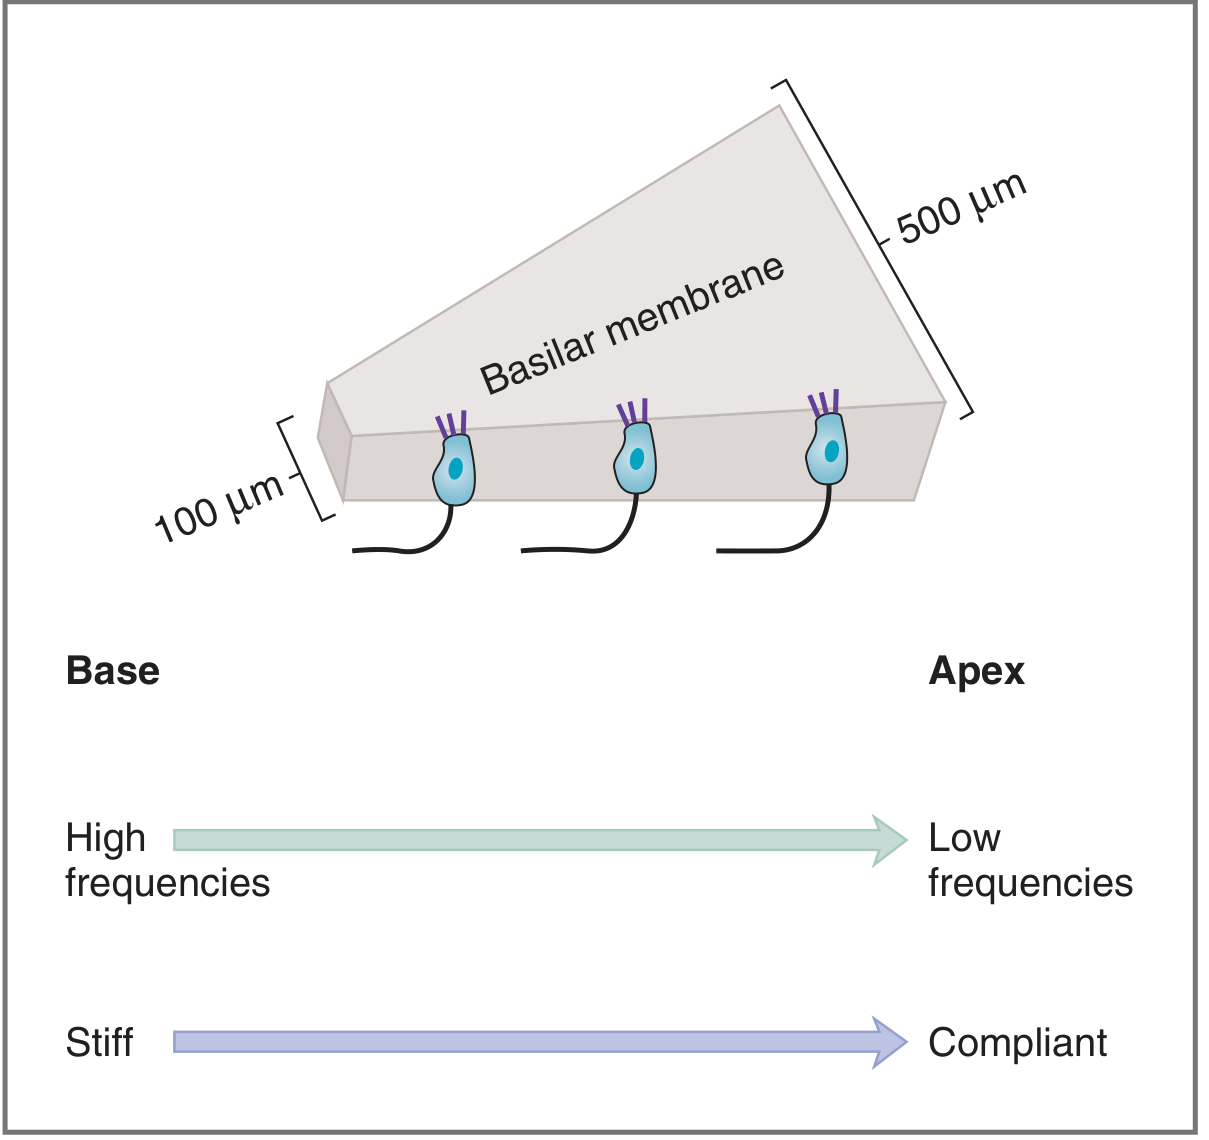
Handwritten medical exam answer on ruled paper, blue ink, clear student handwriting. Title: "SIGNIFICANCE OF ENDOCOCHLEAR POTENTIAL" underlined, with heading "Clinical & Physiological Importance" Written as numbered/bulleted points in neat handwriting: "1. AMPLIFICATION OF SOUND SENSITIVITY" " - ECP of +80 mV + hair cell resting potential of -70 mV" " - = -150 mV gradient across apical hair cell membrane" " - This large driving force maximizes K+ influx through MET channels" " - Even tiny sound-induced cilia movements → large receptor potentials" "2. POWERS MECHANOTRANSDUCTION" " - K+ is the main charge carrier entering stereocilia" " - ECP provides the 'battery' that drives K+ into hair cells" " - Without ECP: K+ entry would not occur → deafness" "3. TONOTOPIC MAP MAINTENANCE" " - Uniform ECP ensures all hair cells along basilar membrane respond" " - Base (high freq): narrow/stiff basilar membrane" " - Apex (low freq): wide/compliant basilar membrane" " Small diagram of basilar membrane showing base→apex gradient with 'High freq' at base and 'Low freq' at apex" "4. OUTER HAIR CELL AMPLIFICATION (Cochlear Amplifier)" " - ECP drives electromotility of OHCs via prestin protein" " - OHCs shorten/lengthen in response to depolarization/hyperpolarization" " - Amplifies basilar membrane vibration by ~40-60 dB" " - OHCs receive efferent fibers (olivocochlear bundle)"
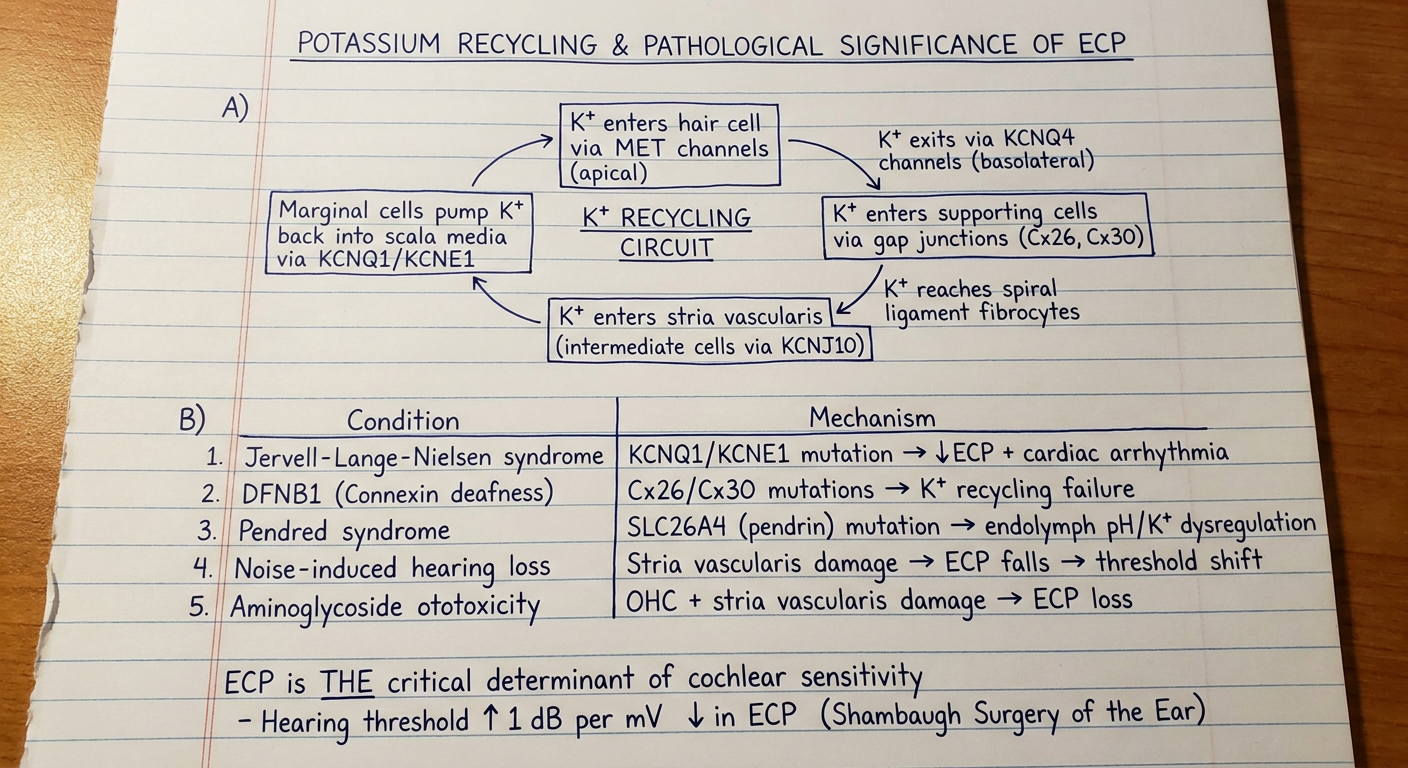
Handwritten medical notes on lined paper, blue pen, neat handwriting. Title: "POTASSIUM RECYCLING & PATHOLOGICAL SIGNIFICANCE OF ECP" underlined Section A - Hand drawn diagram showing K+ recycling pathway: "K+ enters hair cell via MET channels (apical)" → arrow → "K+ exits via KCNQ4 channels (basolateral)" → arrow → "K+ enters supporting cells via gap junctions (Cx26, Cx30)" → arrow → "K+ reaches spiral ligament fibrocytes" → arrow → "K+ enters stria vascularis (intermediate cells via KCNJ10)" → arrow → "Marginal cells pump K+ back into scala media via KCNQ1/KCNE1" This is drawn as a circular recycling diagram labeled "K+ RECYCLING CIRCUIT" Section B - Table of diseases when ECP is lost: Written as a neat hand-drawn table with 2 columns: Column 1: "Condition" | Column 2: "Mechanism" Row 1: "Jervell-Lange-Nielsen syndrome" | "KCNQ1/KCNE1 mutation → ↓ECP + cardiac arrhythmia" Row 2: "DFNB1 (Connexin deafness)" | "Cx26/Cx30 mutations → K+ recycling failure" Row 3: "Pendred syndrome" | "SLC26A4 (pendrin) mutation → endolymph pH/K+ dysregulation" Row 4: "Noise-induced hearing loss" | "Stria vascularis damage → ECP falls → threshold shift" Row 5: "Aminoglycoside ototoxicity" | "OHC + stria vascularis damage → ECP loss" Bottom note: "ECP is THE critical determinant of cochlear sensitivity - Hearing threshold ↑ 1 dB per mV ↓ in ECP (Shambaugh Surgery of the Ear)"
Handwritten medical exam answer on ruled paper, blue pen, clean student handwriting. This is a summary/conclusion page. Title: "SUMMARY & HIGH-YIELD POINTS FOR MD PHYSIOLOGY" with a star symbol, underlined. Written as a neat summary table and bullet points: "KEY NUMBERS TO REMEMBER:" Drawn as a small neat table: "Endocochlear potential = +80 mV (endolymph vs perilymph)" "Hair cell resting potential = -70 mV (vs perilymph)" "Gradient across apical membrane = -150 mV" "Total driving force = ~130 mV" "Inner hair cells = ~3500 (single row)" "Outer hair cells = ~12,000 (3-4 rows)" "1 dB hearing loss per 1 mV drop in ECP" "MECHANOTRANSDUCTION - KEY SEQUENCE:" "Sound → ossicles → oval window → fluid wave → basilar membrane vibration → shear force → stereocilia deflection → tip link stretch → MET channel opening → K+ influx → depolarization → Ca²+ influx → glutamate release → CN VIII firing" "ENDOCOCHLEAR POTENTIAL - KEY POINTS:" "✓ Generated by stria vascularis (K+ secretion)" "✓ K+ is the main current carrier (not Na+)" "✓ Serves as 'cochlear battery' for transduction" "✓ OHC amplification (prestin-driven electromotility)" "✓ Loss → sensorineural hearing loss" "✓ Connexin mutations → most common genetic deafness (DFNB1)" Bottom box: "COCHLEAR MICROPHONIC = AC receptor potential that mirrors sound waveform. Used clinically to test OHC function (auditory electrophysiology)"
Mechanotransduction in Auditory Hair Cells & Endocochlear Potential
MD Physiology - 10 Marks Theory Answer
Page 1 - Structure of the Organ of Corti
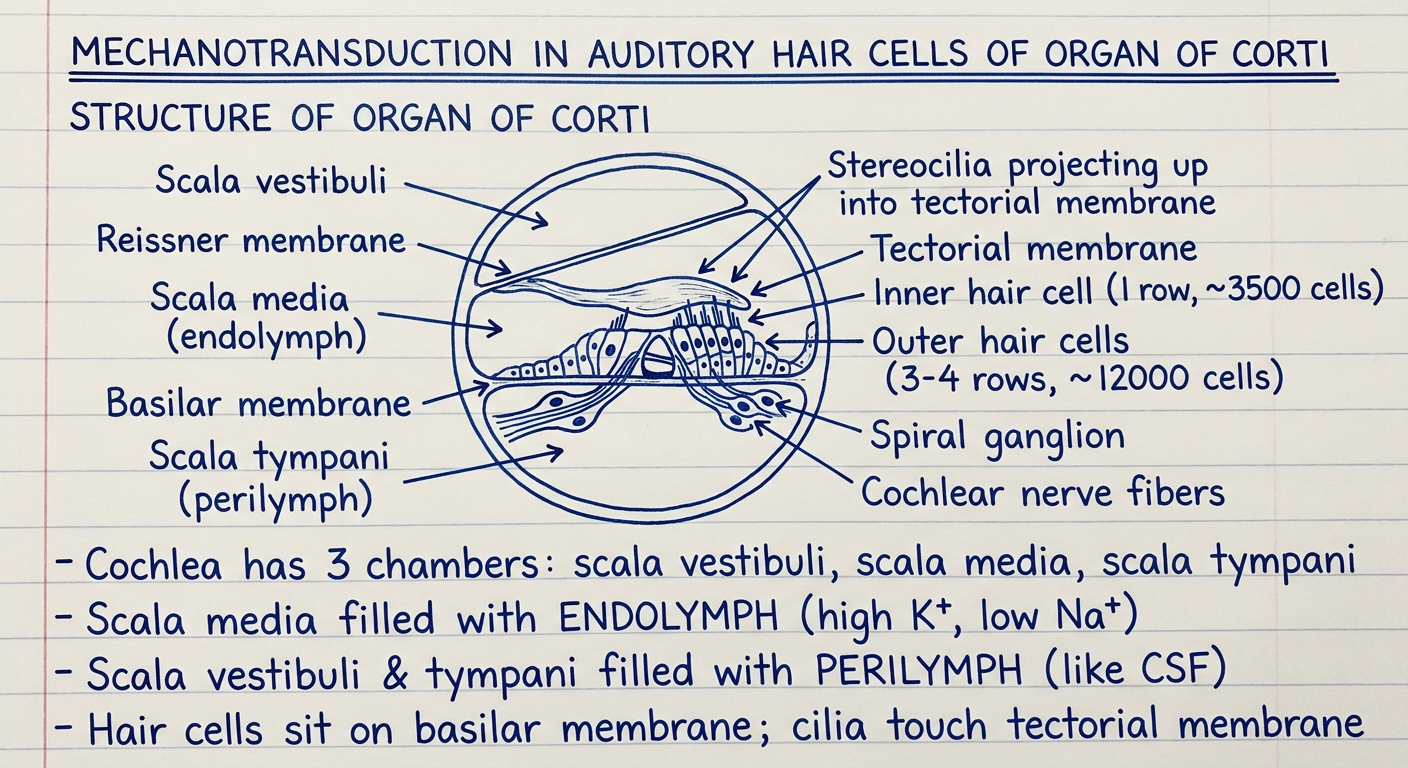
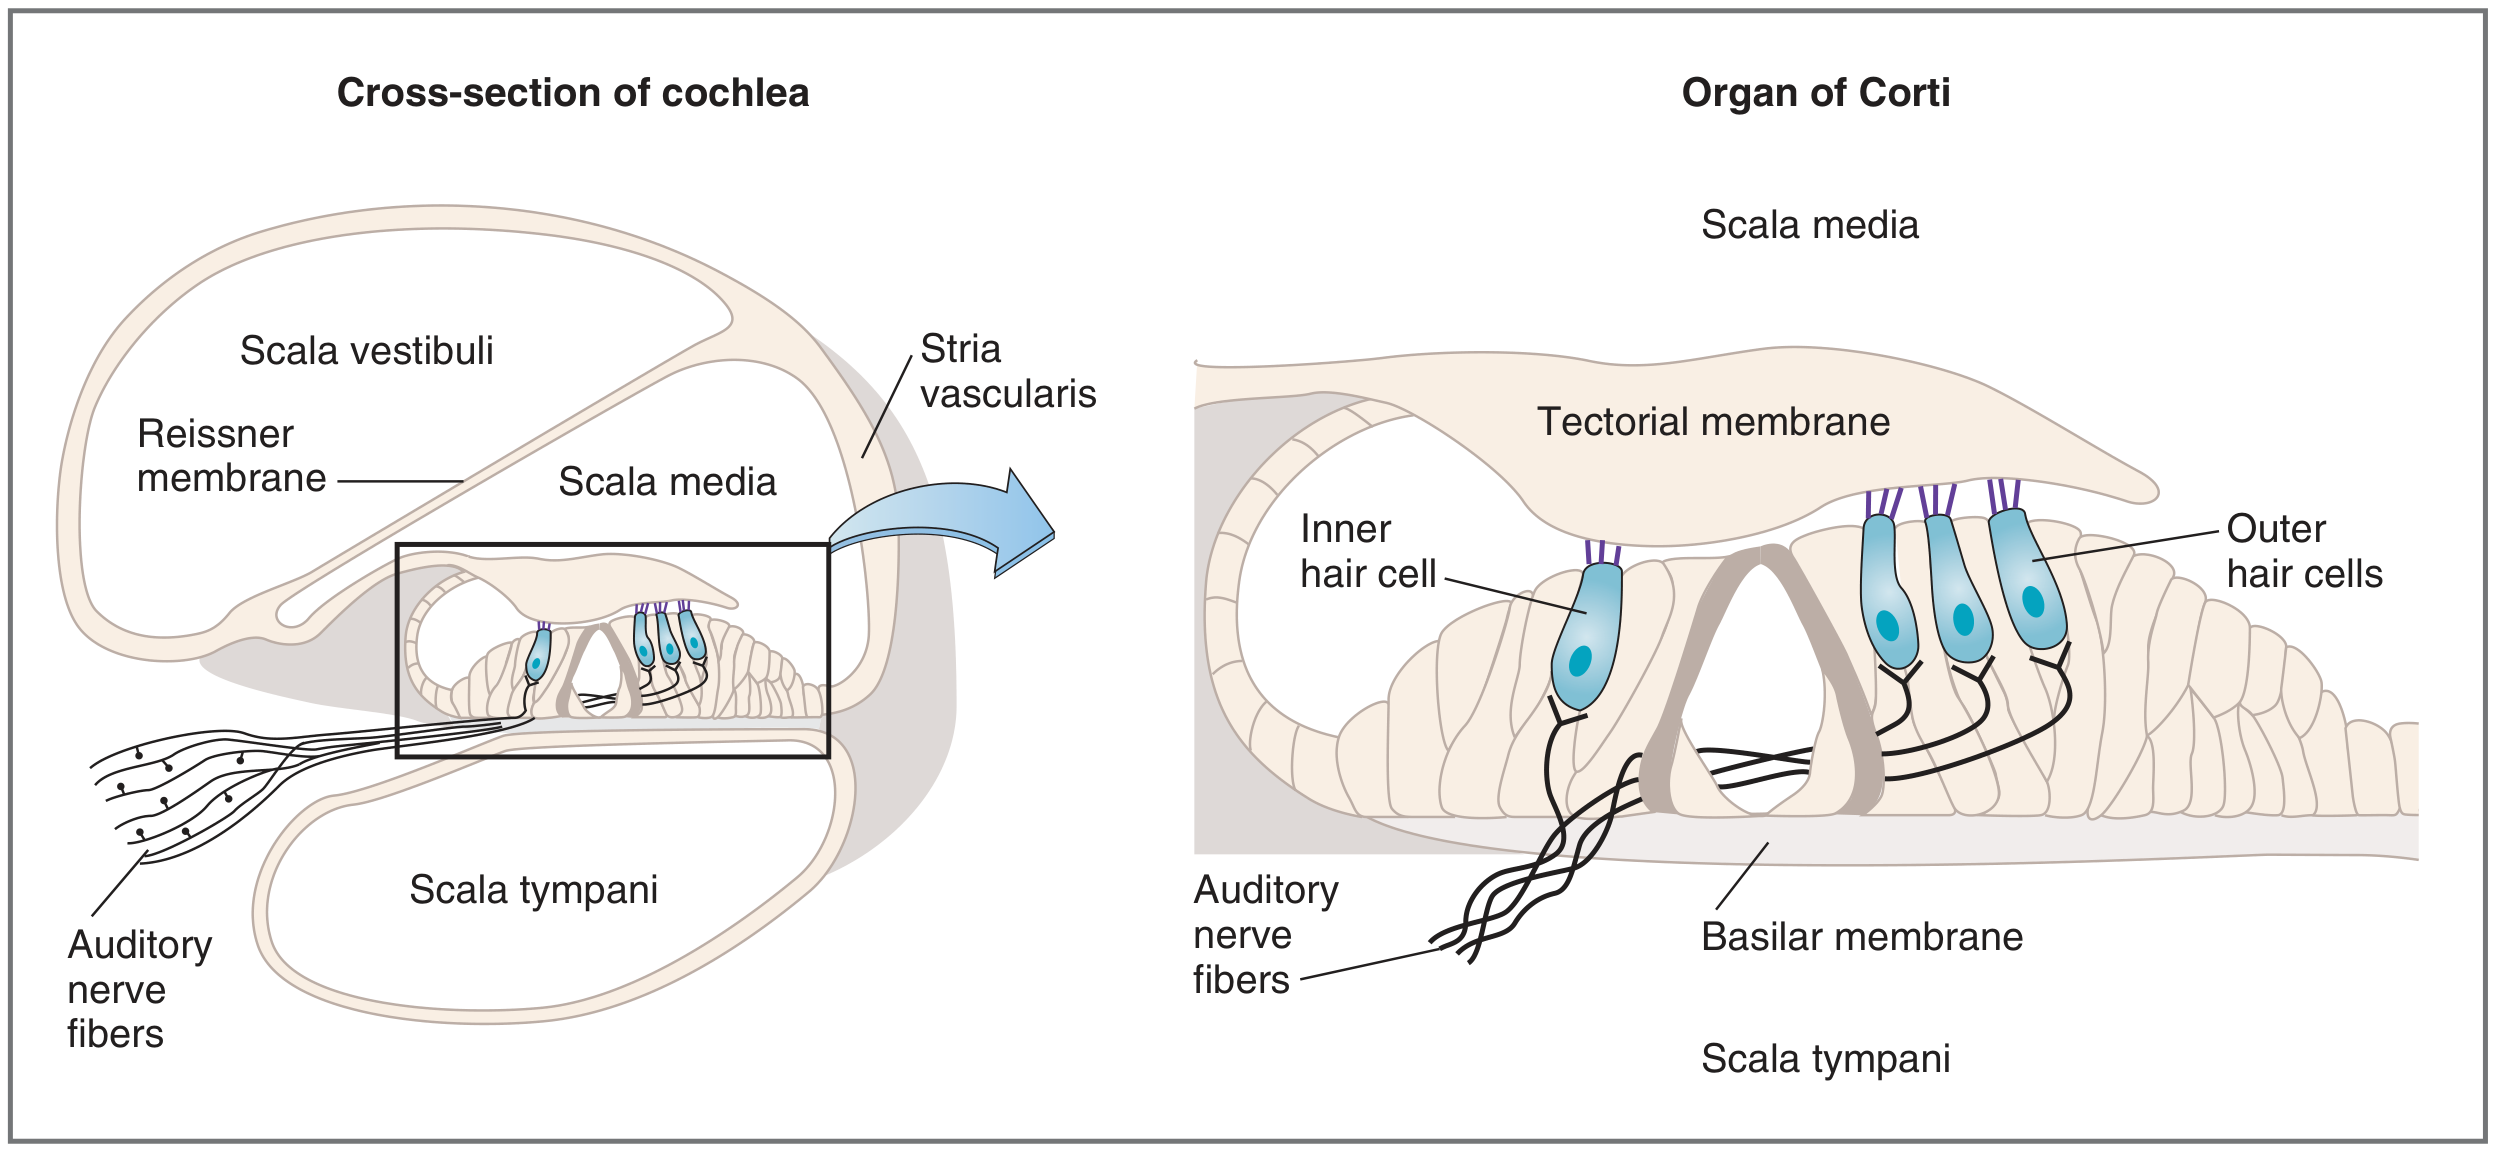
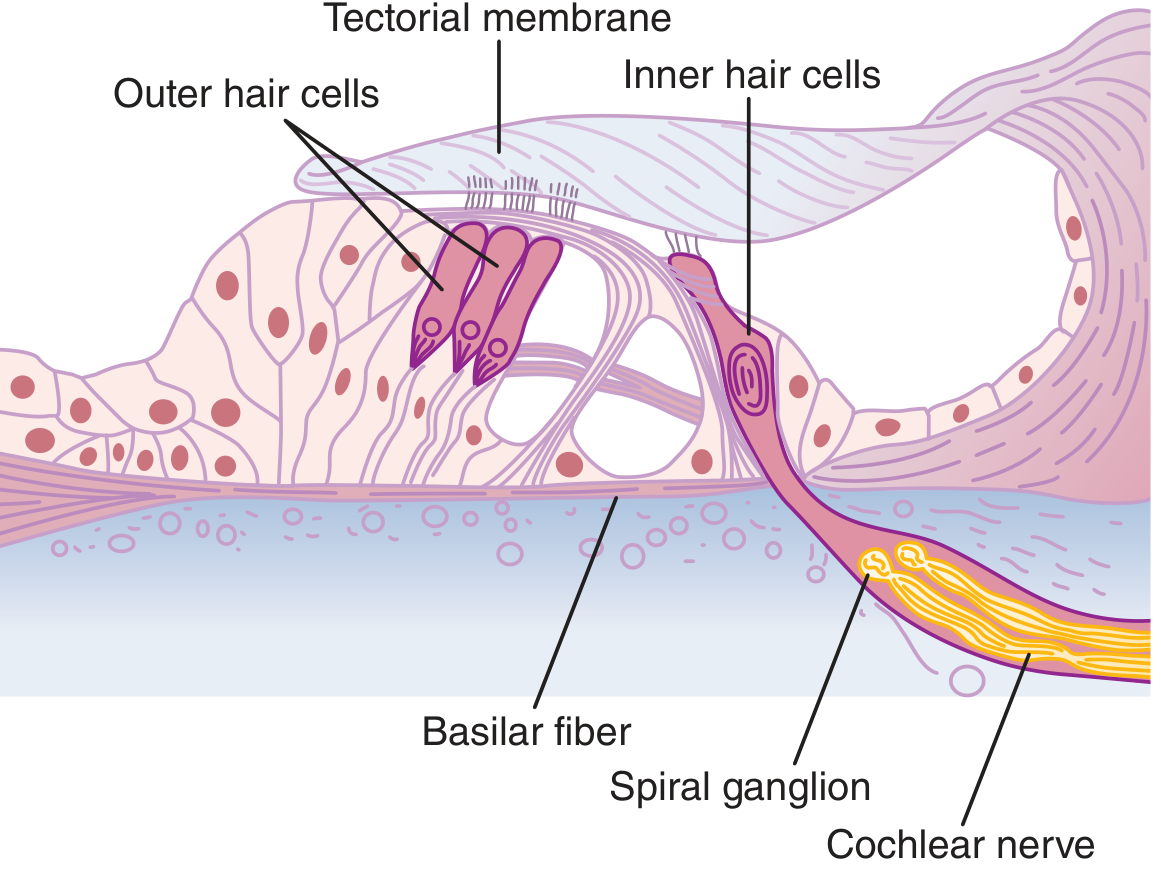
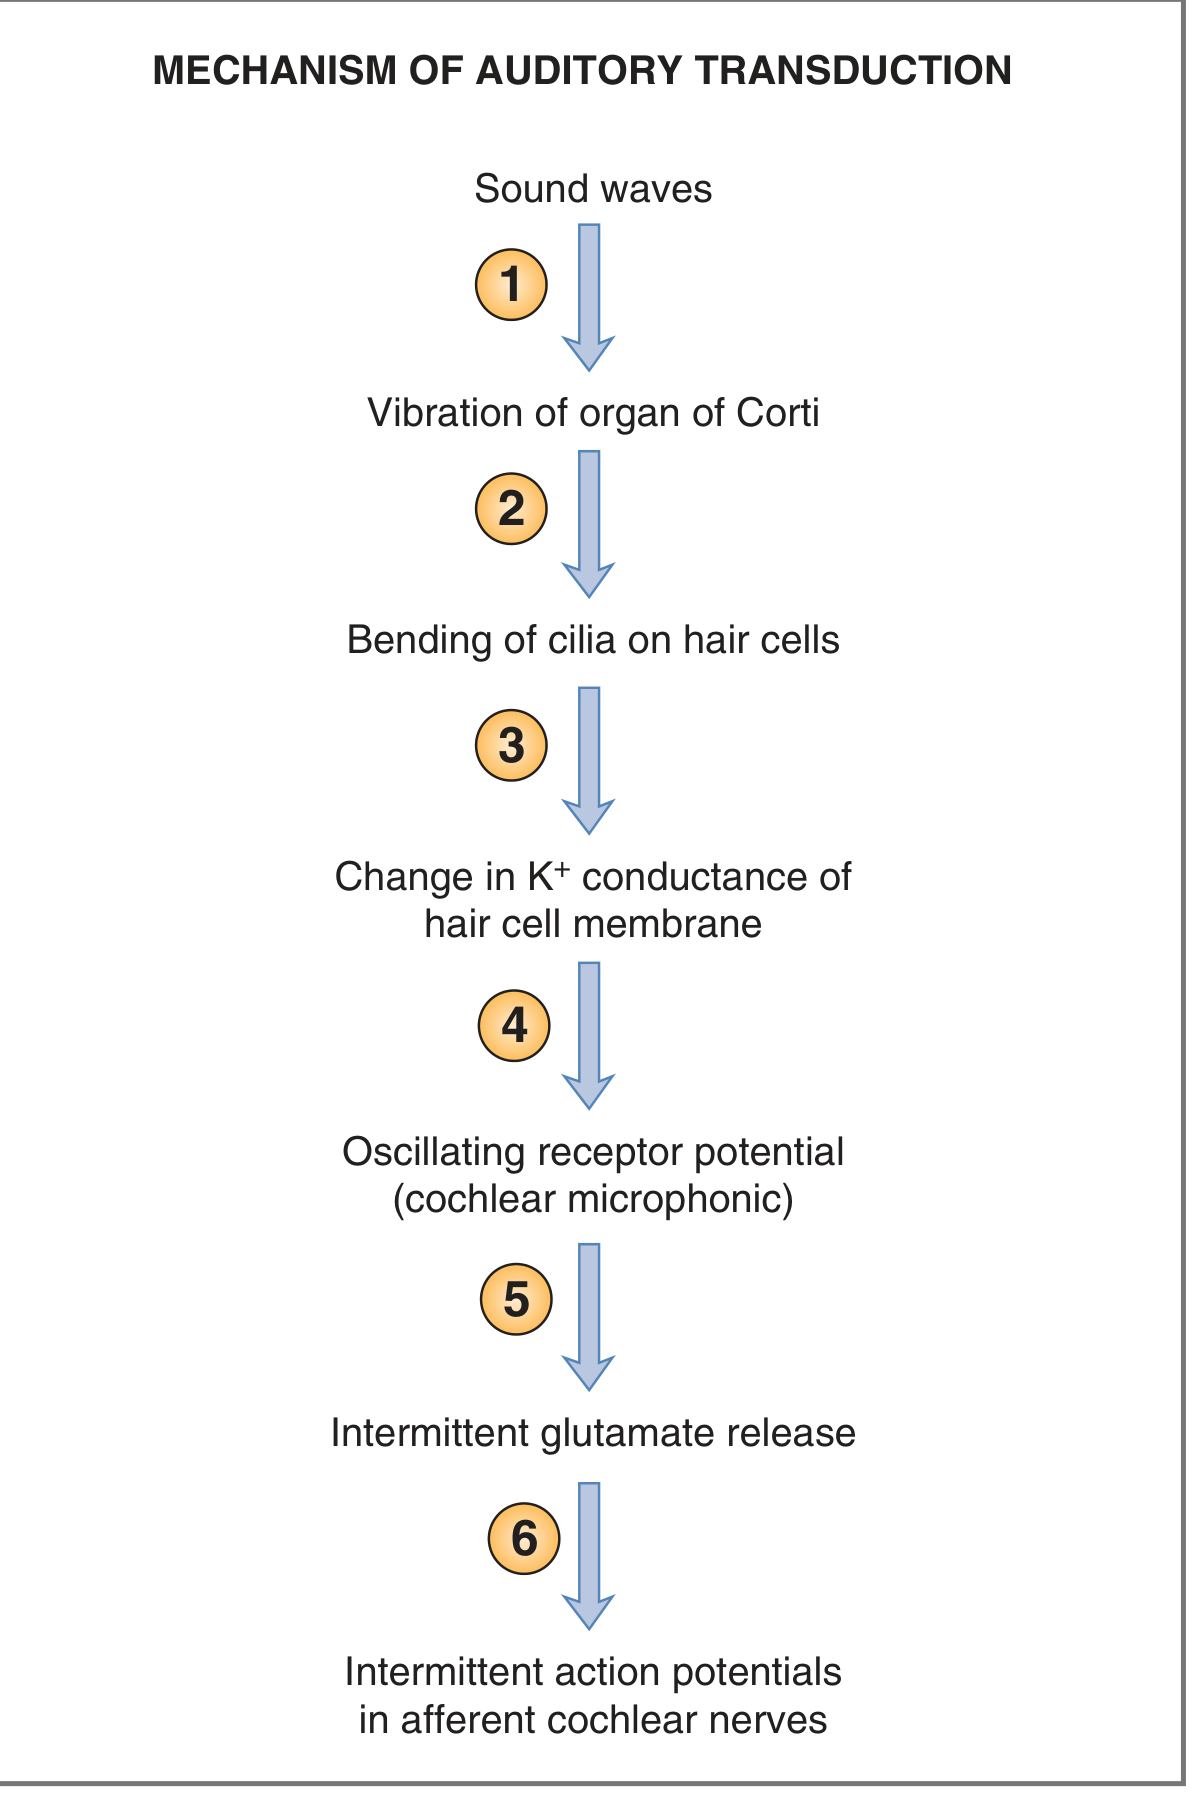
Page 2 - Step-by-Step Mechanism of Mechanotransduction
Page 3 - Endocochlear Potential: Generation & Electrical Gradient
Page 4 - Significance of Endocochlear Potential
Page 5 - K+ Recycling & Pathological Significance
Page 6 - Summary & High-Yield Mnemonics
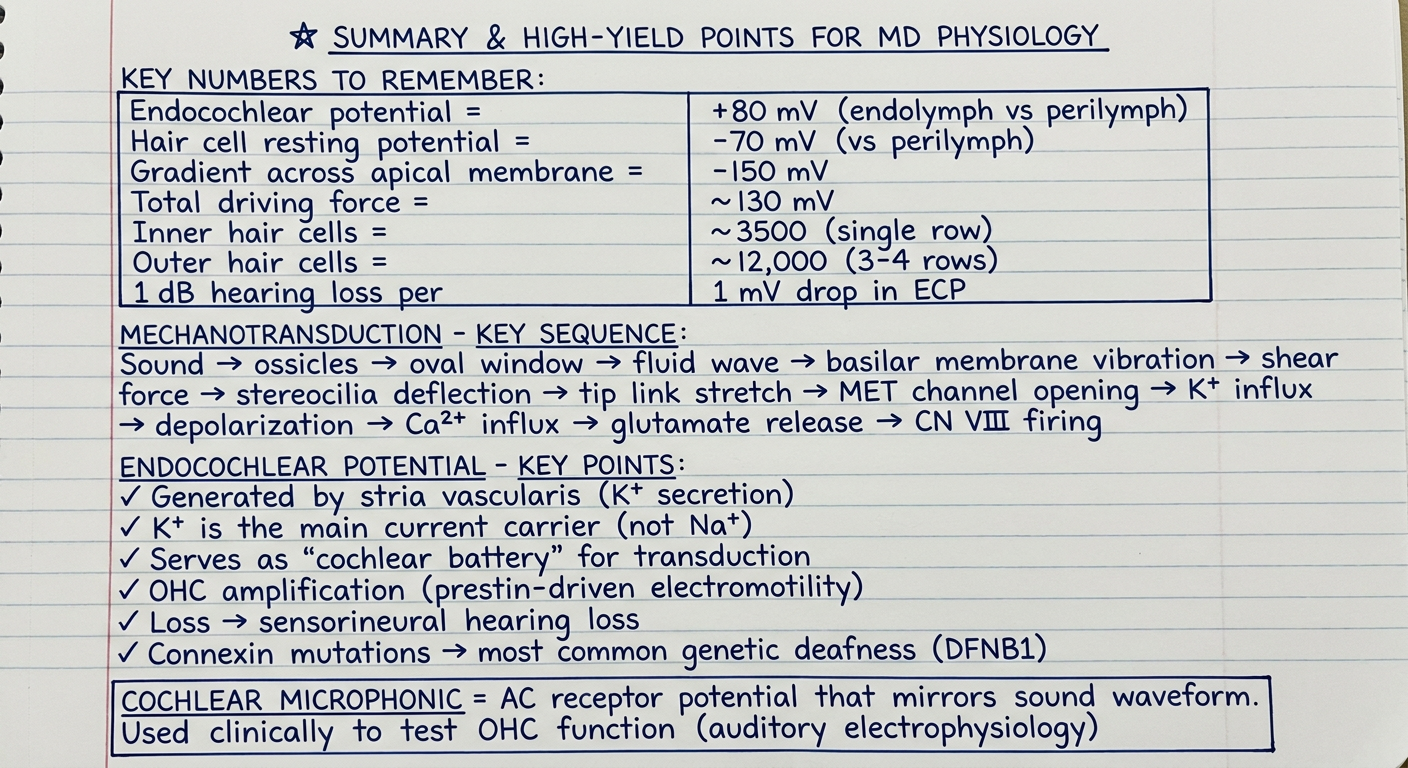
Typed Summary for Quick Revision
Part 1 - Mechanotransduction
- Sound wave → tympanic membrane → ossicular chain → stapes into oval window → fluid wave in cochlea
- Basilar membrane vibrates → shearing force between basilar and tectorial membranes → stereocilia deflect
- Deflection toward taller stereocilia stretches tip links → opens 200-300 mechanically-gated cation channels → K+ floods in from endolymph
- K+ influx → depolarization (receptor potential / cochlear microphonic). Deflection away = hyperpolarization
- Depolarization → voltage-gated Ca²+ channels open at presynaptic terminal → Ca²+ influx
- Ca²+ triggers glutamate release → action potentials in CN VIII afferent fibers → auditory pathway to cortex
Part 2 - Endocochlear Potential
| Feature | Value |
|---|---|
| ECP | +80 mV |
| Hair cell intracellular potential | -70 mV (vs perilymph) |
| Gradient across apical membrane | -150 mV vs endolymph |
| Hearing loss per mV drop in ECP | ~1 dB |
- Cochlear battery - The -150 mV gradient is the primary driving force for K+ to rush into stereocilia through open MET channels, amplifying sensitivity to tiny sounds
- OHC amplification - ECP drives electromotility of outer hair cells via the motor protein prestin, amplifying basilar membrane vibration by 40-60 dB
- Tonotopy - Maintains uniform sensitivity across the entire basilar membrane from base (high frequency, stiff) to apex (low frequency, compliant)
- Clinical diseases when ECP fails:
- Jervell-Lange-Nielsen syndrome (KCNQ1/KCNE1 mutation): deafness + cardiac arrhythmia
- DFNB1 (Cx26/Cx30 mutations): most common hereditary deafness globally
- Pendred syndrome (SLC26A4): ECP disruption + thyroid disease
- Aminoglycoside ototoxicity: stria vascularis damage → ECP loss → SNHL