
Squint surgery and complications Kindly make a long question’ answer explaining squint surgeries with color diagrams and complications to write in post graduate theory exam using standard books i.e kanski book khurana textbook of ophthalmology, binocular vision and ocular motility book and clinical strabismus management
squint strabismus surgery recession resection extraocular muscle diagram
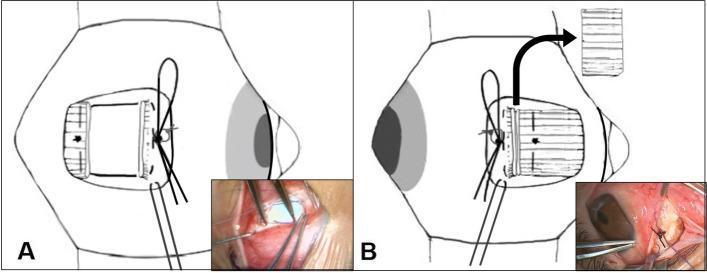
Educational diagram and intraoperative clinical photographs illustrating adjustable suture techniques in strabismus surgery. Figure A depicts a recession of the lateral rectus muscle using a hang-back technique. The muscle is disinserted and secured to the scleral insertion point with a single-loop bow-tie suture, allowing for postoperative adjustment. A 4-0 Vicryl bolster suture is placed below the bow-tie to facilitate easy untying, and a 6-0 Vicryl traction suture is anchored near the insertion site for exposure. Figure B shows a resection of the medial rectus muscle. The resected muscle is suspended approximately 2 mm posterior to the original insertion site, secured again with a single-loop bow-tie and bolster suture. This suspension creates necessary space for potential muscle advancement during the adjustment phase. The medical illustrations are paired with small clinical photographs of the respective surgical fields, highlighting the 'bow-tie' suture configuration used for fine-tuning ocular alignment postoperatively under topical anesthesia.
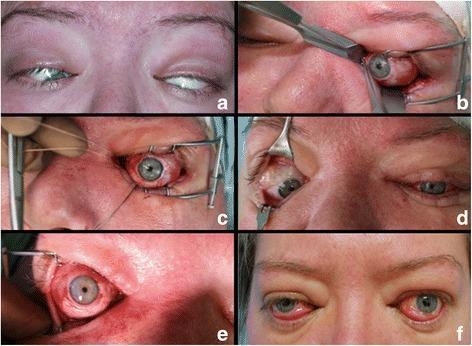
This composite of clinical photographs documents the surgical management of severe restrictive strabismus in a patient with Graves' ophthalmopathy. Panel (a) shows the preoperative presentation of extreme bilateral esotropia and hypotropia, with significant globe deviation and restricted visibility of the pupils. Panels (b), (c), and (e) illustrate intraoperative stages of extraocular muscle release and recession. Specifically, (b) displays the identification and isolation of the inferior rectus muscle using a squint hook through a transconjunctival approach. Panel (c) shows the globe in a corrected primary position after the release of the inferior and medial rectus muscles, with non-absorbable sutures and a speculum visible. Panel (d) demonstrates the asymmetrical interim results one week after surgery on the left eye only. Finally, panel (f) depicts the three-month postoperative outcome, showing restored vertical and horizontal primary alignment in both eyes, despite mild persistent exophthalmos and conjunctival hyperemia. This sequence highlights the effectiveness of extraocular muscle repositioning for correcting fixed globe deviation in advanced autoimmune thyroid eye disease.
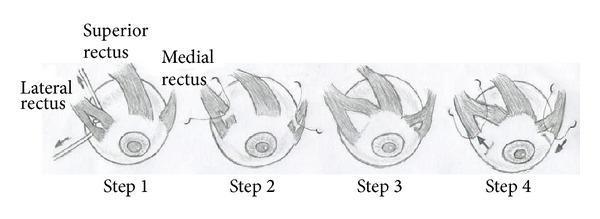
A four-step surgical diagram illustrating the Augmented Partial Rectus Muscle Transposition (APRMT) combined with horizontal muscle recession-resection, specifically for treating superior rectus muscle paralysis. Step 1 shows the longitudinal splitting (division) of the medial rectus and lateral rectus muscles into upper and lower halves. Step 2 depicts the shortening of the upper halves of both muscles using sutures. Step 3 illustrates the transposition of these shortened upper muscle segments to the nasal and temporal aspects of the superior rectus insertion point. Step 4 demonstrates the final stage involving the recession and resection of the remaining lower halves of the medial and lateral rectus muscles to correct concomitant horizontal strabismus. The diagram highlights anatomical relationships between the extraocular muscles on the globe and the specific surgical manipulations of muscle splitting, shortening, transposition, and recession-resection used in complex strabismus management.
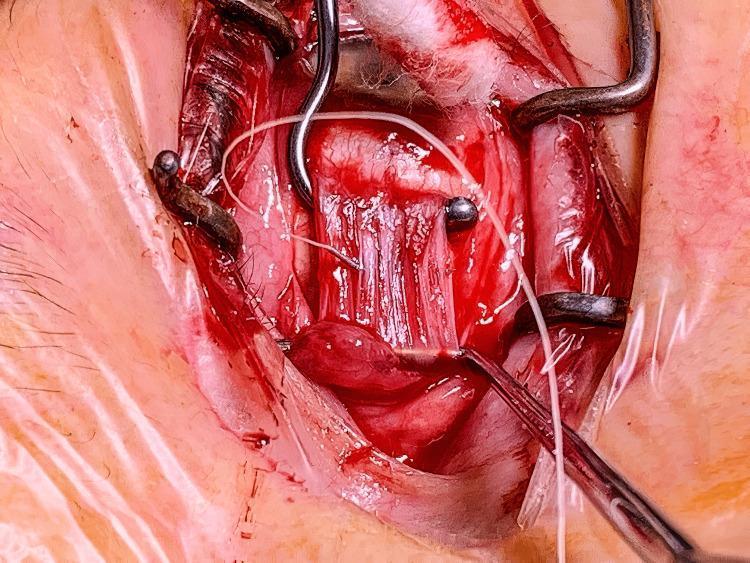
This intraoperative clinical photograph captures a surgical field during an ophthalmologic procedure, specifically a strabismus surgery involving the lateral rectus muscle. The central focus is on the lateral rectus muscle, which displays a characteristic striated, reddish-pink appearance and has been isolated and retracted. The surgical site is held open by metallic wire retractors (Desmarres or similar), providing exposure of the extraocular muscle and the underlying sclera. A notable round, nodular mass is visible attached to the belly of the muscle, representing a cyst associated with fat necrosis or foreign material such as silicone oil. Surgical sutures (likely 6-0 Vicryl or similar) are present, looped across the muscle to facilitate recession or resection manipulation. The surrounding conjunctiva and Tenon's capsule show expected surgical trauma, including minor hemorrhage and edema consistent with active dissection. This image serves as a teaching tool for identifying extraocular muscle anatomy and visualizing the surgical management of peri-muscular cystic lesions.
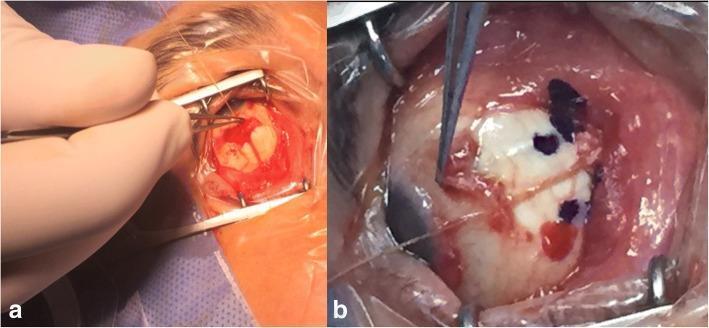
Two side-by-side intraoperative clinical photographs illustrating strabismus surgery using the relaxed muscle positioning technique. Image (a) shows the inferior rectus muscle under manipulation. A wire speculum provides ocular exposure while a surgeon's gloved hand uses forceps to grasp the muscle belly near its insertion. The surgical field exhibits expected conjunctival hyperaemia and minor hemorrhage typical of extraocular muscle dissection. Image (b) shows the medial rectus muscle during a similar procedure. The sclera is visible with dark gentian violet markings indicating the planned recession point for muscle reattachment. A surgical suture is visible traversing the field, and a muscle hook or forceps is used to stabilize the tissue. These images demonstrate the 'relaxed muscle positioning' method where the tendon is released, allowed to retract naturally, and then sutured to the globe at a precise marked point to correct restrictive strabismus or thyroid eye disease-related deviations.
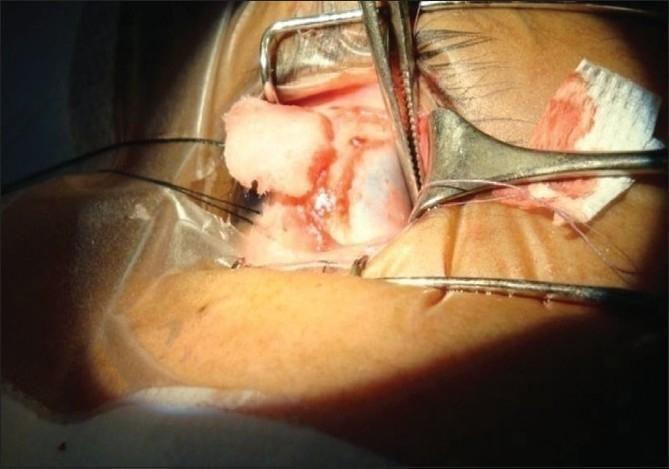
This clinical photograph captures a close-up, intraoperative view of an ophthalmic surgical procedure, specifically a strabismus surgery involving the extraocular muscle. The image demonstrates the application of pressure at the muscle-sclera interface following the use of iso-amyl cyanoacrylate (IAC) bioadhesive. The white scleral bed is clearly exposed, with the reddish extraocular muscle being held in apposition to the intended recession site. Key surgical instruments visible include a metallic speculum retracting the eyelids and forceps applying localized pressure to facilitate the adhesive 'take.' A blood-stained cellulose strip is used for drying the site, and fine, dark-colored sutures (6-0 Vicryl) are present, serving as backup traction or hang-back sutures. The photograph illustrates the surgical technique for sutureless muscle reattachment, focusing on the mechanical stabilization of the tissue-adhesive interface to ensure secure bonding before closure. This material is intended for educational use in ophthalmology and ophthalmic surgery training.
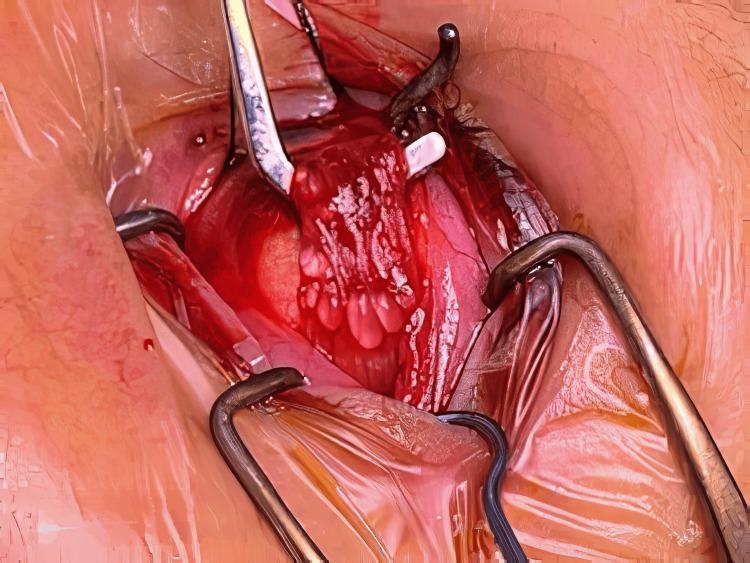
This intraoperative clinical photograph captures a surgical procedure on the extraocular muscles, specifically focusing on the lateral rectus muscle. The operative field is retracted using metal speculums and forceps, revealing a vascularized, erythematous surgical site. The primary finding is the presence of numerous small, whitish, spherical to ovoid cystic lesions embedded within and attached to the substance of the lateral rectus muscle. These cysts appear translucent and are distributed densely along the muscle fibers. The surrounding orbital tissues show evidence of surgical manipulation and mild hemorrhage. The visual demonstrates a rare complication where foreign material (such as silicone oil) or fat necrosis presents as multinodular cystic masses within the extraocular muscle tissue. This image is relevant for ophthalmology and strabismus surgery education, illustrating atypical anatomical findings during rectus muscle recession or resection.
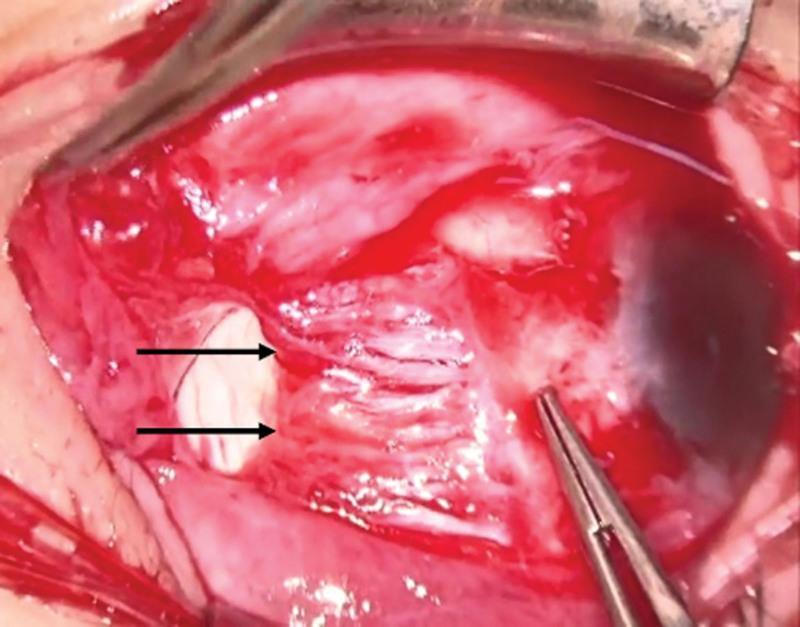
This intraoperative clinical photograph captures a surgical complication known as 'pulled-in-two syndrome' during strabismus surgery. The image shows the medial rectus (MR) muscle of the right eye, which has suffered a complete rupture at the muscle belly, approximately 5mm posterior to its scleral insertion. Two black horizontal arrows highlight the distal ruptured stump of the MR muscle. The surgical field displays exposed sclera and periocular connective tissue with visible focal hemorrhage and irrigation fluid. A pair of strabismus forceps is positioned in the lower right quadrant of the frame, currently manipulating the anterior segment of the muscle tissue. The image demonstrates the catastrophic failure of a contracted extraocular muscle under tension during a recession procedure, illustrating a rare but significant intraoperative risk in patients with high myopia or myopic strabismus fixus.
strabismus surgery complications lost muscle scleral perforation
This intraoperative clinical photograph captures a surgical complication known as 'pulled-in-two syndrome' during strabismus surgery. The image shows the medial rectus (MR) muscle of the right eye, which has suffered a complete rupture at the muscle belly, approximately 5mm posterior to its scleral insertion. Two black horizontal arrows highlight the distal ruptured stump of the MR muscle. The surgical field displays exposed sclera and periocular connective tissue with visible focal hemorrhage and irrigation fluid. A pair of strabismus forceps is positioned in the lower right quadrant of the frame, currently manipulating the anterior segment of the muscle tissue. The image demonstrates the catastrophic failure of a contracted extraocular muscle under tension during a recession procedure, illustrating a rare but significant intraoperative risk in patients with high myopia or myopic strabismus fixus.
Educational diagram and intraoperative clinical photographs illustrating adjustable suture techniques in strabismus surgery. Figure A depicts a recession of the lateral rectus muscle using a hang-back technique. The muscle is disinserted and secured to the scleral insertion point with a single-loop bow-tie suture, allowing for postoperative adjustment. A 4-0 Vicryl bolster suture is placed below the bow-tie to facilitate easy untying, and a 6-0 Vicryl traction suture is anchored near the insertion site for exposure. Figure B shows a resection of the medial rectus muscle. The resected muscle is suspended approximately 2 mm posterior to the original insertion site, secured again with a single-loop bow-tie and bolster suture. This suspension creates necessary space for potential muscle advancement during the adjustment phase. The medical illustrations are paired with small clinical photographs of the respective surgical fields, highlighting the 'bow-tie' suture configuration used for fine-tuning ocular alignment postoperatively under topical anesthesia.
This clinical photograph captures a close-up, intraoperative view of an ophthalmic surgical procedure, specifically a strabismus surgery involving the extraocular muscle. The image demonstrates the application of pressure at the muscle-sclera interface following the use of iso-amyl cyanoacrylate (IAC) bioadhesive. The white scleral bed is clearly exposed, with the reddish extraocular muscle being held in apposition to the intended recession site. Key surgical instruments visible include a metallic speculum retracting the eyelids and forceps applying localized pressure to facilitate the adhesive 'take.' A blood-stained cellulose strip is used for drying the site, and fine, dark-colored sutures (6-0 Vicryl) are present, serving as backup traction or hang-back sutures. The photograph illustrates the surgical technique for sutureless muscle reattachment, focusing on the mechanical stabilization of the tissue-adhesive interface to ensure secure bonding before closure. This material is intended for educational use in ophthalmology and ophthalmic surgery training.
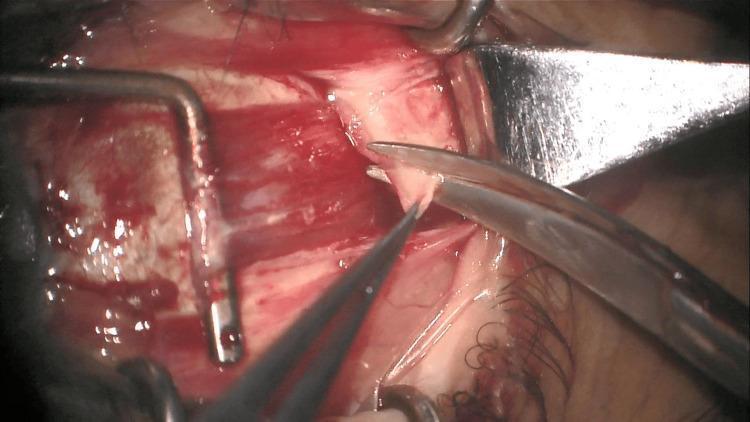
This clinical photograph captures an intraoperative view of an ophthalmic surgical procedure, specifically a biopsy of a mass located near the lateral rectus muscle. The surgical field demonstrates several specialized instruments in use: a strabismus muscle hook is utilized to retract and suspend the muscle belly away from the globe, while fine dissection scissors are seen isolating and excising a sample of tissue. The visible anatomy includes the extraocular muscle, characterized by its reddish-pink longitudinal muscle fibers, and the surrounding scleral surface of the eye globe. The biopsy technique shown involves the longitudinal division of fibers to obtain a superficial sample from the orbital surface of the rectus muscle. Hemorrhagic staining and surgical manipulation of the conjunctiva and muscle capsule are evident, reflecting the active dissection. This image serves as a teaching tool for oculoplastic or strabismus surgery, illustrating the precise instrumentation and anatomical handling required for extraocular muscle tissue sampling while minimizing mechanical complications.
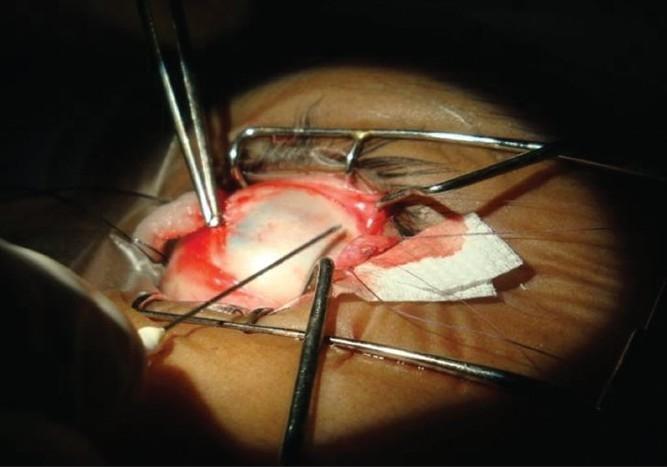
This clinical intraoperative photograph illustrates a surgical procedure on a human eye, likely a strabismus correction. An eyelid speculum is in place to provide surgical exposure of the globe and sclera. The surgical field demonstrates a disinserted extraocular muscle being prepared for recession. Metal surgical forceps are visible, retracting the conjunctiva and stabilizing the globe. A 25-gauge needle is positioned at the cut edge of the muscle belly, applying a clear liquid bioadhesive, specifically iso-amyl cyanoacrylate, to facilitate sutureless reattachment to the sclera. Key anatomical landmarks include the white scleral surface, the vascularized conjunctival edges, and the reddish muscle tissue. Pre-placed 6-0 Vicryl sutures are visible at the muscle edge, serving as a safety measure for the adhesion process. A blood-stained cellulose sponge is located adjacent to the surgical site for moisture control. This image serves as an educational resource for ophthalmic surgeons and students, demonstrating alternative tissue-fixation techniques in extraocular muscle surgery.
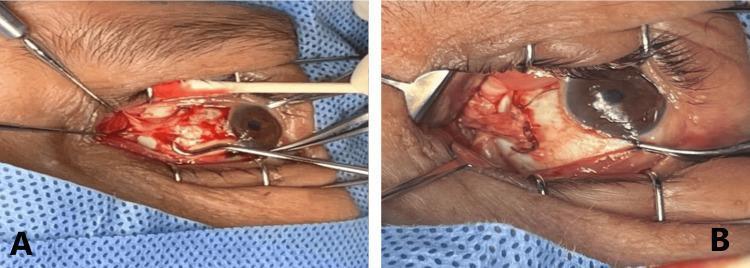
Two side-by-side intraoperative clinical photographs (A and B) demonstrating a medial rectus (MR) muscle resection on a left eye, a procedure typically used in ophthalmic surgery to correct strabismus or muscle palsy. Panel A shows the initial surgical exposure with the medial rectus muscle identified; the muscle appears notably thin and atrophic, a pathological state following a previous orbital injury or hematoma. The surgical field is maintained using eyelid speculums and muscle hooks, with moderate focal hemorrhage visible on the scleral surface. Panel B depicts the same anatomical region after a 6 mm resection of the MR muscle has been performed. In this view, the muscle is shortened and repositioned, appearing relatively thicker and more compact compared to the pre-resection state. Suture material is visible where the muscle has been reattached to the sclera. These images illustrate the surgical management of muscular atrophy to restore binocular alignment (orthophoria) and resolve diplopia.
anterior segment ischemia strabismus adjustable suture technique
Educational diagram and intraoperative clinical photographs illustrating adjustable suture techniques in strabismus surgery. Figure A depicts a recession of the lateral rectus muscle using a hang-back technique. The muscle is disinserted and secured to the scleral insertion point with a single-loop bow-tie suture, allowing for postoperative adjustment. A 4-0 Vicryl bolster suture is placed below the bow-tie to facilitate easy untying, and a 6-0 Vicryl traction suture is anchored near the insertion site for exposure. Figure B shows a resection of the medial rectus muscle. The resected muscle is suspended approximately 2 mm posterior to the original insertion site, secured again with a single-loop bow-tie and bolster suture. This suspension creates necessary space for potential muscle advancement during the adjustment phase. The medical illustrations are paired with small clinical photographs of the respective surgical fields, highlighting the 'bow-tie' suture configuration used for fine-tuning ocular alignment postoperatively under topical anesthesia.
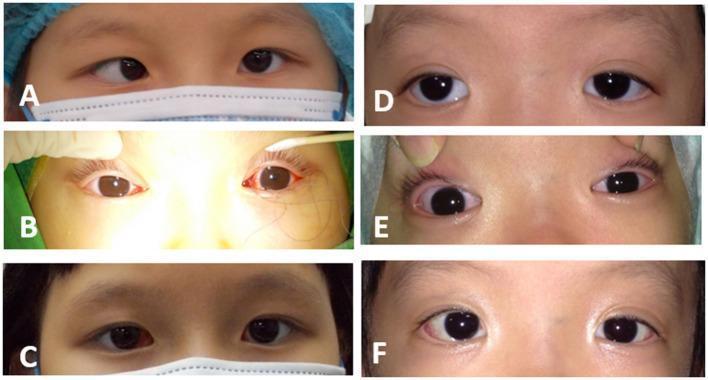
A composite of six perioperative clinical photographs demonstrating the surgical correction of strabismus in two pediatric patients. The images are arranged in two columns (A-C and D-F) representing pre-operative, intra-operative, and one-week post-operative stages. Column A-C features a patient with esotropia (inward deviation of the eye); panel A shows the initial deviation, B shows the intra-operative adjustable suture technique with a corneal light reflex test, cotton swab, and visible sutures, and C shows successful orthophoric alignment (straight eyes). Column D-F features a patient with exotropia (outward deviation); panel D shows the pre-operative state, E captures the intra-operative adjustment phase showing conjunctival hyperemia and eyelid retraction, and F demonstrates postoperative orthophoria. The images illustrate the clinical application of a modified adjustable suture technique to achieve precise ocular alignment, emphasizing the use of the Hirschberg test (corneal light reflex) for intra-operative decision-making in ophthalmology.
This three-panel diagnostic clinical photograph set demonstrates the arthroscopic technique for linking an anterior cruciate ligament (ACL) grasping suture to an adjustable femoral loop during a Bridge-Enhanced ACL Repair (BEAR) procedure in a left knee. Panel A illustrates the initial configuration where one limb of the blue/white ACL-grasping suture is passed through the white adjustable loop. Key landmarks include the lateral femoral condyle (LFC), internal brace sutures, and the TigerWire countertraction suture. Panel B shows the use of a metal switching stick inserted through the far anteromedial portal to maintain spacing while the ACL-grasping suture is tied to the adjustable loop, ensuring smooth loop sliding. Panel C displays the completed sequence where the adjustable loop has been shortened to eliminate slack in the grasping suture, bringing the ACL stump into proximity with the femoral notch. The medial femoral condyle (MFC) and a tibial shuttling suture are visible in this final panel, representing successful linkage and tensioning of the repair construct.
This series of six laparoscopic clinical photographs (a-f) documents the surgical removal of uterine compression sutures in a postpartum patient. Image (a) depicts the initial stage of the procedure, with laparoscopic forceps grasping a violet-colored suture thread. Panels (b) and (c) show the lower uterine segment before suture removal, characterized by visible violet compression sutures and tissue that appears dark and congested, suggesting focal ischemia. Panel (d) illustrates the same lower uterine segment immediately following suture removal, showing a reduction in dark discoloration. Panels (e) and (f) provide a comparative visual inspection of the anterior uterine wall. In (e), the wall exhibits a darker, congested hue prior to suture release. In (f), the anterior uterine wall shows a distinct transition to a pinkish-white and pinkish-red color, indicating improved tissue perfusion and the resolution of venous congestion. This educational material demonstrates the laparoscopic management of suspected uterine ischemia following B-Lynch or similar compression suturing techniques used for postpartum hemorrhage.
Medical diagram showing squint surgery procedures: recession and resection of extraocular muscles. Split into 4 labeled panels: Panel A shows normal eye with extraocular muscle insertion points labeled (medial rectus, lateral rectus); Panel B shows muscle recession procedure - muscle disinserted and reattached posteriorly to weaken it, with measurement caliper and new attachment site marked; Panel C shows muscle resection procedure - muscle shortened and reattached at original insertion to strengthen it, with excised segment shown; Panel D shows plication/tucking procedure. Use clean anatomical illustration style with color coding: blue for recession, red for resection, green for normal anatomy. Include clear labels and arrows.
Medical educational diagram showing complications of squint/strabismus surgery. Organized as a labeled grid with 6 panels: 1) Slipped/Lost muscle - showing medial rectus retracted behind Tenon's capsule with large angle exotropia; 2) Globe perforation by misplaced suture - cross-section of eye showing suture penetrating sclera into vitreous; 3) Anterior segment ischemia - showing dilated iris vessels, corneal edema, and poor perfusion after operating on multiple rectus muscles; 4) Over-correction (consecutive exotropia after esotropia surgery); 5) Under-correction (residual esotropia); 6) Fat adherence syndrome after inferior oblique surgery. Use anatomically accurate color illustration style with red for complications, green for normal anatomy. Clear labels and descriptive text for each panel.
Anatomical diagram of the right eye showing all four rectus muscle insertions with distances from limbus: medial rectus 5.5mm, inferior rectus 6.5mm, lateral rectus 6.9mm, superior rectus 7.7mm. Also show oblique muscles - superior oblique and inferior oblique. Include spiral of Tillaux, anterior ciliary arteries, and muscle cone. Color coded with labeled measurements. Clean medical illustration style.
Step-by-step surgical diagram of adjustable suture technique in strabismus surgery. 4 panels labeled A to D: Panel A shows muscle disinserted with double-armed suture placed through tendon stump; Panel B shows hang-back technique with bow-tie noose knot configuration, conjunctiva left open; Panel C shows postoperative adjustment - pulling noose anteriorly for more recession; Panel D shows adjustment for less recession - pulling muscle anteriorly. Medical illustration style with blue sutures on white background, red muscle tissue, white sclera. Clear step labels and arrows.
SQUINT SURGERY (STRABISMUS SURGERY) - COMPLICATIONS
Postgraduate Theory Answer
INTRODUCTION
PART I: SURGICAL ANATOMY RELEVANT TO SQUINT SURGERY
Rectus Muscle Insertions - Spiral of Tillaux
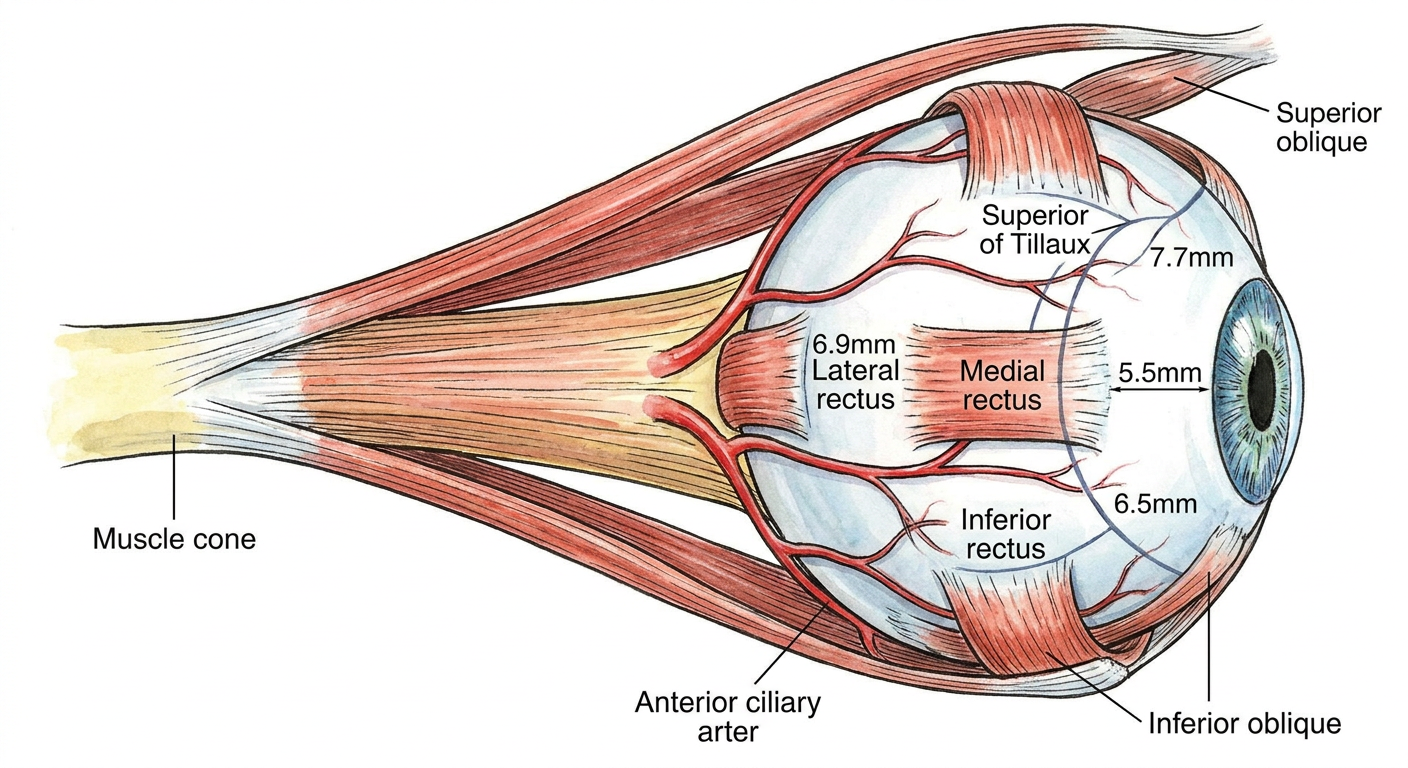
| Muscle | Distance from Limbus |
|---|---|
| Medial Rectus (MR) | 5.5 mm |
| Inferior Rectus (IR) | 6.5 mm |
| Lateral Rectus (LR) | 6.9 mm |
| Superior Rectus (SR) | 7.7 mm |
Anterior Ciliary Arteries (ACAs)
PART II: PREOPERATIVE ASSESSMENT
- Visual acuity - Snellen or Lea symbols; amblyopia treatment completed first
- Ocular deviation - prism cover test in all 9 positions of gaze, near and distance
- Sensory status - stereoacuity (Randot/TNO), fusion (Worth 4-dot), suppression testing
- Cycloplegic refraction - full hypermetropic correction before surgery for accommodative esotropia
- Ductions and versions - assess muscle overaction/underaction
- AC/A ratio - high AC/A suggests need for posterior fixation suture (Faden)
- Diplopia testing - Hess chart, Lees screen to map field of diplopia
- Forced duction test - to distinguish restrictive from paretic strabismus
- Fundus examination - to rule out macular pathology
PART III: INDICATIONS FOR SURGERY
| Type of Squint | Surgical Indication |
|---|---|
| Infantile esotropia (>6 months) | Large angle, non-accommodative element |
| Partially accommodative esotropia | Residual angle after full spectacle correction |
| Exotropia (intermittent/constant) | Poor control, deteriorating fusion, large angle |
| Paralytic strabismus (CN III/IV/VI palsy) | After 6 months if no spontaneous recovery |
| Restrictive strabismus (thyroid, trauma) | After disease stabilization |
| Consecutive strabismus | After previous overcorrection/undercorrection |
| DVD (Dissociated Vertical Deviation) | Superior rectus recession or inferior oblique surgery |
| Nystagmus with null zone | Kestenbaum-Anderson procedure |
PART IV: DOSAGE PLANNING
- For esotropia: bilateral MR recession or unilateral MR recession + LR resection (R&R)
- For exotropia: bilateral LR recession or unilateral LR recession + MR resection
- General rule: 1 mm of recession or resection ≈ 2-3 prism diopters of correction for horizontal muscles
PART V: SURGICAL PROCEDURES
A. CONJUNCTIVAL INCISIONS
B. WEAKENING PROCEDURES
1. RECESSION
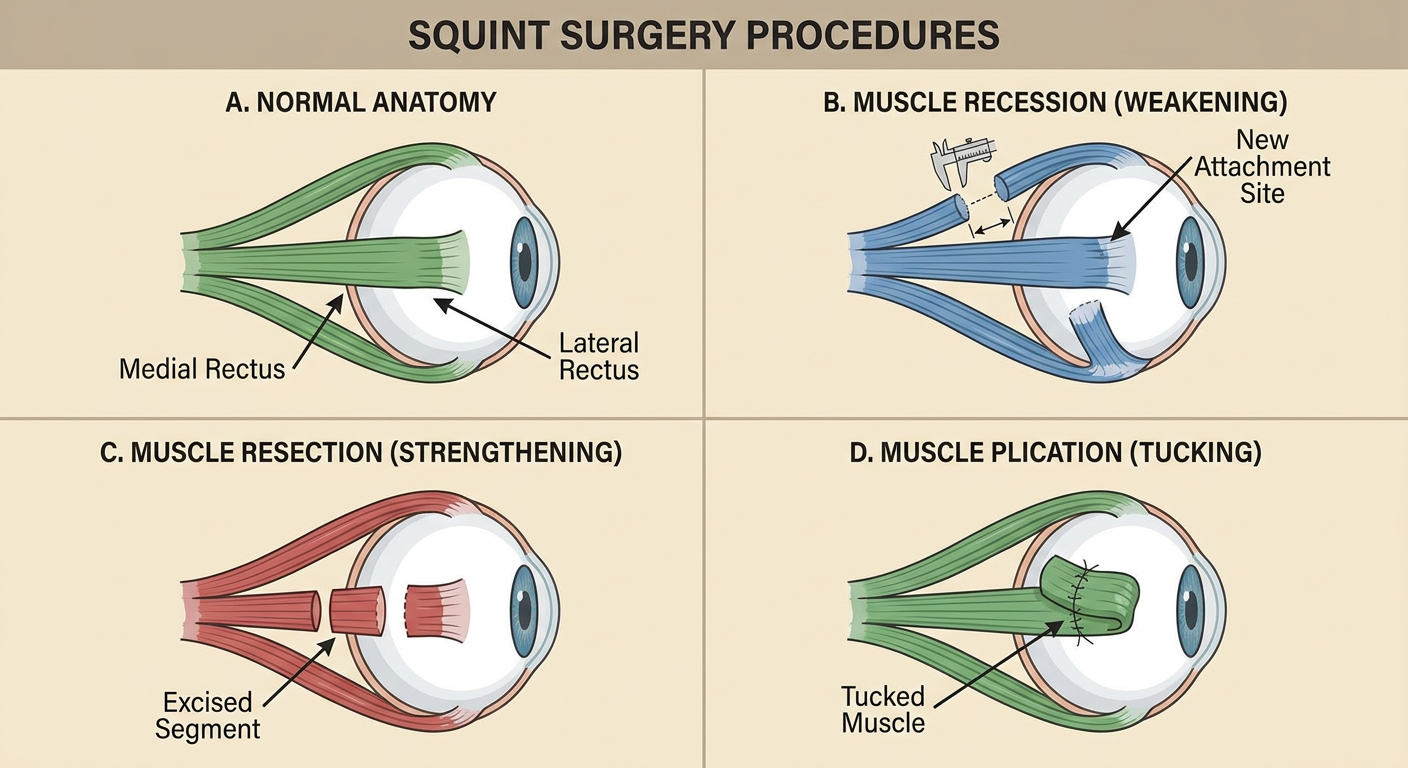
- Conjunctival incision and exposure of muscle with squint hook
- Two double-armed absorbable sutures (6-0 Vicryl) tied through the outer quarters of the tendon
- Tendon disinserted from sclera
- Amount of recession measured and marked on sclera with calipers (Castroviejo)
- Cut end of muscle sutured to sclera at measured distance behind original insertion
- Alternatively, a hang-back technique is used: muscle is held at the desired distance posteriorly by sutures without direct scleral suturing at the recession point
- Approach through inferotemporal fornix incision
- Squint hook passed behind posterior border of IO muscle
- Muscle disinserted; cut end sutured 3 mm posterior and temporal to temporal edge of inferior rectus insertion
- Extensive recession (anteroposition) eliminates the IO's elevating action - used in DVD
2. DISINSERTION / MYECTOMY
- Muscle detached from insertion without reattachment
- Used most commonly for overacting inferior oblique (IO)
- Occasionally for severely contracted rectus muscles
- Same technique as recession, but muscle not reattached
3. POSTERIOR FIXATION SUTURE (FADEN PROCEDURE)
- Principle: muscle belly sutured to sclera posteriorly (14-15 mm behind limbus), reducing the muscle's effective arc of contact in the direction of action
- Does NOT affect alignment in primary position
- Indications: near esotropia with high AC/A ratio (MR Faden), nystagmus compensation
- Often combined with recession
4. MARGINAL MYOTOMY / MYECTOMY
- Partial or full disinsertion creating graded weakening
- Used in high-angle deviations or fibrotic muscles
C. STRENGTHENING PROCEDURES
1. RESECTION
- Muscle exposed and two absorbable sutures placed at a measured distance behind insertion
- Muscle anterior to sutures is excised (the measured segment is removed)
- Cut end reattached to original insertion site
- Net effect: muscle is now shorter, generating more tension and rotating eye in the direction of that muscle's action
2. PLICATION (TUCKING)
- A fold is taken in the muscle tendon and sutured, shortening it without excision
- Advantage over resection: less traumatic, preserves anterior ciliary vessels, reversible
- Used for rectus muscles and superior oblique tucks (Harada-Ito procedure in IV nerve palsy)
- Increasingly preferred over resection in modern practice
3. ADVANCEMENT
- A previously recessed muscle is moved forward (toward limbus) to increase its strength
- Used in secondary surgery to reverse over-recession
D. COMBINED PROCEDURES (R&R)
- MR recession + LR resection for esotropia in monocular approach
- LR recession + MR resection for exotropia
- Total correction ≈ sum of individual effects
- Avoids operating on fellow eye; preserves unoperated muscles for future surgery
E. MUSCLE TRANSPOSITION PROCEDURES
F. ADJUSTABLE SUTURE TECHNIQUE
- Muscle disinserted and recession/resection performed with standard suture placement
- The suture ends are passed through the insertion stump and tied as a noose (slip) knot
- A second suture ties tightly around the muscle suture, anterior to its emergence from stump
- Conjunctiva is left open
- Postoperative adjustment done a few hours later under topical anaesthesia
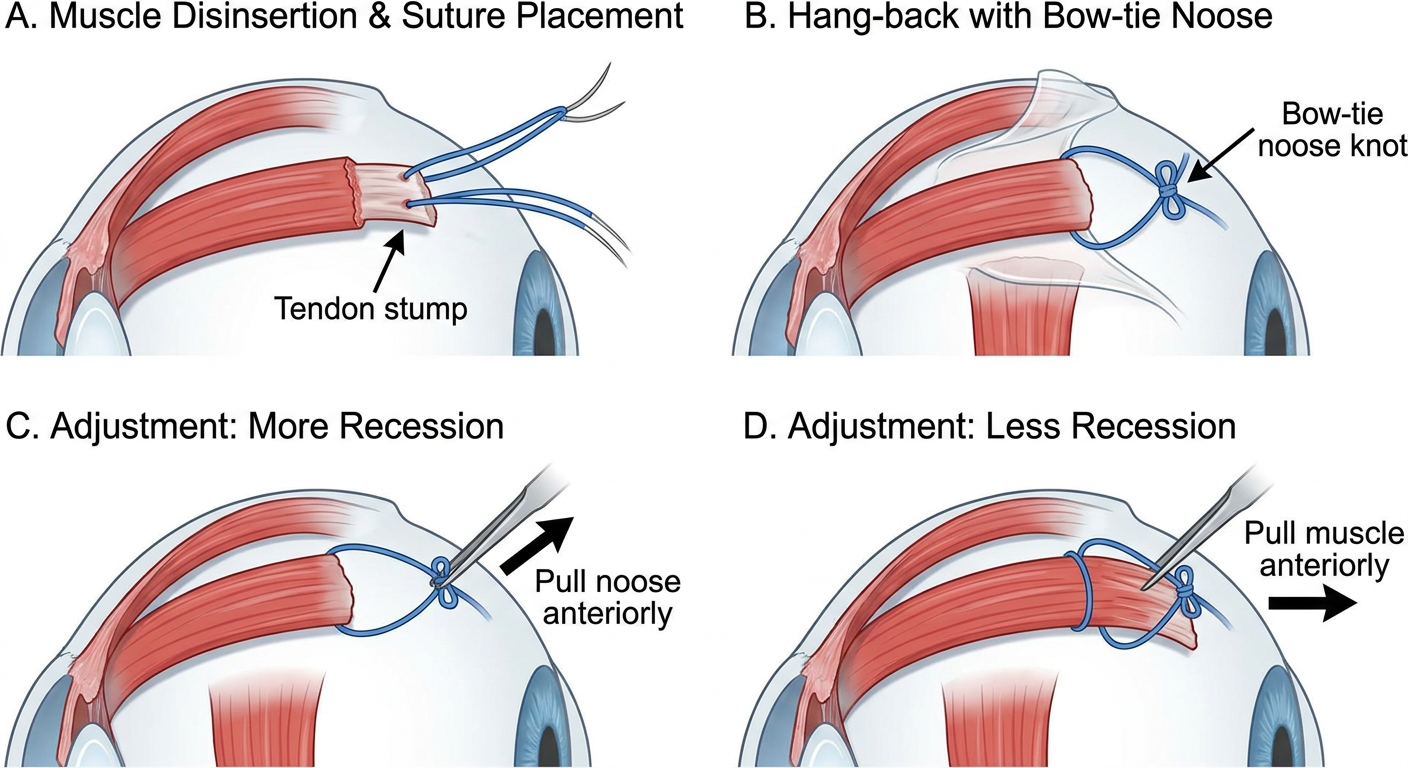
- If alignment satisfactory: suture tied off, ends cut short
- If more recession needed: noose pulled anteriorly to give additional slack; muscle moves posteriorly when patient looks toward that muscle's field of action
- If less recession needed: muscle suture pulled anteriorly and knot tightened against stump
- Thyroid ophthalmopathy (restrictive and unpredictable)
- Secondary/re-operations (fibrosis present)
- Paralytic strabismus
- Adults with dissociated deviations
- Any case with uncertain dosimetry
G. SPECIAL PROCEDURES
Kestenbaum-Anderson Procedure (for nystagmus with null zone)
Inferior Oblique Anteroposition (Anterotransposition)
Superior Oblique Tenotomy / Tenectomy
PART VI: BOTULINUM TOXIN CHEMODENERVATION
- Temporary paralysis induced by injection under topical anaesthesia + EMG control
- Effect develops over several days, maximal at 1-2 weeks, wears off by 3 months
- During paralysis, the antagonist muscle contracts and a long-term mechanical change may persist
- Postoperative small-angle residual strabismus (2-8 weeks after surgery)
- Infantile esotropia - bilateral MR injection to diverge eyes and allow LR to shorten
- Active thyroid ophthalmopathy when surgery is premature
- Prephthisical or inflamed eye where surgery is contraindicated
- To determine risk of postoperative diplopia before corrective surgery
- Assessment of potential for BSV in constant manifest squint
PART VII: COMPLICATIONS OF SQUINT SURGERY
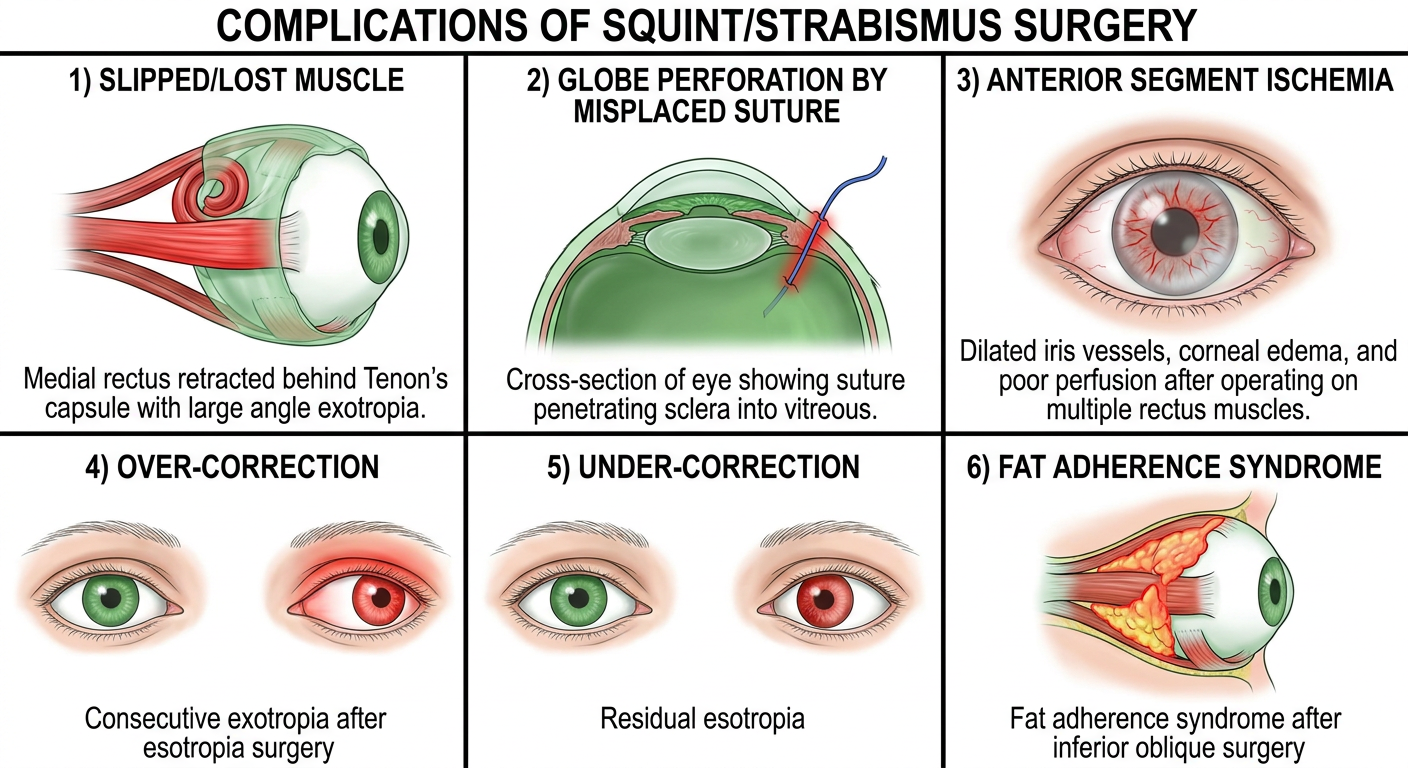
A. INTRAOPERATIVE COMPLICATIONS
1. LOST OR SLIPPED MUSCLE
- Immediate wide exploration of the quadrant
- Hemo-orbital dissection following the muscle's fascial sleeve posteriorly
- The muscle is found within Tenon's capsule using a "muscle-retrieval hook"
- If not found intraoperatively, imaging (MRI orbit) is needed postoperatively
- Never allow the muscle to be freed unless sutures are securely placed and held
- Use locking sutures (Supramid) in cases with friable muscles
- Partial tenotomy rather than full disinsertion in high myopes
2. SCLERAL PERFORATION
- High myopia (thin sclera, posterior staphyloma)
- Re-operations (distorted anatomy, fibrosis)
- Oblique muscle surgery (curved scleral surface)
- Vitreous hemorrhage
- Retinal detachment (if subretinal fluid dissects under retina)
- Endophthalmitis (extremely rare)
- Choroidal hemorrhage
- If perforation recognized: cryotherapy or laser photocoagulation to the perforation site
- Refer to vitreoretinal surgeon if vitreous hemorrhage or retinal tear evident
- Prophylactic cryotherapy at perforation site recommended
- Partial thickness bites (avoid full-thickness needling in thin sclera)
- Spatulated needles reduce perforation risk
- Use of ultrasonography preoperatively to assess scleral thickness in high myopes
- Hang-back sutures in high myopia (muscle hangs back from insertion - no direct scleral bite at new site)
3. FAT ADHERENCE SYNDROME (ORBITAL FAT PROLAPSE)
- Restrictive motility limitation due to fat fibrosis tethering the globe
- Diplopia in lateral and vertical gaze
- May mimic a recurrent strabismus
- Careful identification and isolation of IO muscle without posterior capsule disruption
- Avoid excessive traction or posterior dissection
- Use of Westcott scissors rather than sharp dissection near the IO
4. HEMORRHAGE
- Subconjunctival, intermuscular, or retrobulbar hemorrhage
- Arterial bleeding from anterior ciliary arteries during muscle disinsertion
- Usually self-limiting; direct pressure with wet swab
- Retrobulbar hemorrhage: rare, may require orbital decompression if pressure rises
5. WRONG MUSCLE / WRONG EYE
- Always verify the correct eye and muscle on the surgical side-marker
- Never operate without prior prism cover test measurements confirmed on the day
B. EARLY POSTOPERATIVE COMPLICATIONS
1. OVERCORRECTION AND UNDERCORRECTION
- Undercorrection: Residual deviation in the original direction
- Overcorrection: Deviation reversed (e.g., consecutive exotropia after esotropia surgery)
- Both require observation for 6-8 weeks to allow stabilization
- If persistent, re-operation may be needed
- Botulinum toxin injection is an alternative for small-angle residuals (2-8 weeks postoperatively)
- Prism therapy may be helpful temporarily
2. INFECTION
- Conjunctivitis is common (3-7 days); treat with topical antibiotics
- Orbital cellulitis: rare, presents with proptosis, pain, and fever; requires urgent IV antibiotics
- Endophthalmitis: very rare, associated with globe perforation; potentially sight-threatening
3. CONJUNCTIVAL GRANULOMA (SUTURE GRANULOMA)
- Foreign body reaction to absorbable suture material (Vicryl)
- Presents as pink nodule at surgical site at 2-6 weeks
- Treatment: topical steroids, surgical excision if persistent
- More common with catgut sutures (now rarely used)
4. DELLEN
- Local corneal thinning adjacent to an elevated conjunctival mound (post-fornix incision elevation)
- Usually resolves with lubricating eye drops
- Prevent by meticulous conjunctival closure
5. DIPLOPIA
- Expected in adults postoperatively if suppression is broken
- Pre-assess with prism diplopia test or Botox test to screen for troublesome diplopia
- Transient diplopia is usual; persistent diplopia needs prism or further surgery
- Kanski warning: In adult with consecutive divergent squint and left suppression, straightening may make suppression less effective, causing diplopia.
C. LATE POSTOPERATIVE COMPLICATIONS
1. ANTERIOR SEGMENT ISCHEMIA (ASI)
- Elderly patients
- Systemic vascular disease (atherosclerosis, diabetes, sickle cell disease)
- Surgery on 3 or more rectus muscles of one eye simultaneously
- Previous surgery on same eye
- Severe pain and photophobia
- Corneal edema and Descemet's folds
- Anterior chamber flare and cells
- Dilated, irregular, poorly reactive pupil
- Iris ischemia and segmental iris atrophy
- In severe cases: hypotony, phthisis bulbi
- Systemic and topical steroids
- Cycloplegics for comfort
- No further muscle surgery
- Supportive - usually partial recovery; prognosis guarded
"This complication can be avoided by not removing more than two rectus muscles of one eye at one time."
- Staged surgery when >2 muscles need surgery on same eye
- Plication instead of resection (plication preserves ACAs)
- Anterior segment fluorescein angiography can assess ACA circulation intraoperatively
2. STRETCHED SCAR / CONSECUTIVE DEVIATION
- A stretched scar at the reattachment site may develop years after initial surgery
- Causes gradual forward slippage of the muscle
- Results in functional undercorrection - increasing deviation over time
- Requires re-exploration and resection/advancement of the recessed muscle
3. INDUCED REFRACTIVE CHANGES
- Temporary astigmatism (due to scleral suturing) resolves in most cases by 4-6 weeks
- Permanent astigmatic changes are uncommon with modern techniques
4. PERSISTENT RESTRICTIVE MOTILITY DEFECT
- Due to scarring between Tenon's capsule and muscle (especially after multiple surgeries)
- Fat adherence syndrome
- Fibrosis post-inferior oblique surgery
PART VIII: SUMMARY TABLE OF COMPLICATIONS
| Complication | Timing | Key Feature | Prevention |
|---|---|---|---|
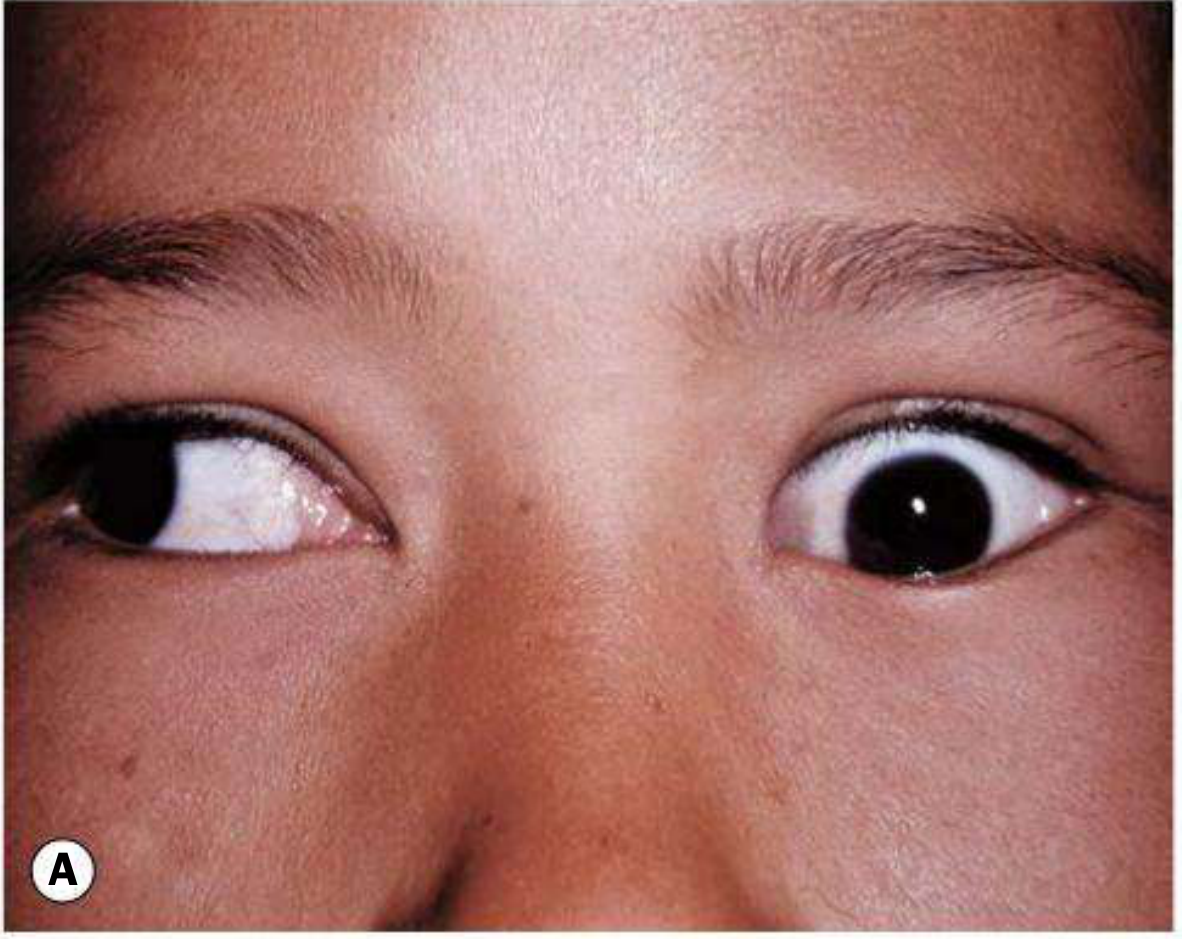
| Lost/slipped muscle | Intraop | Large exotropia (if MR lost), absent adduction | Secure sutures before disinsertion |
| Scleral perforation | Intraop | Vitreous blood, retinal tear | Partial-thickness bites; hang-back in myopes |
| Fat adherence syndrome | Intraop/Early | Restrictive motility limitation | Careful IO surgery; avoid posterior capsule breach |
| Hemorrhage | Intraop | Usually self-limiting | Careful dissection |
| Overcorrection | Early/Late | Reversed deviation | Accurate dosimetry; adjustable sutures |
| Undercorrection | Early/Late | Residual deviation | Adjustable sutures; good dosimetry |
| Infection / granuloma | Early | Conjunctival nodule | Proper suture technique |
| Diplopia | Early/Late | Binocular double vision | Preop diplopia testing |
| ASI | Early | Corneal edema, iris ischemia, pain | Max 2 rectus muscles per session |
| Stretched scar | Late | Slowly increasing deviation years later | Secure, well-placed suturing |
PART IX: SPECIAL SITUATIONS
Surgery in High Myopia (Strabismus Fixus)
- Extreme esotropia with fibrotic MR and severe limitation of abduction
- Sclera is thin; high risk of scleral perforation and "pulled-in-two" syndrome
- Use hang-back sutures, consider Jensen's or Hummelsheim transposition procedure
- Loop myopexy (Yokoyama procedure): SR and LR are joined laterally to form a loop supporting the globe
Surgery in Thyroid Eye Disease
- Operate only when disease stable for 6 months and measurements stable for 3 months
- IR recession most common (hypotropia due to fibrotic IR)
- MR recession for esotropia
- Adjustable sutures mandatory (restrictive myopathy - very unpredictable)
- Risk of ASI is high due to ischemic changes in muscles
Re-Operations
- Scarring and fibrosis make surgery more difficult
- Risk of lost muscle and perforation higher
- Use limbal incision for better exposure
- Adjustable sutures particularly valuable
PART X: POSTOPERATIVE CARE
- Topical antibiotics and steroids for 3-4 weeks (e.g., tobramycin-dexamethasone combination)
- Cycloplegic if ASI suspected or for comfort
- Review at 1 week, then 6-8 weeks to assess final alignment
- Amblyopia management continues postoperatively
- Prism for temporary diplopia
- Spectacle prescription updated after healing (to manage residual accommodative element)
CONCLUSION
- Kanski's Clinical Ophthalmology, 10th Edition - Brad Bowling, Chapter 18, pp. 760-770
- Khurana AK - Comprehensive Ophthalmology, Chapter on Squint
- Von Noorden GK, Campos EC - Binocular Vision and Ocular Motility, 6th Edition, Chapter on Surgical Treatment
- Rosenbaum AL, Santiago AP - Clinical Strabismus Management, Chapter on Surgical Techniques and Complications
- Parks MM - Surgical Management of Strabismus (dosage tables)
- Jampolsky A - Adjustable suture strabismus surgery
LOCS grading for cataract Take references from kanski ,AK khurana of lens ,othe standard textbook for pg ophthalmology
LOCS grading cataract lens opacity classification system slit lamp
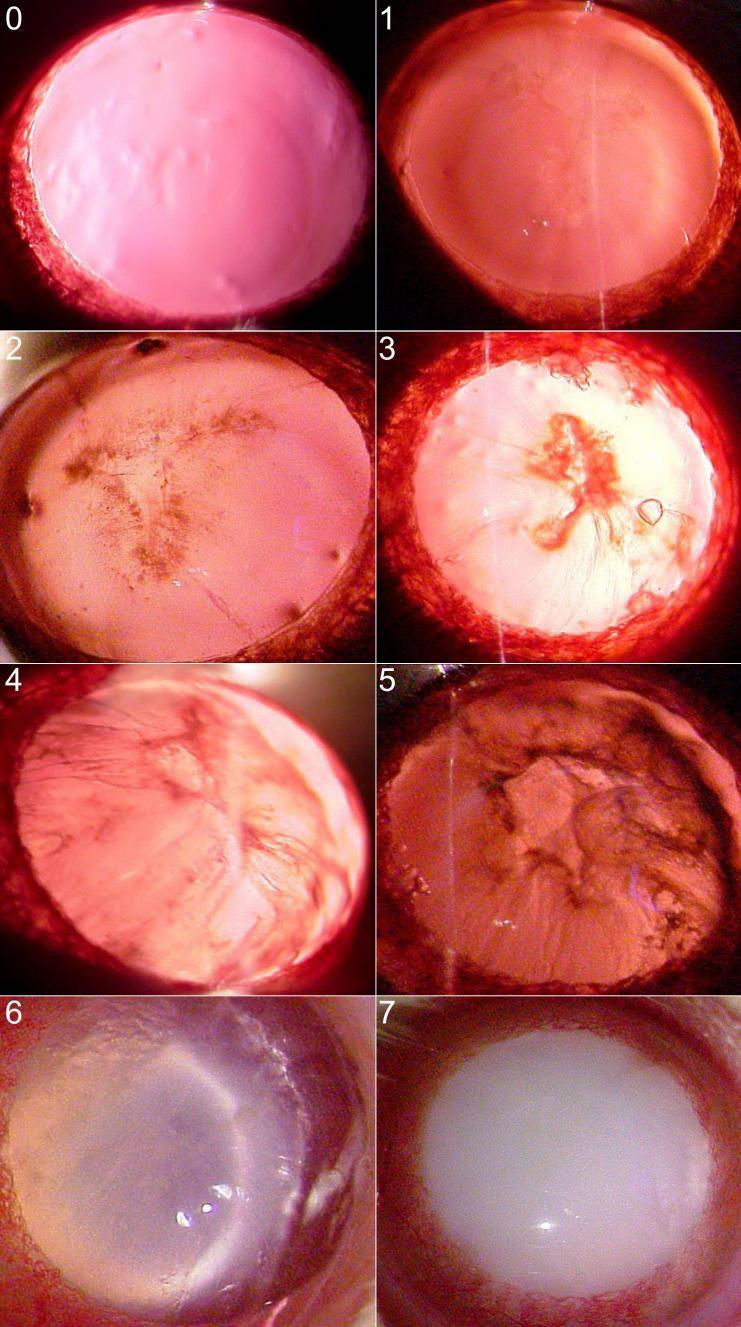
This composite of eight slit-lamp biomicroscopy clinical photographs illustrates the progression and grading of nuclear cataracts using the Oxford clinical grading system, ranging from Grade 0 to Grade 7. The images demonstrate the transformation of the crystalline lens from total transparency to complete opacification. Grade 0 shows a clear lens with a red reflex. Early stages (Grades 1–2) exhibit subtle nuclear density and visible wide sutures. Intermediate stages (Grades 3–5) show increasing nuclear densification and the formation of distinct cortical or nuclear clefts. Advanced stages (Grades 6–7) feature dense radial opacities and progress to a mature cataract characterized by total whole-lens opacification, which completely obscures internal structures and the posterior red reflex. This visual series is an educational tool for ophthalmology and optometry to standardize the assessment of lenticular opacity and cataract severity in clinical practice.
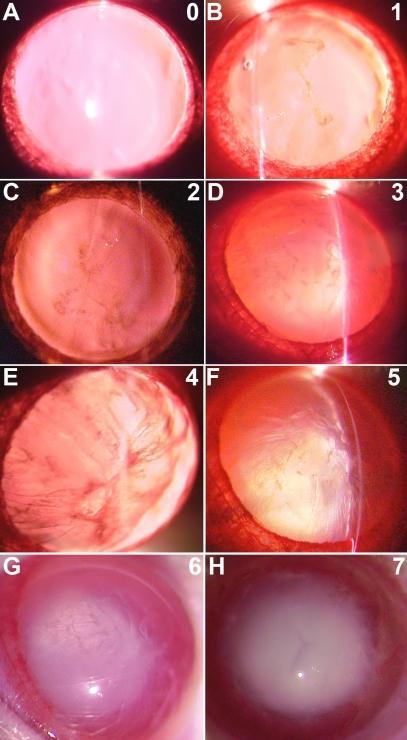
A series of eight clinical slit-lamp photographs (labeled A-H and graded 0-7) demonstrating the progression of cataract formation in a diabetic model, categorized according to the Oxford grading system. The images illustrate the transition from a clear lens (Grade 0) to total lenticular opacity (Grade 7). Key pathological landmarks include widening of the lens sutures (Grade 1), the emergence of radiating opacities from the sutures (Grade 2), and the development of a dense nucleus (Grade 3). More advanced stages demonstrate the formation of cortical clefts (Grades 4-5) and dense radial opacification (Grade 6). The final stage (Grade 7) depicts a mature, opaque nuclear cataract involving the entire lens volume. This comparison chart is used in ophthalmology to study the pathophysiology of diabetic cataracts and to evaluate the efficacy of therapeutic interventions on lens clarity. The visual sequence emphasizes diagnostic features such as nuclear density, suture morphology, and the structural integrity of the lens fibers.
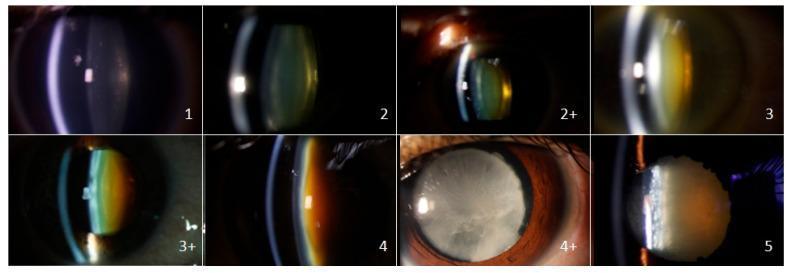
This set of eight slit-lamp clinical photographs demonstrates the Standard Pre-Operative Nuclear Classification System (SPONCS) for grading nuclear cataracts. The images, taken at a 45-degree angle, show the progression of lens opacification and nuclear color changes. Grade 1 shows a relatively clear lens with a faint bluish-white tint and visible cortical layers. As the severity progresses through grades 2, 2+, 3, and 3+, the lens nucleus undergoes a chromatic transition from mild yellowing to deep amber and orange. By grades 4 and 4+, the nucleus exhibits pronounced yellow-brown discoloration with significant cloudiness. Grade 5 represents an advanced brunescent cataract with a dark brown, opaque nucleus. The slit-lamp beam reflection simultaneously evolves from a sharp, well-defined section in lower grades to a highly scattered, diffuse reflection in higher grades, reflecting increased lens density and light scattering. This visual scale serves as a standardized tool for ophthalmologists to assess cataract maturity and plan surgical intervention, specifically correlating with cumulative dissipated energy (CDE) during phacoemulsification.
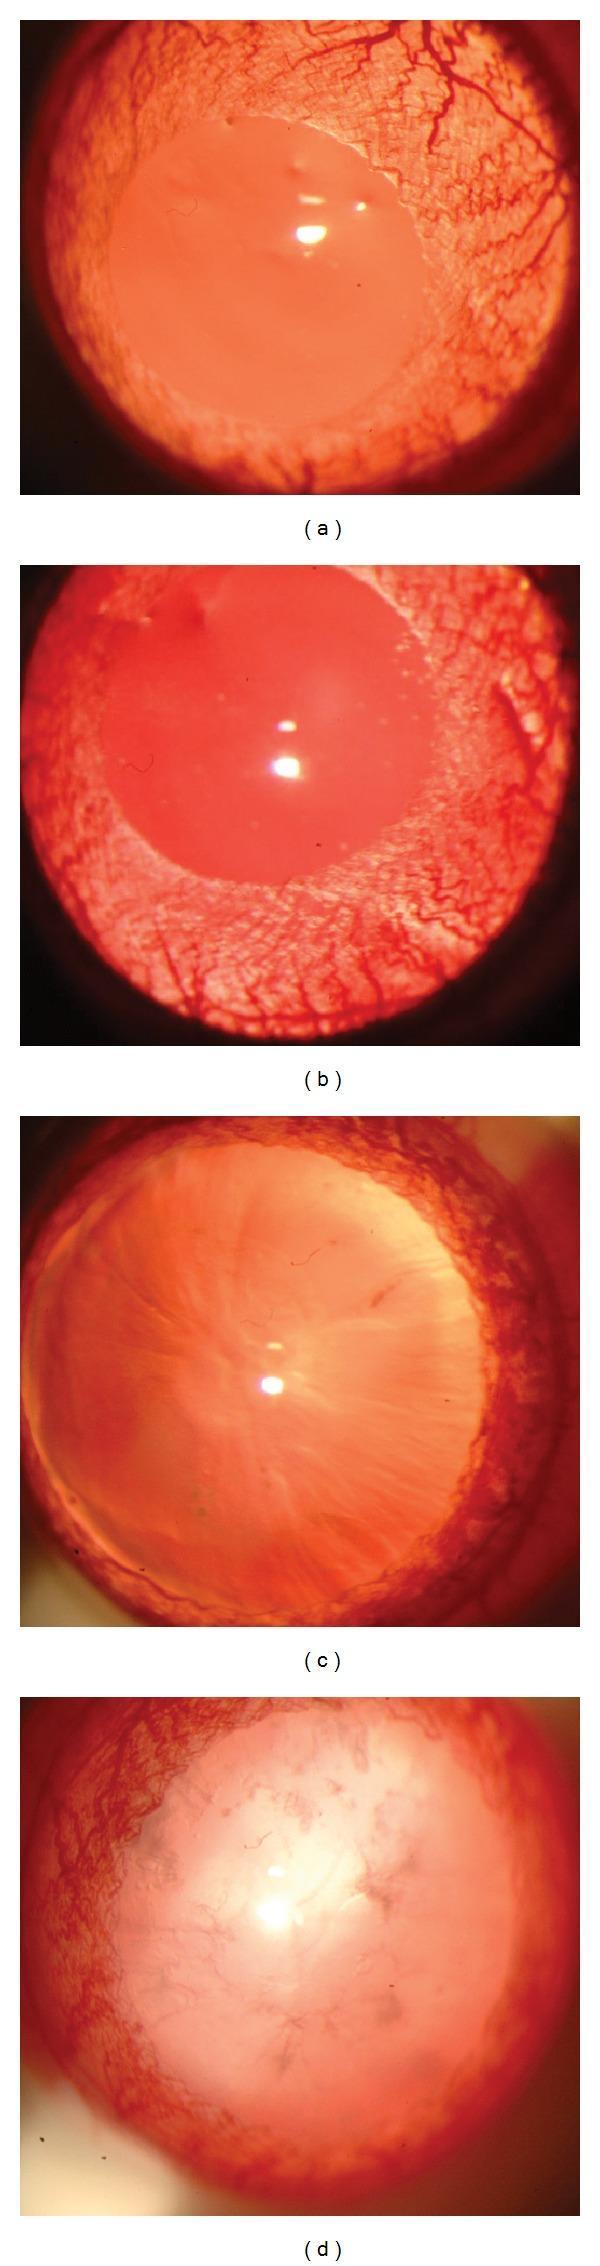
This set of clinical photographs presents a side-by-side comparison of crystalline lenses using slit-lamp biomicroscopy to illustrate cataract progression in various experimental conditions. The series is divided into four panels: (a) Control, (b) Nicotine-treated, (c) Diabetic, and (d) Nicotine-treated diabetic. Panels (a) and (b) demonstrate normal lens clarity with high transparency and an absence of opacification, categorized as Grade 0 on the Oxford classification system. In contrast, panel (c) shows the early stages of diabetic cataract, characterized by mild nuclear opacity and increasingly prominent lens sutures. Panel (d) displays advanced pathological changes in the nicotine-treated diabetic subject, featuring significant and dense nuclear opacification that obscures internal lens structures and causes scattered light reflection. These images serve as educational visual aids for understanding the pathophysiology of cataracts, specifically highlighting how metabolic stressors like diabetes, potentially exacerbated by nicotine, accelerate lens opacification and alter lens morphology.
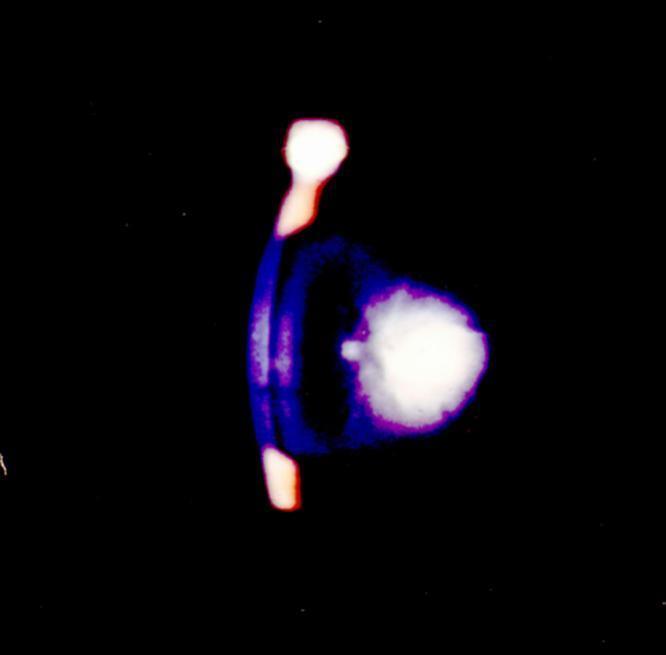
This clinical photograph displays a level 4 cataract, captured via slit-lamp biomicroscopy. The image demonstrates advanced lenticular opacification characterized by a central, highly dense white core exhibiting complete light reflection and opalescence. This central opacity is surrounded by a diffuse, purple-blue opacified region that involves the entire lens structure. The high-grade density is indicative of advanced protein aggregation and light scattering within the lens cortex and nucleus. This visual representation serves as a classic educational example of radiation-induced cataractogenesis, where a rapid progression from minimal opacity (grade 1.5+) to total opacification (grade 4.0) occurs within a clinical observation period. The dark, featureless background contrasts with the bright, reflective cataractous lens, highlighting the loss of transparency. This material is significant for ophthalmology students and residents studying the grading scales of cataracts and the ocular manifestations of ionizing radiation exposure.
This slit-lamp clinical photograph illustrates a case of anterior capsule contraction syndrome (ACCS), specifically presenting as anterior capsule phimosis. The image captures a highly dense, whitish fibrotic opacity of the anterior lens capsule following cataract surgery. The fibrosis is centrally located and significantly involves the visual axis within the pupillary aperture. The slit beam highlights the irregular thickness and distorted morphology of the fibrotic tissue, which has formed a restrictive ring or membrane over the anterior surface of the intraocular lens (IOL). This condition is a known late complication of phacoemulsification, where metaplasia of residual lens epithelial cells leads to myofibroblast differentiation and capsular shrinkage. The clinical significance of this finding is the severe reduction in visual acuity due to central pupillary obstruction and the potential for IOL decentration or zonular stress if left untreated.
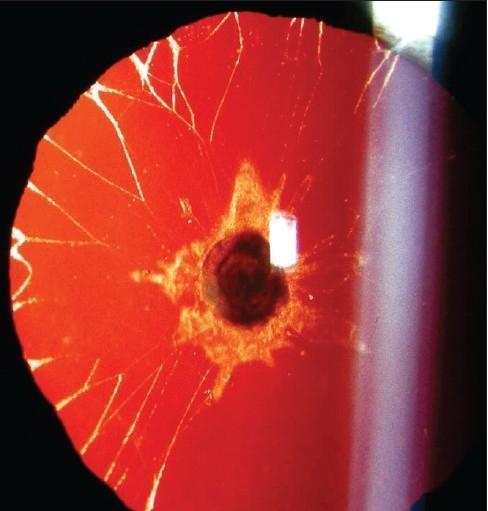
This slit-lamp photograph shows the anterior segment of a human eye using retroillumination through a dilated pupil. The image demonstrates a congenital lens opacity, specifically a plaque-like anterior polar cataract. Centrally, there is a dense, dark axial opacity surrounded by a fuzzy, irregular, whitish halo. Radiating from this central lesion toward the lens periphery are multiple fine, linear, whitish lines resembling a spiderweb or 'cracked' pattern, which are characteristic of persistent pupillary membrane remnants or epicapsular stars. The red reflex in the background provides high contrast, highlighting the morphology and distribution of these opacities. This visual illustrates clinical signs often associated with embryological developmental abnormalities of the lens vesicle or pupillary membrane regression, relevant in pediatric ophthalmology for diagnosing infantile cataracts and associated anterior segment dysgenesis.
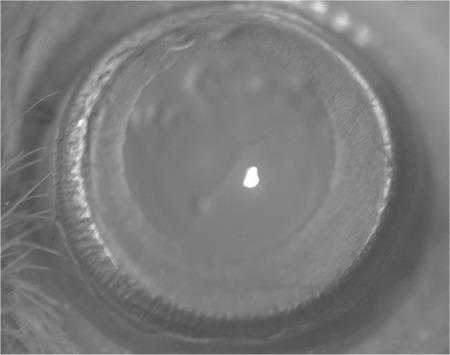
This monochrome clinical photograph, captured via slit-lamp microscopy at 25x magnification, illustrates a Stage 1 cataract. The image focuses on the anterior segment of the eye, showcasing the lens through a dilated pupil. Morphologically, the lens demonstrates initial pathological changes, specifically characterized by a subtle cloudiness or haziness in the posterior subcapsular region and minimal nuclear opacity. The anterior aspect of the lens remains relatively clear. Surrounding the crystalline lens, the iris is visible with a distinct circular border and textured surface. Peripheral eyelashes are partially visible at the left margin. This image serves as an educational reference for early-stage cataract classification, demonstrating the subtle loss of lens transparency and the specific anatomical localization of early opacification typical in sodium selenite-induced models, relevant for ophthalmology and toxicology research.
LOCS III lens opacity classification system nuclear cortical posterior subcapsular grading scale reference photographs
This composite of eight slit-lamp biomicroscopy clinical photographs illustrates the progression and grading of nuclear cataracts using the Oxford clinical grading system, ranging from Grade 0 to Grade 7. The images demonstrate the transformation of the crystalline lens from total transparency to complete opacification. Grade 0 shows a clear lens with a red reflex. Early stages (Grades 1–2) exhibit subtle nuclear density and visible wide sutures. Intermediate stages (Grades 3–5) show increasing nuclear densification and the formation of distinct cortical or nuclear clefts. Advanced stages (Grades 6–7) feature dense radial opacities and progress to a mature cataract characterized by total whole-lens opacification, which completely obscures internal structures and the posterior red reflex. This visual series is an educational tool for ophthalmology and optometry to standardize the assessment of lenticular opacity and cataract severity in clinical practice.
This set of eight slit-lamp clinical photographs demonstrates the Standard Pre-Operative Nuclear Classification System (SPONCS) for grading nuclear cataracts. The images, taken at a 45-degree angle, show the progression of lens opacification and nuclear color changes. Grade 1 shows a relatively clear lens with a faint bluish-white tint and visible cortical layers. As the severity progresses through grades 2, 2+, 3, and 3+, the lens nucleus undergoes a chromatic transition from mild yellowing to deep amber and orange. By grades 4 and 4+, the nucleus exhibits pronounced yellow-brown discoloration with significant cloudiness. Grade 5 represents an advanced brunescent cataract with a dark brown, opaque nucleus. The slit-lamp beam reflection simultaneously evolves from a sharp, well-defined section in lower grades to a highly scattered, diffuse reflection in higher grades, reflecting increased lens density and light scattering. This visual scale serves as a standardized tool for ophthalmologists to assess cataract maturity and plan surgical intervention, specifically correlating with cumulative dissipated energy (CDE) during phacoemulsification.
A series of eight clinical slit-lamp photographs (labeled A-H and graded 0-7) demonstrating the progression of cataract formation in a diabetic model, categorized according to the Oxford grading system. The images illustrate the transition from a clear lens (Grade 0) to total lenticular opacity (Grade 7). Key pathological landmarks include widening of the lens sutures (Grade 1), the emergence of radiating opacities from the sutures (Grade 2), and the development of a dense nucleus (Grade 3). More advanced stages demonstrate the formation of cortical clefts (Grades 4-5) and dense radial opacification (Grade 6). The final stage (Grade 7) depicts a mature, opaque nuclear cataract involving the entire lens volume. This comparison chart is used in ophthalmology to study the pathophysiology of diabetic cataracts and to evaluate the efficacy of therapeutic interventions on lens clarity. The visual sequence emphasizes diagnostic features such as nuclear density, suture morphology, and the structural integrity of the lens fibers.
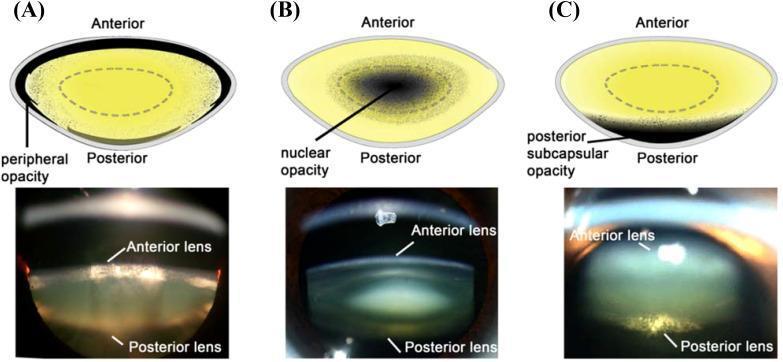
Educational comparison of cataract types featuring schematic diagrams (top row) and Scheimpflug slit-lamp photographic images (bottom row) classified into three categories: (A) Cortical cataract, (B) Nuclear cataract, and (C) Posterior subcapsular cataract. In the cortical cataract section, the diagram highlights 'peripheral opacity' along the outer lens cortex, mirrored in the slit-lamp image by granular light-scattering in the peripheral layers. The nuclear cataract section demonstrates 'nuclear opacity' concentrated in the central core of the crystalline lens, appearing as a dense, dark focal point in both the illustration and the photographic cross-section. The posterior subcapsular cataract section depicts 'posterior subcapsular opacity' localized just beneath the posterior lens capsule, shown as a distinct white plaque-like reflection at the back of the lens in the clinical image. Each image is annotated with 'Anterior' and 'Posterior' landmarks to orient the observer to the lens anatomy and the depth of the opacification. This visual material is used to teach diagnostic ophthalmology and the pathophysiology of age-related and metabolic lens changes.
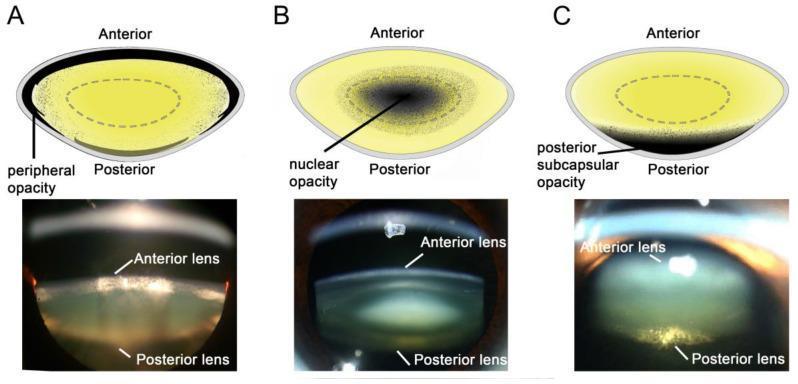
Educational comparison of the three primary types of human cataracts, presented via schematic diagrams (top) and corresponding Scheimpflug slit-lamp photographic images (bottom). The visual is organized into three panels: (A) Cortical cataract, showing characteristic wedge-shaped or peripheral opacities that originate at the lens equator and extend toward the center, often associated with diabetic osmotic stress. (B) Nuclear cataract, demonstrating central densification and opacification within the lens nucleus, typically linked to age-related oxidative protein damage. (C) Posterior subcapsular cataract (PSC), illustrating a localized plaque-like opacity at the posterior pole of the lens just beneath the capsule, frequently associated with corticosteroid use or diabetes. Each schematic identifies the anterior and posterior orientations and highlights the specific zone of lens clouding. The clinical photographs provide a cross-sectional view of the lens, with labels indicating the anterior and posterior lens surfaces, allowing for visualization of the depth and distribution of light scattering within the crystalline lens structure.
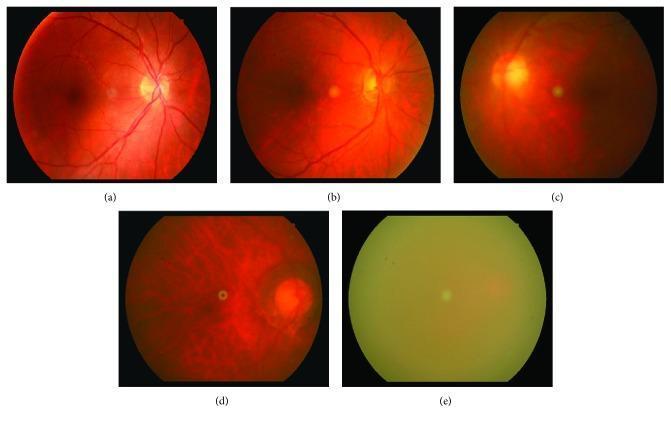
This clinical comparison chart presents five fundus photographs (labeled a–e) demonstrating a progressive grading scale (0–4) for retinal image blurriness, typically caused by lens opacities like cataracts. - Grade 0 (a): Represents a clear, healthy retina. The optic disc is sharply defined, and both primary retinal vessels and fine capillary networks are clearly visible with high contrast against the fundus. - Grade 1 (b): Shows mild blurriness where primary vessels remain visible, but distal capillary vessels become faint. - Grade 2 (c): Moderate blurriness results in the loss of small vessels, leaving only primary vessels faintly detectable. - Grade 3 (d): Severe blurriness where the optic disc and peripapillary vessels are only indistinctly visible; anatomical details are significantly obscured. - Grade 4 (e): Total loss of retinal detail; no anatomical structures are discernible due to dense opacity. This sequence illustrates the clinical challenge of imaging the posterior segment in cataract patients, serving as a reference for diagnostic grading and determining the necessity of surgical intervention based on image quality degradation.
Medical educational diagram: LOCS III (Lens Opacities Classification System III) grading chart for cataract. Show three rows: Row 1 - NUCLEAR OPALESCENCE (NO) and NUCLEAR COLOR (NC): 6 lens cross-sections side by side labeled NO1/NC1 through NO6/NC6. Colors progress from clear (NO1) → faint yellow (NO2) → yellow (NO3) → amber (NO4) → brown (NO5) → dark brown/black (NO6). Each shows slit-lamp beam optical section style. Row 2 - CORTICAL CATARACT (C): 6 retroillumination-style lens diagrams labeled C0.1 through C5. Show increasing wedge-shaped peripheral spokes from none (C0.1) to complete cortical opacity (C5). Row 3 - POSTERIOR SUBCAPSULAR (P): 5 retroillumination lens diagrams labeled P0.1 through P4. Show central posterior plaques increasing in size and density. Include color scale bar, axis labels, title 'LOCS III Grading System (Chylack et al. 1993)'. Clean medical illustration on white background with colored annotations.
Medical diagram comparing all major cataract grading systems in a comparison table format. Four grading systems shown as horizontal rows: 1. LOCS III (Chylack 1993): Nuclear Opalescence NO1-NO6, Cortical C0-C5, PSC P0-P4 with decimal scoring 2. Oxford Grading System: Grade 0 (clear) to Grade 5 with visual analog scale 3. Wilmer System: 0-4+ for nuclear, cortical and PSC 4. Wisconsin System: nuclear color and opalescence 0-4 Show color-coded progression bars from clear/green to opaque/red for each system. Include key features of each system. Title: 'Comparison of Cataract Grading Systems'. Clean, colorful medical infographic style on white background.
Detailed medical illustration of the crystalline lens anatomy for cataract grading. Cross-sectional view showing: anterior capsule, anterior subcapsular epithelium, anterior cortex, fetal nucleus, embryonic nucleus, adult nucleus, posterior cortex, posterior subcapsular zone, posterior capsule. Color coded zones: nucleus in amber/yellow, cortex in light yellow, capsule in thin blue, subcapsular zones in light green. Show three superimposed colored outlines indicating the zones graded in LOCS III: orange circle = nuclear zone (central 4mm), blue wedges = cortical zone (peripheral), red dot at posterior pole = PSC zone. Labels and arrows clearly identifying each anatomical region. Title: 'Anatomy of Crystalline Lens - Zones for LOCS III Grading'. Clean medical illustration white background.
posterior subcapsular cataract retroillumination slit lamp grading
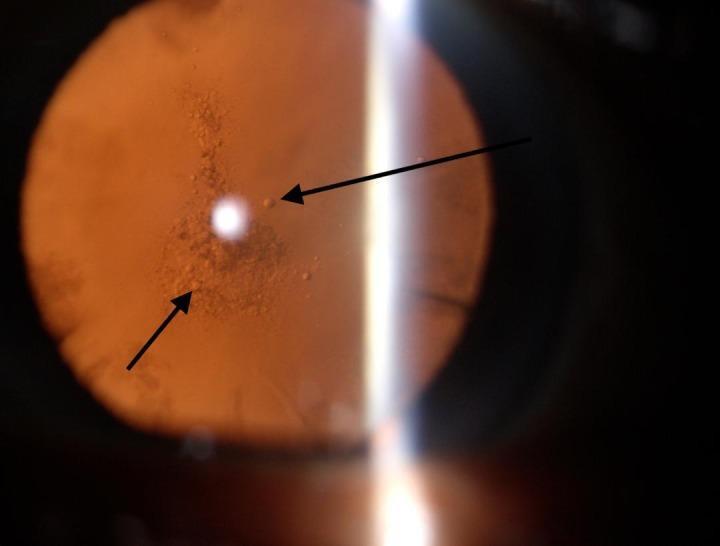
This clinical photograph displays a posterior subcapsular cataract (PSC) viewed under slit-lamp biomicroscopy. The image reveals a characteristic granular, 'pearl-like' opacification located in the posterior subcapsular region of the crystalline lens. Black arrows highlight these discrete, small, rounded opacities, which appear more concentrated centrally and toward the lower quadrant. The overall lens exhibits an amber-to-light-brown hue, suggestive of co-existing nuclear sclerosis. A vertical light reflex from the slit-lamp source is visible on the right side of the frame, providing retroillumination that accentuates the hazy, plaque-like distribution of the cataract. This finding is highly relevant in ophthalmology for diagnosing vision impairment related to posterior lens pathology, often associated with prolonged corticosteroid use, diabetes, or ionizing radiation exposure. The image demonstrates the visual obstruction and light scattering caused by these subcapsular changes.
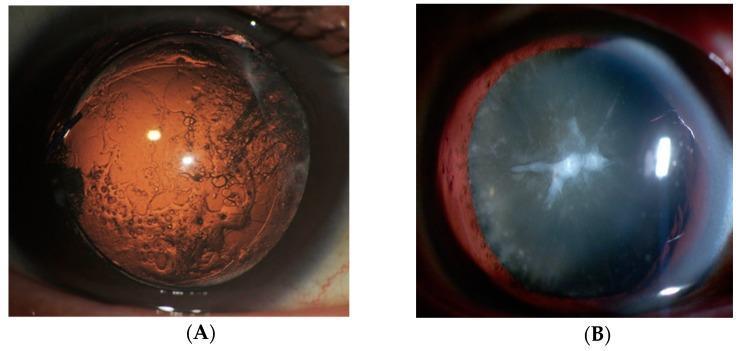
Two slit-lamp clinical photographs showing different forms of lens opacification and fibrosis. Figure A is a retroillumination image demonstrating Posterior Capsular Opacification (PCO), a common post-cataract surgery complication. The lens capsule displays diffuse brownish discoloration and a characteristic textured appearance consisting of irregular dark patches, branching patterns, and small circular clusters (Elschnig pearls) indicative of aberrant lens epithelial cell (LEC) migration and proliferation. Figure B illustrates an anterior subcapsular cataract with anterior subcapsular fibrosis (ASF). The image reveals a prominent, bright white, star-like (stellate) central opacity at the anterior pole of the lens, surrounded by a more diffuse, grayish-white opacity. This fibrotic plaque is the result of epithelial-mesenchymal transition (EMT) of LECs into myofibroblastic cells. Both images highlight pathological consequences of LEC dysfunction and fibrosis in ophthalmology.
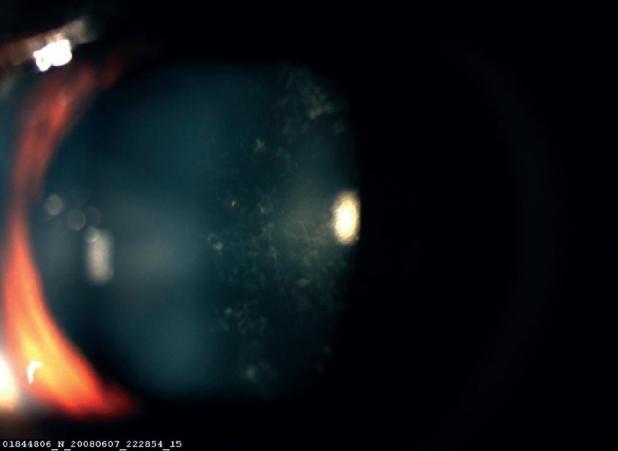
This clinical photograph displays a slit-lamp examination of a human eye, specifically focusing on the crystalline lens. The image demonstrates a posterior subcapsular cataract (PSC) characterized by granular, plaque-like opacities located in the posterior cortex of the lens, just internal to the posterior capsule. The opacities exhibit a breadcrumb or cloud-like morphology, clustered primarily in the central visual axis. A prominent light reflex is visible on the iris and anterior chamber on the left side of the frame, indicating the illumination source, while a bright, focal reflection is seen over the central opacified area of the lens. The periphery of the lens remains relatively clear compared to the densely opacified central posterior region. This finding is clinically significant as PSCs typically cause significant glare and disproportionate vision loss under bright light conditions. In this specific clinical context, the cataract is associated with ocular trauma following a lightning strike.
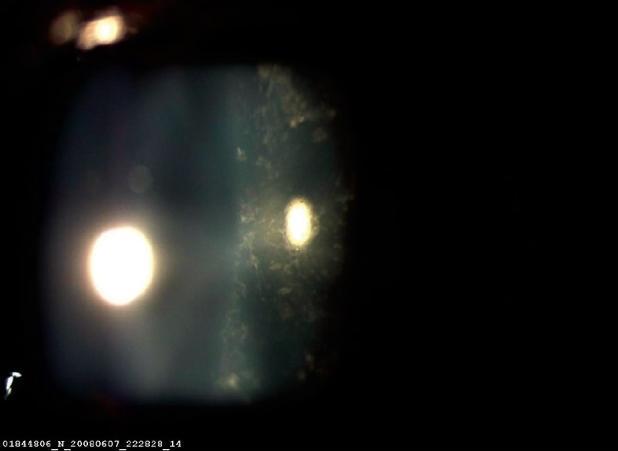
This clinical photograph displays a slit-lamp examination of the eye, specifically focusing on a posterior subcapsular cataract. The central and posterior regions of the lens exhibit granular, irregular, and diffuse opacities scattered throughout the subcapsular region. These opacities are highlighted by two primary light reflexes: a large, bright circular reflex on the nasal side and a more focused, intense reflex on the temporal side. The pathology appears as multiple scattering centers within the lens material, creating a mottled or snowflake-like texture that disrupts light transmission along the visual axis. This finding is characteristic of a posterior subcapsular cataract, which in this clinical context is associated with lightning strike trauma (electric cataract). The visual demonstrates how the pathology reduces lens clarity and interferes with light entry, providing an educational example of traumatic lens injury and secondary cataract formation.
LOCS GRADING FOR CATARACT
Postgraduate Theory Answer
INTRODUCTION
- Epidemiological studies of cataract prevalence and incidence
- Clinical trials evaluating anti-cataract drugs or surgical outcomes
- Tracking natural history and progression
- Determining timing and indication for surgery
- Correlating visual function with morphological changes
"The morphological classification of cataract provides the basis for epidemiological studies and for monitoring disease progression." - Kanski's Clinical Ophthalmology, 10th Ed.
PART I: TYPES OF CATARACT - MORPHOLOGICAL BASIS FOR GRADING
1. Nuclear Cataract
- Opacity centered in the embryonic, fetal and adult nucleus (central zone)
- Assessed by slit-lamp optical section (direct focal illumination)
- Characterized by increasing opalescence (scattering of light) and nuclear color (yellowing → browning)
- Reduces distance vision more than near; causes myopic shift (index myopia)
- Associated with: aging, UV exposure, smoking, dehydration
2. Cortical Cataract
- Wedge-shaped or spoke-like opacities in the cortical zone (peripheral lens)
- Assessed by retroillumination - opacities appear as dark spokes against red fundus reflex
- Begins at periphery, extends centripetally toward visual axis
- Associated with: UV radiation (strong association), diabetes, female sex
3. Posterior Subcapsular Cataract (PSC)
- Plaque-like opacity at the posterior pole, immediately anterior to posterior capsule
- Assessed by retroillumination - opacity appears as a central dark shadow
- Causes disproportionate visual disturbance - especially in bright light (glare), near vision loss (small pupil), poor contrast sensitivity
- Associated with: corticosteroid use (topical/systemic), diabetes, irradiation, trauma, uveitis, high myopia
PART II: ANATOMY OF THE CRYSTALLINE LENS - ZONES FOR GRADING
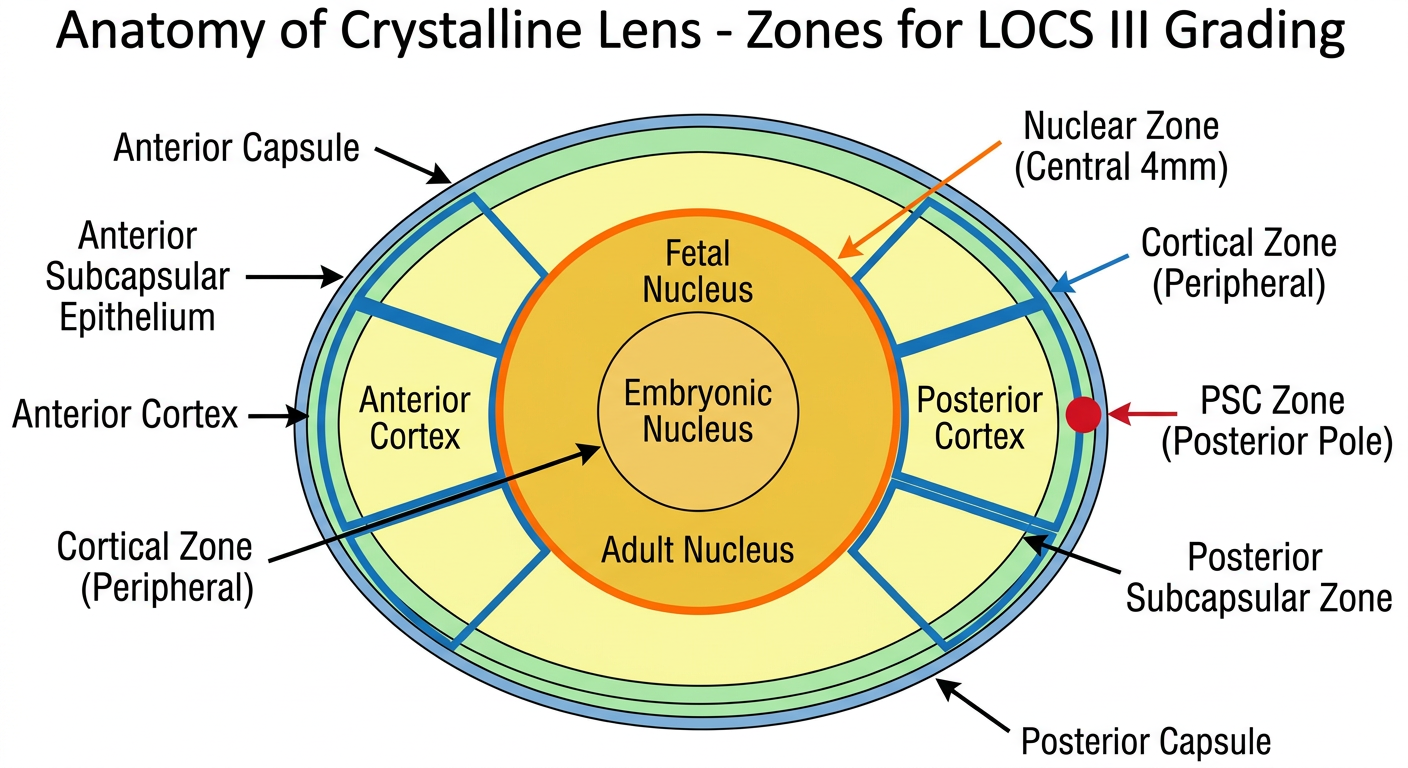
| Zone | Structure | LOCS III Parameter |
|---|---|---|
| Central ~4 mm | Nucleus (embryonic + fetal + adult) | NO (Nuclear Opalescence) + NC (Nuclear Color) |
| Peripheral cortex | Cortical fibers (anterior + posterior) | C (Cortical) |
| Posterior pole (central) | Posterior subcapsular region | P (PSC) |
PART III: EVOLUTION OF LOCS GRADING SYSTEMS
LOCS I (1988) - Chylack et al.
- First standardized photographic reference system
- Used 4 standard slit-lamp photographs for nuclear grading
- Graded nuclear opalescence: N1 to N4 (clear to brunescent)
- Graded nuclear color: NC1 to NC4
- Graded cortical and PSC: C1 to C4 and P1 to P4
- Used retroillumination photographs for cortical and PSC
- Limitation: coarse ordinal scale; only 4 grades; inadequate sensitivity to detect early change
LOCS II (1989) - Chylack et al.
- Expanded to include 6 standard photographs for nuclear grading
- Added photographic standards for cortical and PSC
- Still used ordinal (discrete) grading
- Limitation: Discrete grading - poor sensitivity for detecting small changes needed for clinical trials
LOCS III (1993) - Chylack et al. [The Gold Standard]
- Published in Ophthalmology (1993;100:116-1181)
- Expanded to a continuous decimal (ratio) scale
- Allows detection of subtle changes - ideal for clinical trials and drug studies
- Used in virtually all major cataract epidemiological studies worldwide
PART IV: LOCS III - DETAILED DESCRIPTION
Grading Parameters
| Parameter | Abbreviation | Scale | Assessment Method |
|---|---|---|---|
| Nuclear Opalescence | NO | 0.1 - 6.9 | Slit-lamp optical section |
| Nuclear Color | NC | 0.1 - 6.9 | Slit-lamp optical section |
| Cortical Opacity | C | 0.1 - 6.9 | Retroillumination |
| Posterior Subcapsular | P | 0.1 - 5.9 | Retroillumination |
Key principle: LOCS III uses a continuous decimal ratio scale, not discrete grades. The examiner matches the patient's lens to the closest standard photograph and can assign any decimal value between standard photographs (e.g., NO 2.3, C 1.7).
A. NUCLEAR GRADING (NO and NC)
| Grade | NO Description | NC Description | Clinical Correlation |
|---|---|---|---|
| NO1 / NC1 | Clear, transparent nucleus; no detectable opalescence | No color - water-clear | Normal young lens |
| NO2 / NC2 | Minimal opalescence; faint Tyndall effect just detectable | Faint yellow tint | Early nuclear sclerosis; usually asymptomatic |
| NO3 / NC3 | Mild opalescence; definite but still slight scattering | Yellow color evident | Mild nuclear cataract; mild blur especially distance |
| NO4 / NC4 | Moderate opalescence; clearly noticeable | Amber/deep yellow color | Moderate nuclear cataract; significant visual impairment |
| NO5 / NC5 | Marked opalescence; dense opaque nucleus | Orange-brown color | Advanced nuclear cataract (Brunescent cataract) |
| NO6 / NC6 | Extremely dense; complete opalescence | Very dark brown / black | Mature brunescent cataract (Black cataract) |
B. CORTICAL CATARACT GRADING (C)
| Grade | C Description | Area Involvement | Clinical Significance |
|---|---|---|---|
| C0.1 | Trace cortical opacity; barely detectable | < 1% lens area | Usually visually insignificant |
| C1 | Minimal cortical spokes | ~1-5% | Clinically insignificant |
| C2 | Peripheral spokes; not encroaching on visual axis | ~5-25% | Minimal symptoms |
| C3 | Moderate cortical opacity; beginning to approach axis | ~25-50% | May affect vision in bright light |
| C4 | Dense cortical opacity; involving visual axis | ~50-75% | Significant visual impairment |
| C5 | Complete cortical opacity (mature cortical cataract) | >75% | Severe visual impairment |
- Cuneiform: peripheral spokes - classic age-related cortical
- Cupuliform: central bowl-shaped - progresses faster, more visually significant
C. POSTERIOR SUBCAPSULAR GRADING (P)
| Grade | P Description | Clinical Feature |
|---|---|---|
| P0.1 | Trace PSC; barely detectable plaque | Asymptomatic |
| P1 | Small PSC plaque; < 1 mm diameter | Glare in bright sunlight; near vision affected |
| P2 | Moderate PSC; 1-2 mm, central | Significant glare; reading difficulty |
| P3 | Large PSC; 2-3 mm | Marked visual impairment; poor contrast sensitivity |
| P4 | Dense PSC; > 3 mm; involving most of visual axis | Severe visual impairment; disproportionate to grade |
| P5 | Complete PSC (maximum grade in LOCS III) | Disabling |
Clinical pearl: PSC has the most disproportionate visual impact relative to its size because it lies exactly at the posterior nodal point of the eye's optical system and is exacerbated by pupillary miosis (bright light, near vision).
PART V: LOCS III GRADING SYSTEM - ILLUSTRATED
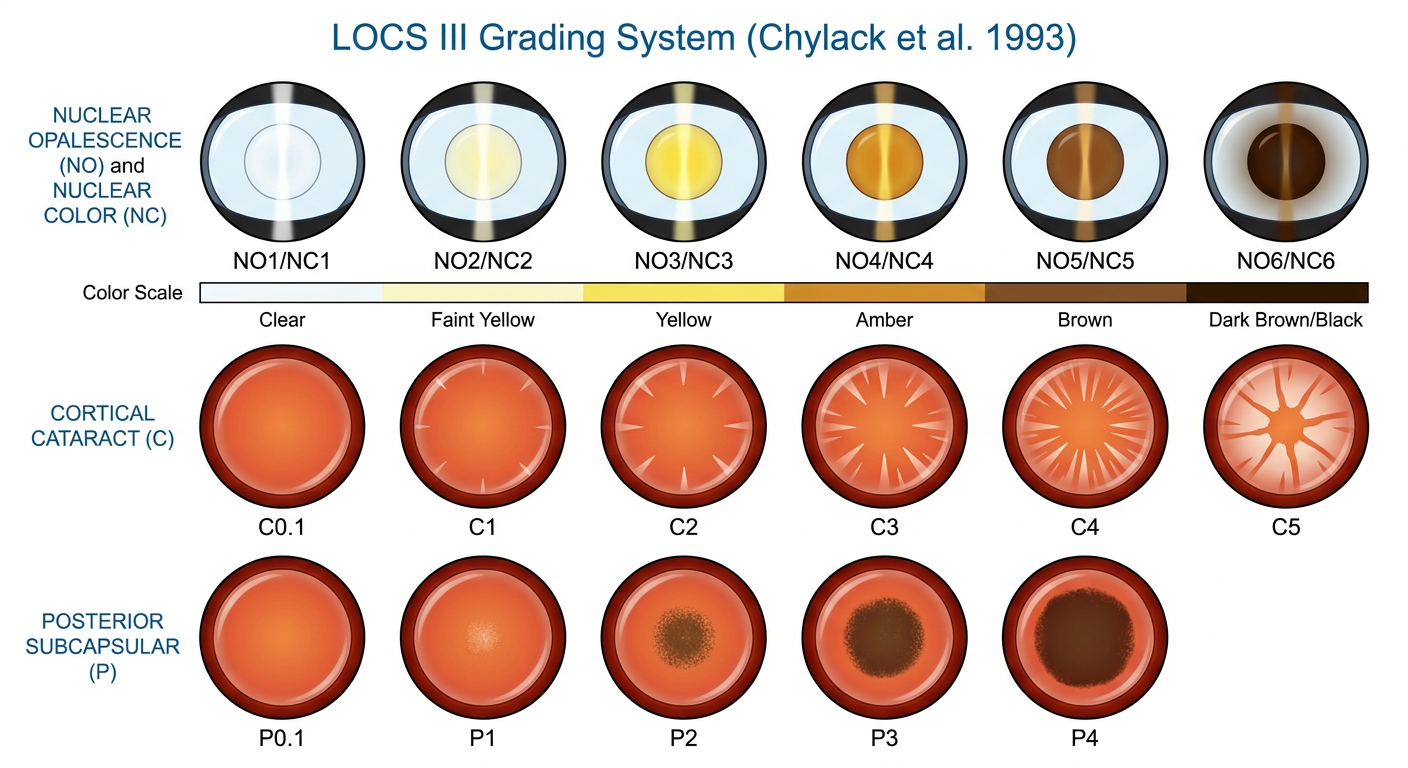
PART VI: TECHNIQUE OF LOCS III GRADING
Equipment Required
- Slit-lamp biomicroscope (Haag-Streit or equivalent)
- LOCS III standard reference photographs (original Chylack photographs or calibrated digital equivalents)
- Pupil dilation (tropicamide 1% + phenylephrine 2.5%) for cortical and PSC grading
Step-by-Step Protocol
- Set slit beam to maximum width, narrow slit height, medium-to-high magnification (16-25x)
- Place beam at 45° to the visual axis
- Illuminate through the dilated pupil
- Obtain a clear optical section of the nucleus
- Compare to reference photographs for NO (opalescence/milkiness) and NC (color/hue)
- Assign decimal value (e.g., NO = 2.3 means between standard photographs 2 and 3, closer to 2)
- Set slit-lamp to retroillumination mode (diffuse, coaxial illumination)
- Wide beam; low-to-medium magnification (6-16x)
- Identify dark spoke-like shadows in the peripheral cortex
- Estimate percentage of total lens area occupied by cortical opacity
- Compare to C reference photographs; assign decimal value
- Use retroillumination with coaxial illumination
- Low magnification (6-10x)
- Identify dark central shadow at posterior pole
- Estimate area in comparison to reference photographs
- Assign decimal P value
Recording Format
PART VII: COMPARISON WITH OTHER GRADING SYSTEMS
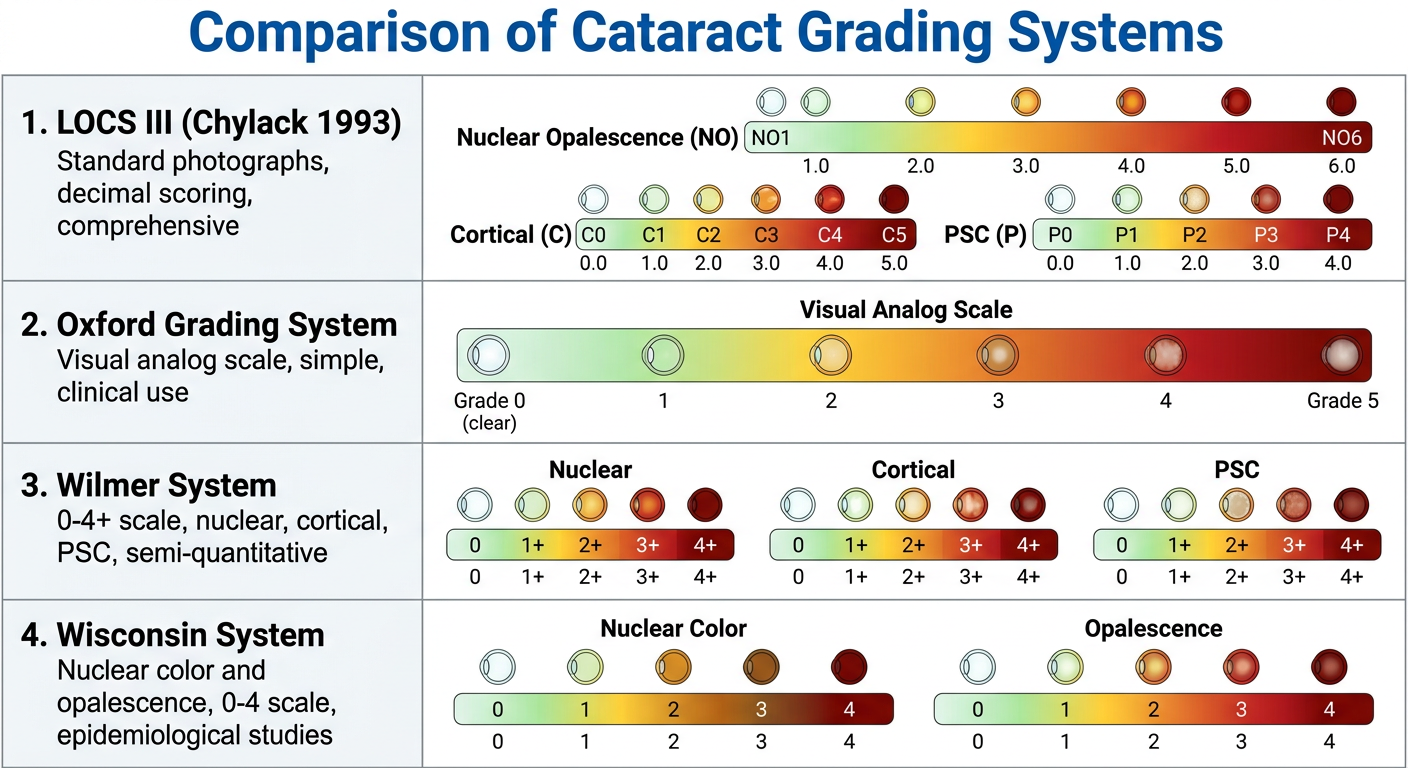
1. Wilmer System (Taylor & West, 1988)
- One of the earliest standardized systems
- Grades nuclear, cortical, and PSC opacities on a scale of 0 to 4+ (ordinal)
- Used in early epidemiological studies (Framingham Eye Study)
- Limitation: Ordinal, coarse, poor sensitivity
2. Oxford Clinical Grading System (OCGS)
- Visual analog scale (VAS) grading of nuclear color and opalescence
- Nuclear grades 0 to 5 (shown below)
- Also grades cortical and PSC 0-5
- Oxford grades correspond approximately to LOCS III NO values
3. Wisconsin Grading System (Klein et al.)
- Used in Beaver Dam Eye Study and Blue Mountains Eye Study
- Nuclear color graded against Munsell color standards (chips)
- More objective for nuclear color assessment
- Separate grading for nuclear opalescence using LOCS II photographs
4. SPONCS (Standard Pre-Operative Nuclear Classification System)
- 5 grades (1 to 5) based on nuclear color at slit-lamp
- Used preoperatively to predict phacoemulsification difficulty
- Grades correlate with cumulative dissipated energy (CDE) during phacoemulsification
- Grade 5 (black cataract) = hardest, needs highest energy
Comparison Table
| System | Scale Type | Nuclear | Cortical | PSC | Main Use |
|---|---|---|---|---|---|
| LOCS III | Continuous decimal | NO/NC 0.1-6.9 | C 0.1-6.9 | P 0.1-5.9 | Research, clinical trials |
| LOCS II | Ordinal | N1-N6 | C1-C5 | P1-P4 | Epidemiology |
| Oxford | VAS (0-5) | N 0-5 | C 0-5 | P 0-5 | Clinical practice |
| Wilmer | Ordinal (0-4+) | 0 to 4+ | 0 to 4+ | 0 to 4+ | Epidemiology |
| Wisconsin/Beaver Dam | Mixed | Munsell chips | LOCS II | LOCS II | Epidemiology |
| SPONCS | Ordinal (1-5) | 1-5 (hardness) | - | - | Surgical planning |
PART VIII: CLINICAL APPLICATION OF LOCS III
1. Epidemiological Studies
- Beaver Dam Eye Study (Klein et al.) - prevalence and 5-year incidence of cataract
- Blue Mountains Eye Study (Mitchell et al.) - Australian population data
- Barbados Eye Study - Black population cataract data
- AREDS (Age-Related Eye Disease Study) - antioxidant supplementation
- Salisbury Eye Evaluation - visual impairment and function
2. Drug Trials
- Anti-cataract drug trials (antioxidants, aldose reductase inhibitors)
- UV-blocking lens studies
- Studies on cataract prevention interventions
3. Surgical Planning
- Phacoemulsification energy required (NC correlates with nuclear hardness)
- Surgical difficulty - harder nuclei (NC > 4) need more energy, longer time
- Selection of surgical technique: soft nucleus (MICS/bimanual), hard nucleus (divide and conquer, phaco-chop)
4. Visual Function Correlation
- NC/NO grade correlates with distance visual acuity and contrast sensitivity
- P grade has disproportionately high correlation with visual disability relative to physical grade
- C grade correlates best with glare sensitivity and peripheral visual field
PART IX: MATURE, HYPERMATURE AND MORGAGNIAN CATARACT - CLINICAL GRADING
| Stage | Description | Key Clinical Feature |
|---|---|---|
| Immature | Lens partially opaque; fundus visible | Shadow on iris with oblique torch (iris shadow test positive) |
| Mature | Completely opaque lens; fundus reflex absent | No iris shadow; uniform white opacity; RAPD absent |
| Hypermature | Degenerated, wrinkled capsule; calcareous plaques | Wrinkled anterior capsule; may have chalky white deposits |
| Morgagnian | Liquefied cortex; nucleus sinks to bottom | Level-like change of nucleus inside lens; golden brown sunken nucleus |
PART X: LIMITATIONS OF LOCS III
- Subjective component - despite photographic standards, inter-observer variability exists (~10-15%)
- Training required - examiners must be calibrated against standard photographs before use in trials
- Slit-lamp dependent - requires high-quality biomicroscope; field studies in low-income settings are difficult
- Combination opacities - in mixed cataracts, all four parameters must be measured; no single summary score
- No adjustment for pupil size - cortical and PSC grading assumes full dilation
- Photograph aging - original Chylack photographic standards may fade over time; calibration needed
- Cannot grade congenital cataracts - designed for age-related opacity morphology
PART XI: NEWER OBJECTIVE GRADING SYSTEMS
1. Scheimpflug Imaging (Pentacam, EAS-1000)
- Cross-sectional imaging of lens using the Scheimpflug principle
- Provides density maps and quantitative light scatter values
- Highly reproducible; eliminates observer subjectivity
- Nuclear density correlated with LOCS III NO grade (r > 0.85)
2. Optical Low Coherence Reflectometry (OLCR)
- Measures optical backscatter from different lens zones
- Quantitative; not affected by illumination
3. Laser Light Scattering
- Dynamic light scattering (DLS) measures high molecular weight protein aggregates
- Detects very early precataractous changes before clinical opacity visible
- Used in research settings
4. Digital Image Analysis
- Computer-based analysis of slit-lamp photographs
- Area-based grading of cortical and PSC opacities
- Removes subjective component from LOCS-style grading
SUMMARY TABLE
| LOCS Version | Year | Nuclear Scale | Cortical | PSC | Scale Type |
|---|---|---|---|---|---|
| LOCS I | 1988 | N1-N4 | C1-C4 | P1-P4 | Ordinal |
| LOCS II | 1989 | N1-N6 | C1-C5 | P1-P4 | Ordinal |
| LOCS III | 1993 | NO/NC 0.1-6.9 | C 0.1-6.9 | P 0.1-5.9 | Continuous decimal |
KEY POINTS FOR PG EXAM
- LOCS III (Chylack 1993) is the gold standard photographic grading system for cataract in clinical research - uses a continuous decimal ratio scale.
- Four parameters graded independently: NO (nuclear opalescence), NC (nuclear color), C (cortical), P (posterior subcapsular).
- Nuclear grade assessed by 45° optical section at slit-lamp; cortical and PSC by retroillumination.
- NO and NC both range 0.1 to 6.9; P ranges 0.1 to 5.9.
- PSC causes disproportionate visual disability - even small P grades cause significant glare and near vision loss.
- LOCS III is ideal for drug trials because its continuous scale detects small changes.
- SPONCS (1-5 grades) is used preoperatively to predict phacoemulsification difficulty - correlates with cumulative dissipated energy (CDE).
- Oxford grading (0-5) is used in clinical practice; LOCS III in research.
- Beyond LOCS: Scheimpflug imaging (Pentacam) provides objective, automated, reproducible lens density maps.
- Mature cataract = no fundus reflex; Morgagnian = nucleus sinks in liquefied cortex.
- Kanski's Clinical Ophthalmology, 10th Ed. - Brad Bowling, Chapter on Lens
- Khurana AK - Comprehensive Ophthalmology 6th Edition, Chapter 7: Diseases of the Lens
- Chylack LT Jr, Wolfe JK, Singer DM, et al. - The Lens Opacities Classification System III (LOCS III), Arch Ophthalmol 1993;111(6):831-836
- Duke-Elder S - System of Ophthalmology, Vol XI: Diseases of the Lens
- The Wills Eye Manual, 8th Edition - Chapter on Cataract
- Klein BEK, Klein R, Linton KLP - Prevalence of Age-Related Lens Opacities in a Population: Beaver Dam Eye Study, Ophthalmology 1992
- Rosenbaum AL, Santiago AP - Clinical Strabismus Management (for ocular motility context)
Add original photo of LOCS3 in initial answer
LOCS III original reference photographs Chylack nuclear opalescence cortical PSC standard grading
This set of eight slit-lamp clinical photographs demonstrates the Standard Pre-Operative Nuclear Classification System (SPONCS) for grading nuclear cataracts. The images, taken at a 45-degree angle, show the progression of lens opacification and nuclear color changes. Grade 1 shows a relatively clear lens with a faint bluish-white tint and visible cortical layers. As the severity progresses through grades 2, 2+, 3, and 3+, the lens nucleus undergoes a chromatic transition from mild yellowing to deep amber and orange. By grades 4 and 4+, the nucleus exhibits pronounced yellow-brown discoloration with significant cloudiness. Grade 5 represents an advanced brunescent cataract with a dark brown, opaque nucleus. The slit-lamp beam reflection simultaneously evolves from a sharp, well-defined section in lower grades to a highly scattered, diffuse reflection in higher grades, reflecting increased lens density and light scattering. This visual scale serves as a standardized tool for ophthalmologists to assess cataract maturity and plan surgical intervention, specifically correlating with cumulative dissipated energy (CDE) during phacoemulsification.
This composite of eight slit-lamp biomicroscopy clinical photographs illustrates the progression and grading of nuclear cataracts using the Oxford clinical grading system, ranging from Grade 0 to Grade 7. The images demonstrate the transformation of the crystalline lens from total transparency to complete opacification. Grade 0 shows a clear lens with a red reflex. Early stages (Grades 1–2) exhibit subtle nuclear density and visible wide sutures. Intermediate stages (Grades 3–5) show increasing nuclear densification and the formation of distinct cortical or nuclear clefts. Advanced stages (Grades 6–7) feature dense radial opacities and progress to a mature cataract characterized by total whole-lens opacification, which completely obscures internal structures and the posterior red reflex. This visual series is an educational tool for ophthalmology and optometry to standardize the assessment of lenticular opacity and cataract severity in clinical practice.
A series of eight clinical slit-lamp photographs (labeled A-H and graded 0-7) demonstrating the progression of cataract formation in a diabetic model, categorized according to the Oxford grading system. The images illustrate the transition from a clear lens (Grade 0) to total lenticular opacity (Grade 7). Key pathological landmarks include widening of the lens sutures (Grade 1), the emergence of radiating opacities from the sutures (Grade 2), and the development of a dense nucleus (Grade 3). More advanced stages demonstrate the formation of cortical clefts (Grades 4-5) and dense radial opacification (Grade 6). The final stage (Grade 7) depicts a mature, opaque nuclear cataract involving the entire lens volume. This comparison chart is used in ophthalmology to study the pathophysiology of diabetic cataracts and to evaluate the efficacy of therapeutic interventions on lens clarity. The visual sequence emphasizes diagnostic features such as nuclear density, suture morphology, and the structural integrity of the lens fibers.
Educational comparison of the three primary types of human cataracts, presented via schematic diagrams (top) and corresponding Scheimpflug slit-lamp photographic images (bottom). The visual is organized into three panels: (A) Cortical cataract, showing characteristic wedge-shaped or peripheral opacities that originate at the lens equator and extend toward the center, often associated with diabetic osmotic stress. (B) Nuclear cataract, demonstrating central densification and opacification within the lens nucleus, typically linked to age-related oxidative protein damage. (C) Posterior subcapsular cataract (PSC), illustrating a localized plaque-like opacity at the posterior pole of the lens just beneath the capsule, frequently associated with corticosteroid use or diabetes. Each schematic identifies the anterior and posterior orientations and highlights the specific zone of lens clouding. The clinical photographs provide a cross-sectional view of the lens, with labels indicating the anterior and posterior lens surfaces, allowing for visualization of the depth and distribution of light scattering within the crystalline lens structure.
A comparison chart of diagnostic nuclear medicine images demonstrating various PET (Positron Emission Tomography) brain reconstruction algorithms. The image features two rows of axial brain slices, each comparing five methods: OSEM, MAPEM Tikhonov, Original FBSEM-Net, FBSEM-IS-Net sequential training, and a high-count Target reference. The first row displays general brain anatomy, highlighting gray and white matter differentiation. The second row focuses on the reconstruction of simulated circular 'hot lesions' (representing increased radiotracer uptake) within the right cortical region. Quantitative performance is indicated by the Normalized Root Mean Square Error (NRMSE) values above each image. Visually, the OSEM method shows high graininess and noise. MAPEM Tikhonov and Original FBSEM-Net provide moderate smoothing but exhibit some structural blurring. The FBSEM-IS-Net sequential training method demonstrates superior image quality, with the sharpest lesion boundaries, reduced artifacts, and the closest structural resemblance to the Target image. This visual supports research into deep unrolled neural networks for low-count PET image denoising and reconstruction.
This plate presents comparative anatomical and paleoanthropological visual data of a partial right humeral shaft (PA64, Humerus III) from Zhoukoudian, attributed to Homo erectus. (A-D) display clinical photographs of the original fossil fragment in anterior, posterior, medial, and lateral views, respectively. The fossil exhibits a mineralized, striated texture with gray-to-brownish staining and irregular fractures at the proximal and distal ends. Visible museum labels are present on the anterior and lateral surfaces. (E-H) show the corresponding virtual 3D reconstructions derived from high-resolution scanning, emphasizing the midshaft cylindrical morphology and cortical surface contours in a uniform gray rendering. Image (I) provides a composite anatomical model: a yellow volume rendering of Humerus III is superimposed onto a blue mirrored cast of Humerus II, illustrating the anatomical positioning of the fragment along the humeral diaphysis. The midshaft region demonstrates significant cortical thickness and robusticity, key features for biomechanical analysis of upper limb loading in ancestral hominins.
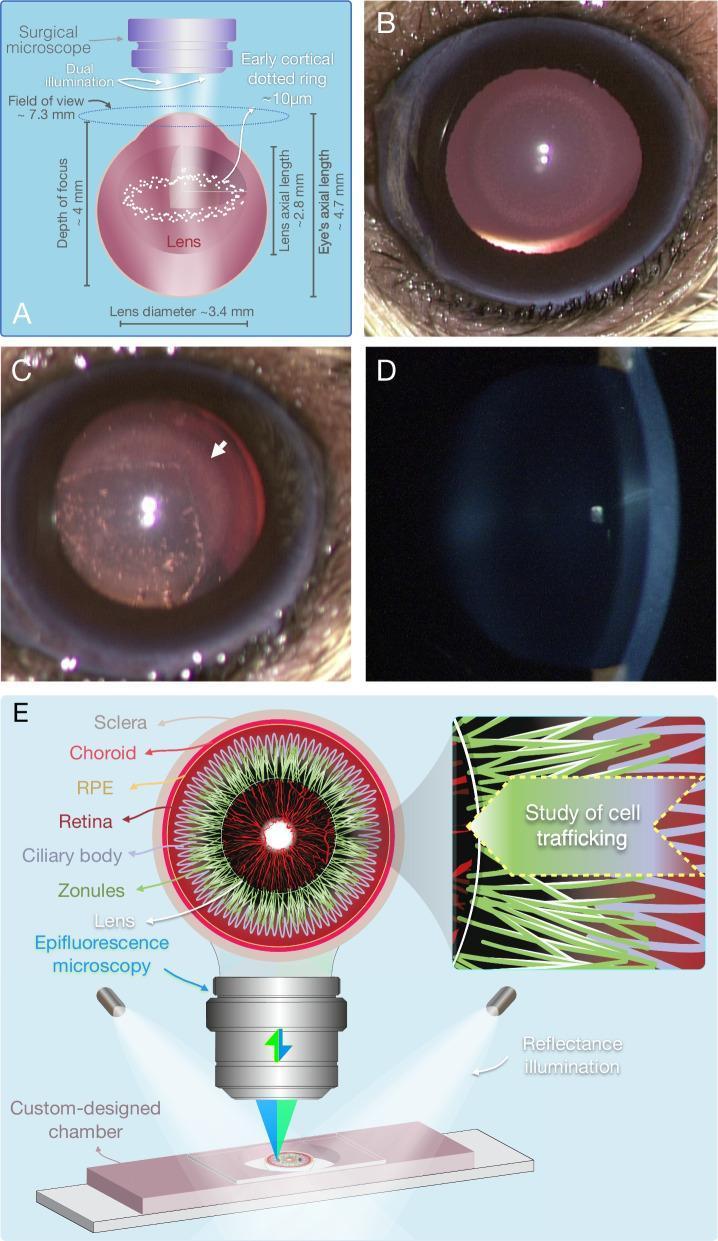
A multi-panel figure illustrating advanced imaging techniques for cataract evaluation and ocular immune cell trafficking. Panel A shows a schematic for dual illumination surgical microscopy, detailing optical parameters for visualizing an early cortical 'dotted ring' stage (~10µm microlesions). Panel B (bright-field) and C (stereo-microscopy) present clinical photographs of a lens with diabetic cataract; Figure C highlights hyper-reflective microlesions and posterior subcapsular cataract (PSC) with a white arrow. Panel D demonstrates the clinical limitation of slit-lamp biomicroscopy, where these microlesions lack sufficient contrast to be visible. Panel E contains a labeled anatomical diagram of the eye (sclera, choroid, RPE, retina, ciliary body, zonules, lens) and a schematic for an anterior half-globe microscopy setup. This method utilizes external reflectance illuminators and epifluorescence microscopy within a custom chamber to visualize cell trafficking along zonular fibers in 3D. The content serves as an educational comparison between standard clinical evaluation and novel microscopic techniques for early diabetic cataractogenesis research.
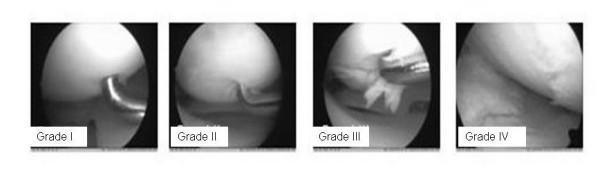
A series of four arthroscopic clinical photographs demonstrating the progression of cartilage damage in the knee joint, classified according to the International Cartilage Repair Society (ICRS) grading system. Grade I shows superficial softening or minor surface indentation, often assessed via an arthroscopic probe. Grade II depicts a partial-thickness defect with visible surface irregularities or fissures extending less than 50% of the cartilage depth. Grade III illustrates a more severe, deep defect penetrating more than 50% of the cartilage thickness, showing clear fibrillation and tissue disruption. Grade IV represents full-thickness cartilage loss, exposing the underlying subchondral bone with evident pitting or ulceration. These images serve as a diagnostic reference for orthopedic surgery and rheumatology, highlighting the transition from minor chondromalacia to advanced osteoarthritis within various knee compartments such as the patellofemoral and femoro-tibial joints.
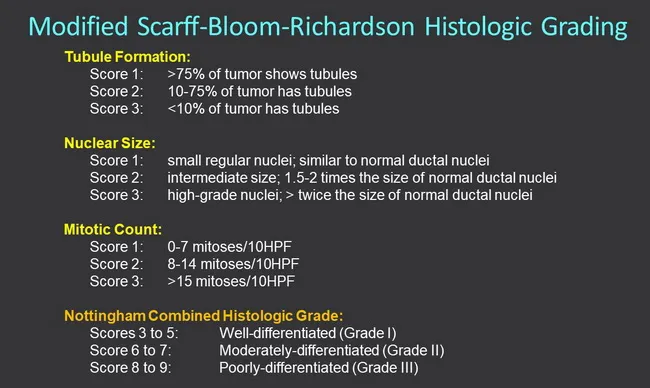
This histopathology-focused educational image illustrates the Elston-Ellis modification of Scarff-Bloom-Richardson grading, also known as the Nottingham Combined Histologic Grade, applied to invasive breast ductal carcinoma. Prepared on formalin-fixed paraffin-embedded breast tissue and stained with Hematoxylin and Eosin, the slide emphasizes three morphologic components used to assign a tumor grade: tubule formation, nuclear size and pleomorphism, and mitotic rate. Tubule formation is scored from 1 to 3 by the proportion of tumor forming tubules; higher tubule content indicates a lower grade. Nuclear size and pleomorphism assess nuclear size, shape, and chromatin pattern, with small regular nuclei receiving the lowest score and markedly abnormal, high-grade nuclei receiving the highest score. Mitotic count evaluates proliferative activity in mitotic figures per high power field, with increasing mitoses earning higher scores. The three component scores are summed to yield a final histologic grade: 3–5 for well-differentiated (Grade I), 6–7 for moderately differentiated (Grade II), and 8–9 for poorly differentiated (Grade III). This grading correlates with prognosis, recurrence risk, and overall survival, and remains essential for guiding adjuvant therapy decisions. The image also underscores nomenclature: Nottingham, Elston-Ellis, and Scarff-Bloom-Richardson systems. The figure may include color-coded score annotations and a legend for quick reference by pathologists, surgeons, and trainees.
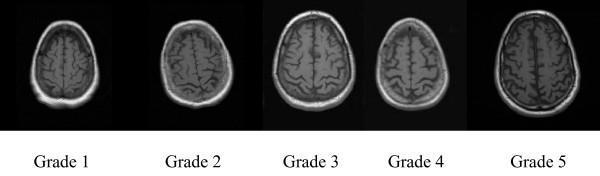
This diagnostic image series presents a five-panel comparison chart illustrating the progression of cortical atrophy as visualized on axial T1-weighted MRI scans of the brain. The images demonstrate a visual grading scale ranging from Grade 1 to Grade 5, based on the Cardiovascular Health Study grading system. Grade 1 shows a healthy brain state with narrow, closely spaced sulci and minimal visible cerebrospinal fluid (CSF) on the cortical surface. As the grading progresses toward Grade 5, there is a clear incremental increase in sulcal dilatation and widening of the cortical subarachnoid spaces, reflecting progressive cortical tissue loss. By Grade 5, the gyri appear thinner and the CSF-filled sulci are markedly prominent and enlarged. This visual reference serves as a clinical teaching tool for neuroradiological assessment of age-related or neurodegenerative brain volume loss, highlighting the loss of parenchyma and subsequent ex vacuo expansion of CSF spaces.
LOCS III original photographs Chylack 1993 lens opacity classification system reference images
LOCS III grading chart image nuclear opalescence NO NC cortical posterior subcapsular photograph site:researchgate.net OR site:iovs.org OR site:ophthalmologyscience.org
LOCS III nuclear opalescence NO1 NO2 NO3 NO4 NO5 NO6 slit lamp optical section grading photographs
This set of eight slit-lamp clinical photographs demonstrates the Standard Pre-Operative Nuclear Classification System (SPONCS) for grading nuclear cataracts. The images, taken at a 45-degree angle, show the progression of lens opacification and nuclear color changes. Grade 1 shows a relatively clear lens with a faint bluish-white tint and visible cortical layers. As the severity progresses through grades 2, 2+, 3, and 3+, the lens nucleus undergoes a chromatic transition from mild yellowing to deep amber and orange. By grades 4 and 4+, the nucleus exhibits pronounced yellow-brown discoloration with significant cloudiness. Grade 5 represents an advanced brunescent cataract with a dark brown, opaque nucleus. The slit-lamp beam reflection simultaneously evolves from a sharp, well-defined section in lower grades to a highly scattered, diffuse reflection in higher grades, reflecting increased lens density and light scattering. This visual scale serves as a standardized tool for ophthalmologists to assess cataract maturity and plan surgical intervention, specifically correlating with cumulative dissipated energy (CDE) during phacoemulsification.
This composite of eight slit-lamp biomicroscopy clinical photographs illustrates the progression and grading of nuclear cataracts using the Oxford clinical grading system, ranging from Grade 0 to Grade 7. The images demonstrate the transformation of the crystalline lens from total transparency to complete opacification. Grade 0 shows a clear lens with a red reflex. Early stages (Grades 1–2) exhibit subtle nuclear density and visible wide sutures. Intermediate stages (Grades 3–5) show increasing nuclear densification and the formation of distinct cortical or nuclear clefts. Advanced stages (Grades 6–7) feature dense radial opacities and progress to a mature cataract characterized by total whole-lens opacification, which completely obscures internal structures and the posterior red reflex. This visual series is an educational tool for ophthalmology and optometry to standardize the assessment of lenticular opacity and cataract severity in clinical practice.
A series of eight clinical slit-lamp photographs (labeled A-H and graded 0-7) demonstrating the progression of cataract formation in a diabetic model, categorized according to the Oxford grading system. The images illustrate the transition from a clear lens (Grade 0) to total lenticular opacity (Grade 7). Key pathological landmarks include widening of the lens sutures (Grade 1), the emergence of radiating opacities from the sutures (Grade 2), and the development of a dense nucleus (Grade 3). More advanced stages demonstrate the formation of cortical clefts (Grades 4-5) and dense radial opacification (Grade 6). The final stage (Grade 7) depicts a mature, opaque nuclear cataract involving the entire lens volume. This comparison chart is used in ophthalmology to study the pathophysiology of diabetic cataracts and to evaluate the efficacy of therapeutic interventions on lens clarity. The visual sequence emphasizes diagnostic features such as nuclear density, suture morphology, and the structural integrity of the lens fibers.
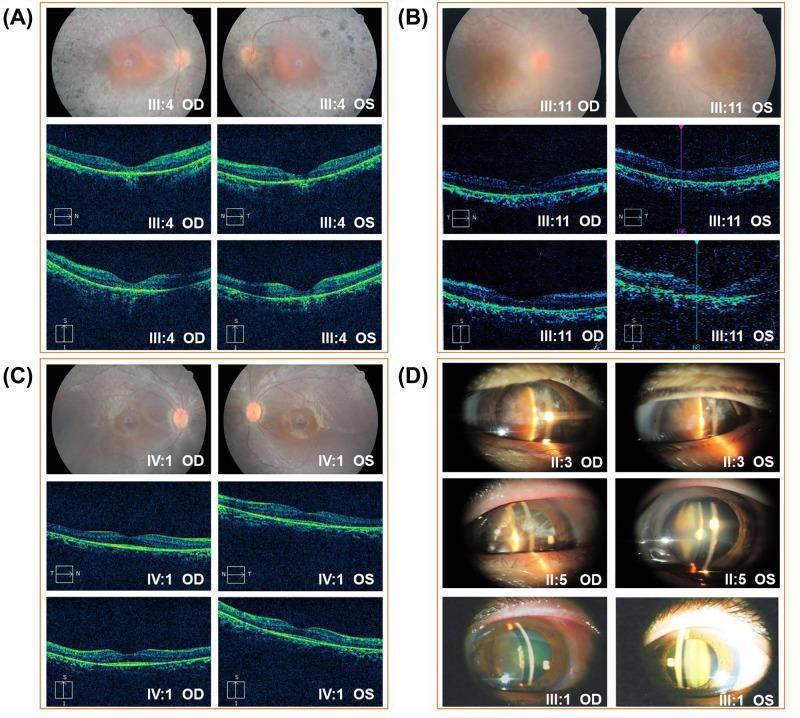
A multi-panel compilation of ophthalmic clinical images featuring fundus photography, Optical Coherence Tomography (OCT), and slit-lamp biomicroscopy. Panels A, B, and C display bilateral fundus photos and corresponding macular OCT scans for three patients (III:4, III:11, and IV:1). Fundus findings show classic signs of Retinitis Pigmentosa (RP), including bone-spicule pigmentation, retinal pigment epithelium (RPE) atrophy, and marked attenuation of retinal vessels, most notably in III:4 and III:11. The corresponding OCT images demonstrate progressive retinal thinning and loss of the outer retinal layers (ellipsoid zone and photoreceptor segments). Panel D presents slit-lamp photographs of the anterior segment for patients II:3, II:5, and III:1, illustrating varying degrees of crystalline lens opacification. Observed cataract morphologies include central nuclear sclerosis with a yellowish hue (II:3) and more diffuse cortical or subcapsular opacities (II:5). These images provide a clinical overview of the ophthalmic manifestations associated with autosomal dominant Retinitis Pigmentosa, including secondary cataract formation, across multiple family members.
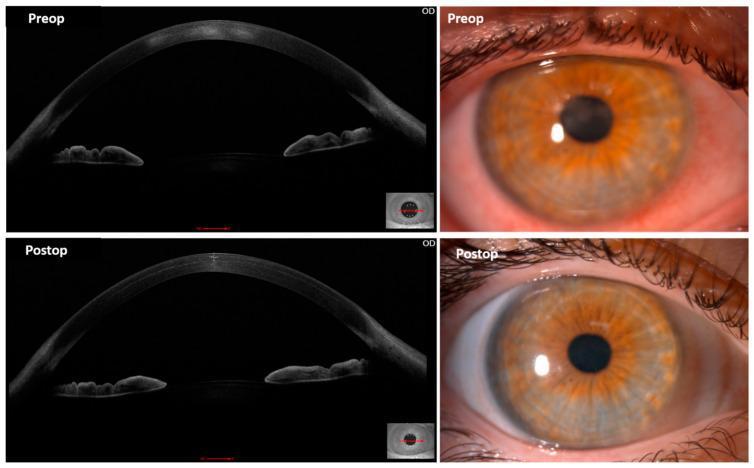
This composite figure displays comparative anterior segment optical coherence tomography (AS-OCT) and slit-lamp clinical photographs of an eye with advanced stage IV keratoconus, before (top row) and one month after (bottom row) autologous adipose-derived stem cell (ADSC) mid-stromal implantation. The pre-operative (Preop) slit-lamp image shows significant central corneal opacification and hazy scarring, while the corresponding OCT cross-section demonstrates irregular corneal thinning and high-reflectivity areas in the mid-stroma indicating scar tissue. The post-operative (Postop) images reveal a marked reduction in corneal haze and improved transparency in the slit-lamp photograph. The Postop AS-OCT scan shows a smoother corneal curvature and decreased density of the central stromal scars. Notably, the bottom-left OCT image highlights a localized area of increased stromal thickness and reflectivity at the site of the ADSC implantation, representing the successful production of new collagen and extracellular matrix (ECM) deposits. This comparison illustrates the potential for cellular therapy to promote stromal remodeling and restore optical clarity in diseased corneas.
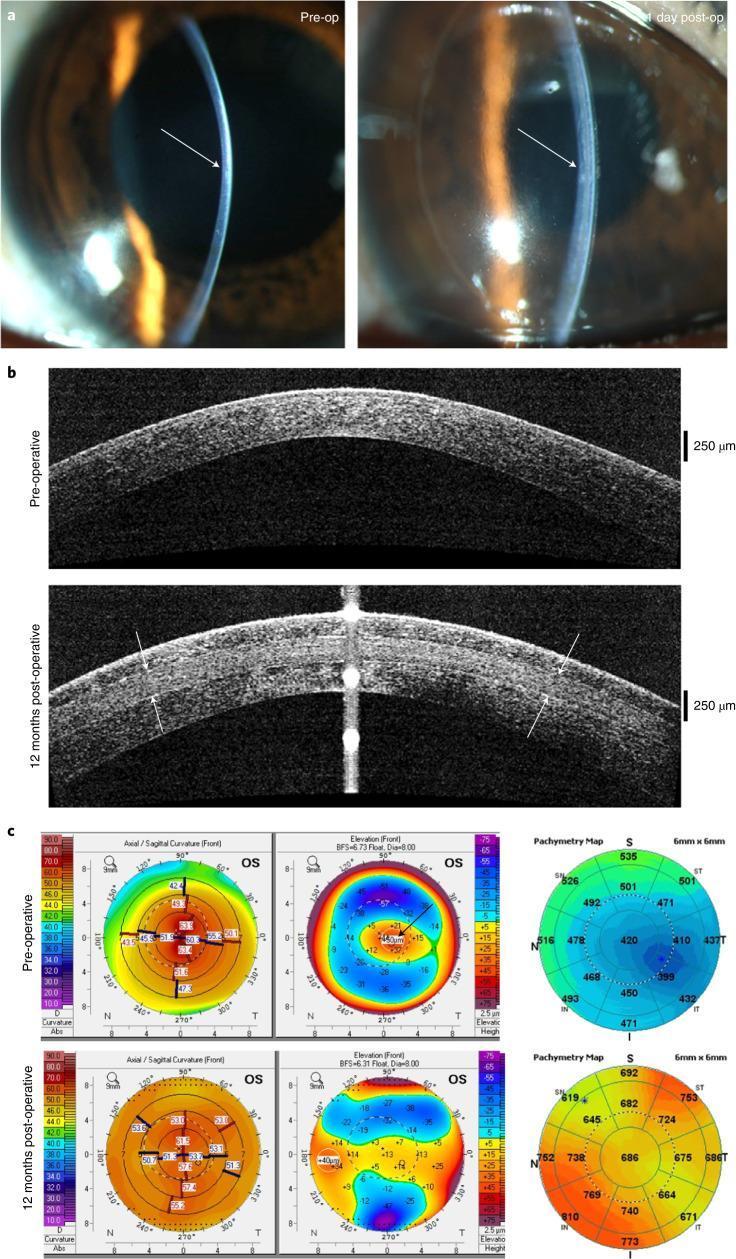
Educational panel illustrating clinical and diagnostic changes following intrastromal implantation of a Bioengineered Porcine Collagen Double Crosslinked (BPCDX) corneal device. Section A shows slit-lamp biomicroscopy photographs comparing the pre-operative thin, steeply curved cornea with the immediate post-operative result (day 1), where central corneal thickness and curvature regularization are visible. Section B features Optical Coherence Tomography (OCT) cross-sectional scans. The 12-month post-operative scan demonstrates sustained corneal thickening, with white arrows delineating the anterior and posterior interfaces of the BPCDX implant within the host stroma. Section C provides longitudinal topographic, elevation, and pachymetric data. The pre-operative maps show high keratometric power (reaching over 60D) and central thinning, characteristic of advanced keratoconus. The 12-month post-operative maps reveal significant flattening (reduction in diopters) and a substantial increase in pachymetric values (central thickness increasing from approximately 420 µm to over 680 µm). The visual provides a comprehensive comparison of surgical outcomes in treating corneal ectasia through bioengineered tissue integration.
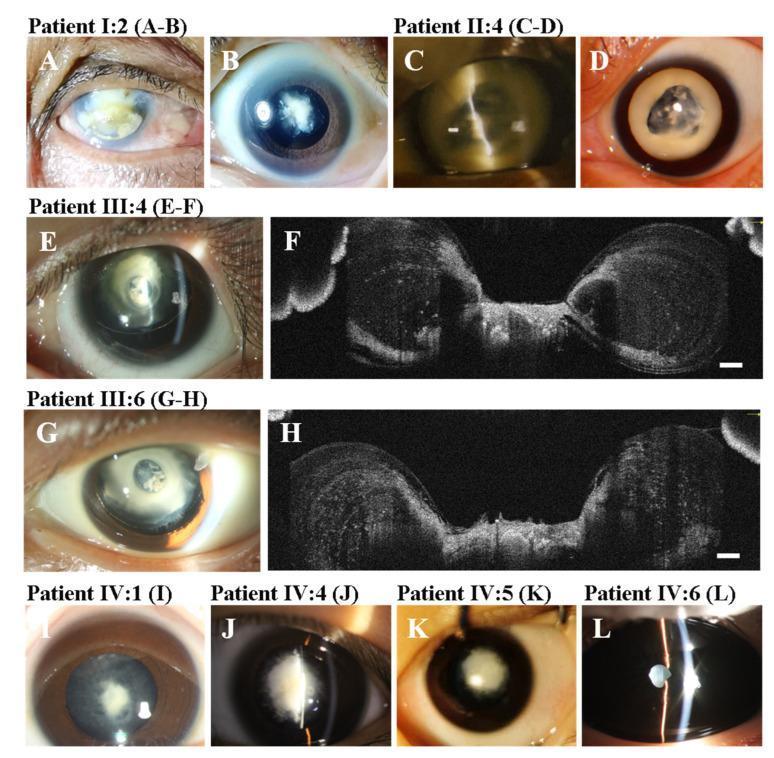
A multi-panel figure consisting of slit-lamp clinical photographs and Anterior Segment Optical Coherence Tomography (AS-OCT) images documenting phenotypic variations of congenital cataracts in a multi-generational family. The photographs (A-E, G, I-L) display a range of crystalline lens opacities, including dense nuclear cataracts, total cataracts, and keratoleukoma. Key clinical signs visible include anterior umbilication of the lens—characterized by a central indentation of the anterior lens surface—and lens subluxation (E, G). The AS-OCT cross-sections (F, H) provide high-resolution visualization of the lens architecture, confirming the presence of anterior umbilication as a central depression with an intact anterior capsule. The educational focus is on the morphological diversity of cataracts caused by genetic variants, specifically those related to the MIP gene, illustrating varying degrees of central lens opacity and structural deformation across different individuals. The images are essential for ophthalmological training in identifying anterior segment dysgenesis and congenital lens anomalies.
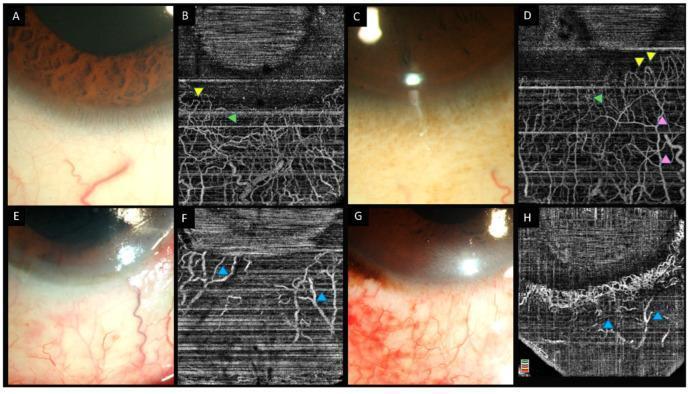
This Eight-panel collage compares slit lamp clinical photographs and anterior segment optical coherence tomography angiography (AS-OCTA) images of the human eye. Panels A–D show normal limbal and perilimbal vasculature. The slit lamp images (A, C) show healthy conjunctival and episcleral vessels. The corresponding OCTA scans (B, D) provide a high-resolution map of the vascular architecture, highlighting hairpin loops at the corneal limbus (yellow arrowheads), radial vessels (green arrowheads), and deeper Y-shaped patterns (pink arrowheads). Panels E–H illustrate eyes with chemical injury. The slit lamp images (E, G) demonstrate conjunctival injection and inflammation. The related OCTA scans (F, H) reveal significant pathological changes, specifically large ischemic zones characterized by a lack of signal (non-perfusion) and distortion of the remaining limbal vasculature (blue arrowheads). This comparison demonstrates the clinical utility of AS-OCTA in assessing ocular surface ischemia and vascular integrity following chemical burns, allowing for more precise quantification of limbal stem cell deficiency risk than conventional slit lamp examination alone.
https://pmc.ncbi.nlm.nih.gov/articles/PMC9493415
https://pmc.ncbi.nlm.nih.gov/articles/PMC12454382
LOCS III - ORIGINAL STANDARD PHOTOGRAPHS (Chylack et al., 1993)
- Row 1 (Nuclear): 6 paired slit-lamp optical section images labeled NO1/NC1 through NO6/NC6, showing progressive nuclear opalescence and color change from clear to dark brunescent
- Row 2 (Cortical): 5 retroillumination photographs labeled C1 through C5, showing increasing cortical spoke opacity
- Row 3 (Posterior Subcapsular): 5 retroillumination photographs labeled P1 through P5, showing increasing central posterior plaque opacity
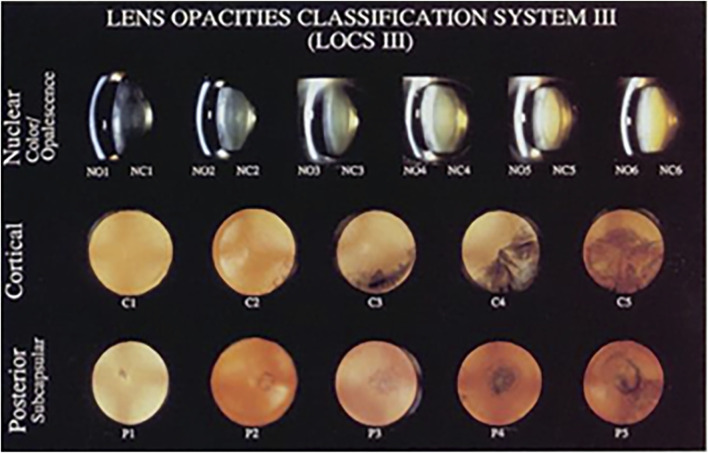
Reading the LOCS III Chart:
| Row | Method | Labels | What is Graded |
|---|---|---|---|
| Nuclear (top) | Slit-lamp at 45°, optical section | NO1 NC1 → NO6 NC6 | Opalescence (NO) = milkiness/scatter; Color (NC) = yellow→brown hue |
| Cortical (middle) | Retroillumination, red reflex background | C1 → C5 | Dark peripheral spoke-like shadows = cortical opacities |
| PSC (bottom) | Retroillumination, red reflex background | P1 → P5 | Central dark shadow at posterior pole = PSC plaque |
- Place the chart under the slit-lamp lamp housing or on an adjacent board
- Compare the patient's lens to each row of photographs simultaneously
- Assign the decimal value between the closest two standards (e.g., NO 3.4 = between standard NO3 and NO4, closer to NO3)
- Record all four values: NO ___ NC ___ C ___ P ___
Note: The original Chylack photographs are proprietary and available as a calibrated laminated card distributed with the original publication. The image above is a reproduction from open-access literature for educational purposes.
Posterior polar cataract as a theory question subjective for post graduate student including all classification and complication Excusively referenced from Standard PG ophthalmology books Kanski,dukes,ak khurana lens
posterior polar cataract slit lamp retroillumination clinical photograph
This clinical photograph displays a posterior subcapsular cataract (PSC) viewed under slit-lamp biomicroscopy. The image reveals a characteristic granular, 'pearl-like' opacification located in the posterior subcapsular region of the crystalline lens. Black arrows highlight these discrete, small, rounded opacities, which appear more concentrated centrally and toward the lower quadrant. The overall lens exhibits an amber-to-light-brown hue, suggestive of co-existing nuclear sclerosis. A vertical light reflex from the slit-lamp source is visible on the right side of the frame, providing retroillumination that accentuates the hazy, plaque-like distribution of the cataract. This finding is highly relevant in ophthalmology for diagnosing vision impairment related to posterior lens pathology, often associated with prolonged corticosteroid use, diabetes, or ionizing radiation exposure. The image demonstrates the visual obstruction and light scattering caused by these subcapsular changes.
This slit-lamp photograph shows the anterior segment of a human eye using retroillumination through a dilated pupil. The image demonstrates a congenital lens opacity, specifically a plaque-like anterior polar cataract. Centrally, there is a dense, dark axial opacity surrounded by a fuzzy, irregular, whitish halo. Radiating from this central lesion toward the lens periphery are multiple fine, linear, whitish lines resembling a spiderweb or 'cracked' pattern, which are characteristic of persistent pupillary membrane remnants or epicapsular stars. The red reflex in the background provides high contrast, highlighting the morphology and distribution of these opacities. This visual illustrates clinical signs often associated with embryological developmental abnormalities of the lens vesicle or pupillary membrane regression, relevant in pediatric ophthalmology for diagnosing infantile cataracts and associated anterior segment dysgenesis.
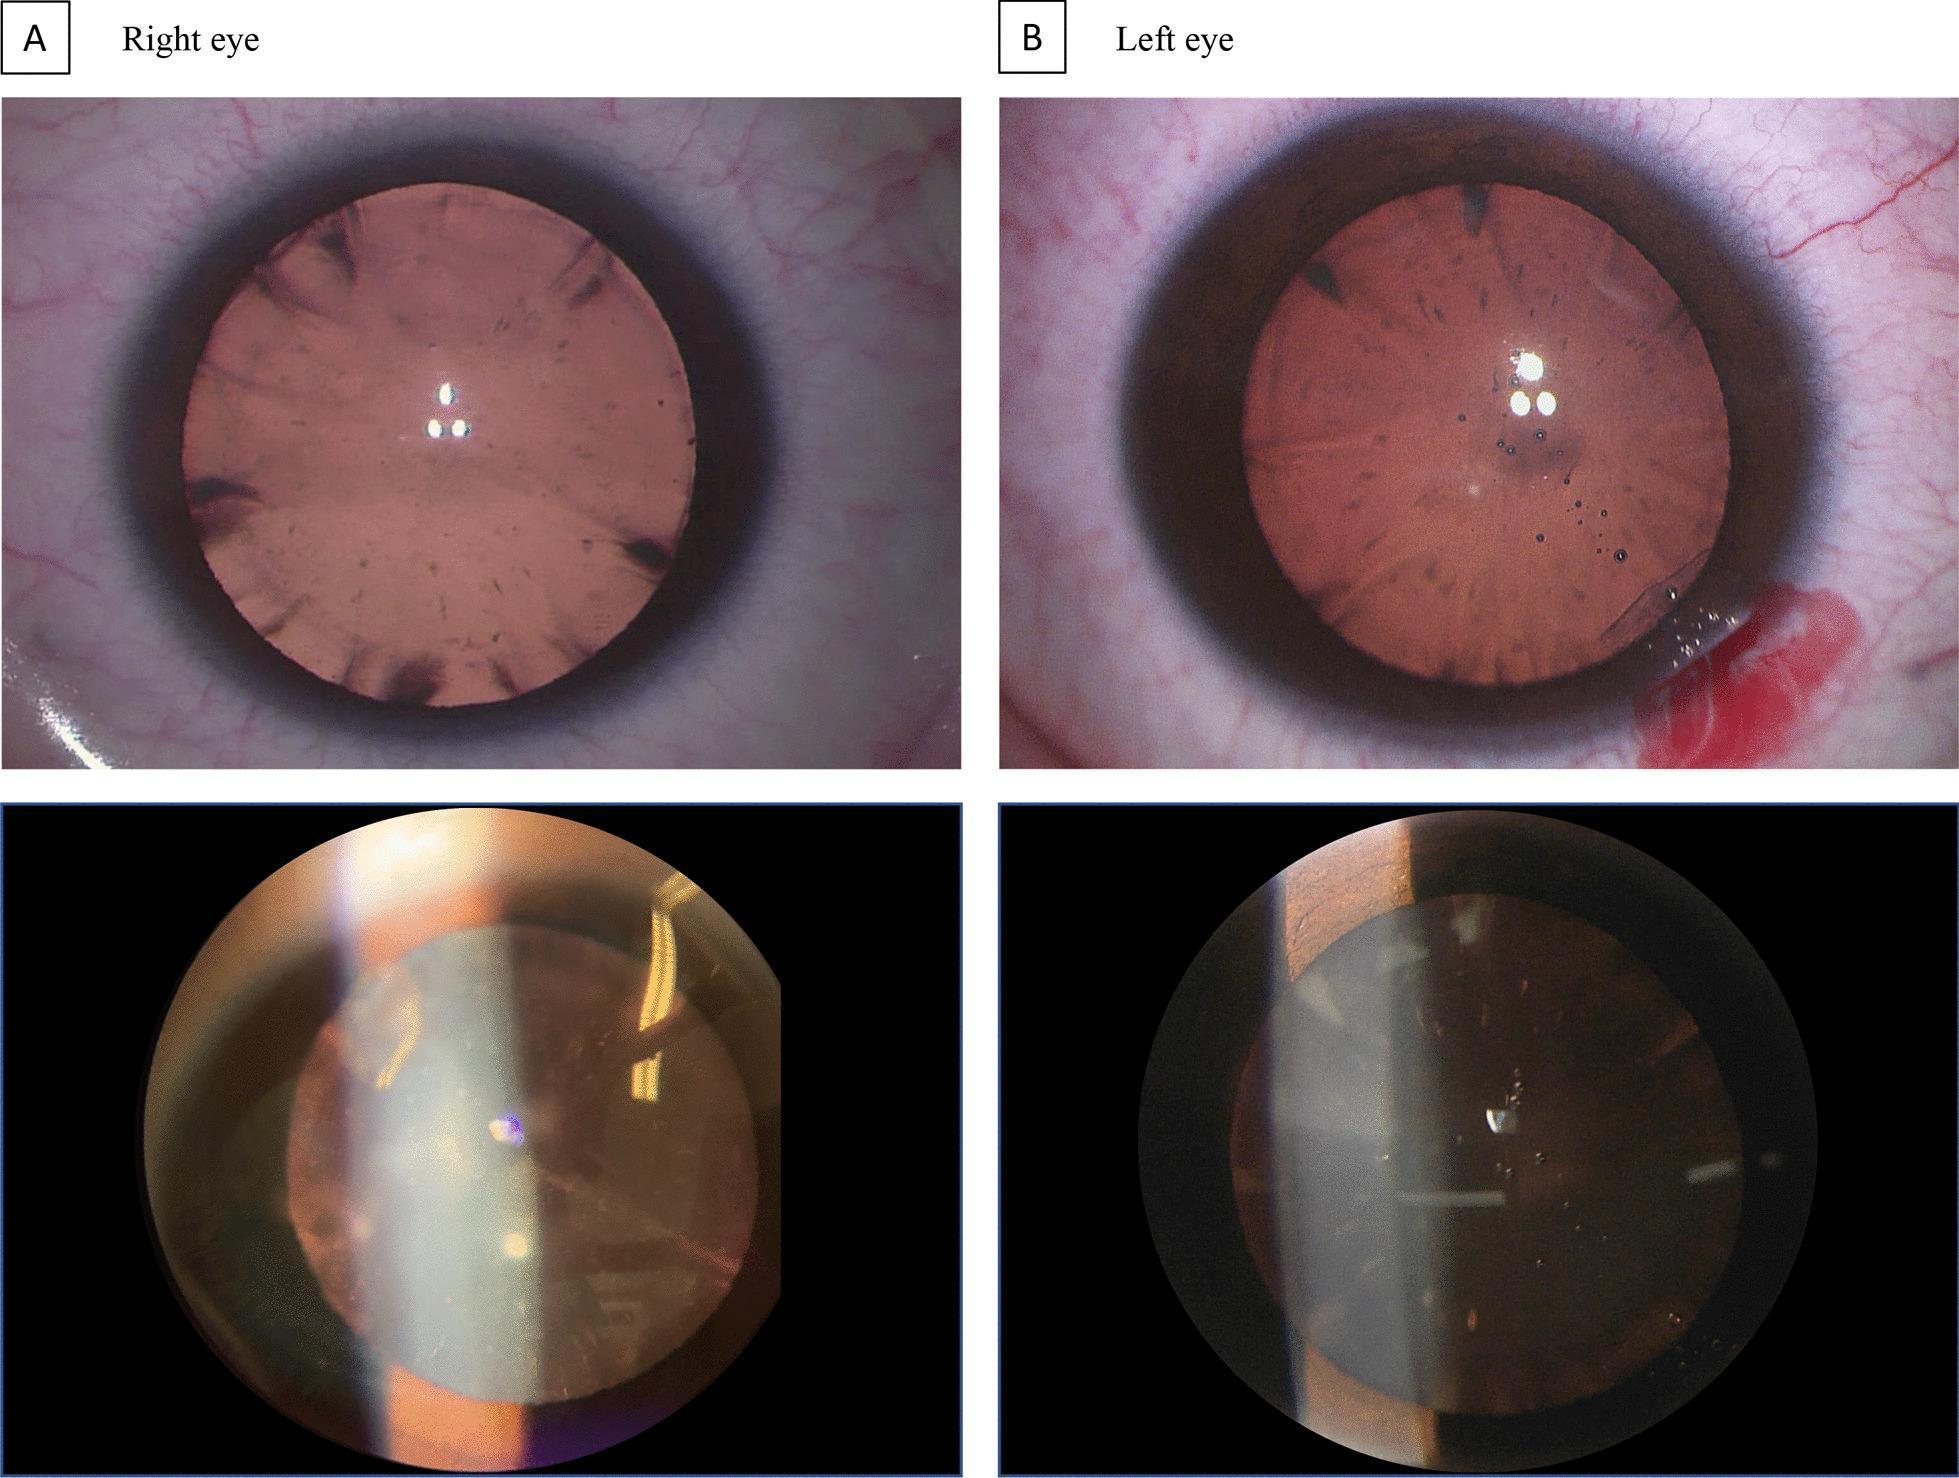
A clinical photograph and slit-lamp examination series depicting bilateral cataracts in a patient with Cerebrotendinous Xanthomatosis (CTX). The top panels (A and B) show retroillumination images of the right and left eyes, respectively, revealing characteristic diffuse, 'fleck-like' cortical opacities. These small, discrete opacities are primarily concentrated in the posterior aspect of the lens. The left eye (Panel B) additionally demonstrates a small area of subconjunctival hemorrhage or localized blood at the limbus. The bottom panels provide slit-lamp biomicroscopy views, confirming the posterior location and morphology of the lens opacities. In the right eye, the opacity appears more centrally defined, while the left eye shows a more scattered distribution. This specific 'fleck-like' posterior cataract morphology serves as a key clinical biomarker for CTX, an inborn error of metabolism. The images illustrate the decrease in lens transparency associated with juvenile-onset bilateral cataracts in metabolic disease.
Two slit-lamp clinical photographs showing different forms of lens opacification and fibrosis. Figure A is a retroillumination image demonstrating Posterior Capsular Opacification (PCO), a common post-cataract surgery complication. The lens capsule displays diffuse brownish discoloration and a characteristic textured appearance consisting of irregular dark patches, branching patterns, and small circular clusters (Elschnig pearls) indicative of aberrant lens epithelial cell (LEC) migration and proliferation. Figure B illustrates an anterior subcapsular cataract with anterior subcapsular fibrosis (ASF). The image reveals a prominent, bright white, star-like (stellate) central opacity at the anterior pole of the lens, surrounded by a more diffuse, grayish-white opacity. This fibrotic plaque is the result of epithelial-mesenchymal transition (EMT) of LECs into myofibroblastic cells. Both images highlight pathological consequences of LEC dysfunction and fibrosis in ophthalmology.
This clinical photograph displays a slit-lamp examination of a human eye, specifically focusing on the crystalline lens. The image demonstrates a posterior subcapsular cataract (PSC) characterized by granular, plaque-like opacities located in the posterior cortex of the lens, just internal to the posterior capsule. The opacities exhibit a breadcrumb or cloud-like morphology, clustered primarily in the central visual axis. A prominent light reflex is visible on the iris and anterior chamber on the left side of the frame, indicating the illumination source, while a bright, focal reflection is seen over the central opacified area of the lens. The periphery of the lens remains relatively clear compared to the densely opacified central posterior region. This finding is clinically significant as PSCs typically cause significant glare and disproportionate vision loss under bright light conditions. In this specific clinical context, the cataract is associated with ocular trauma following a lightning strike.
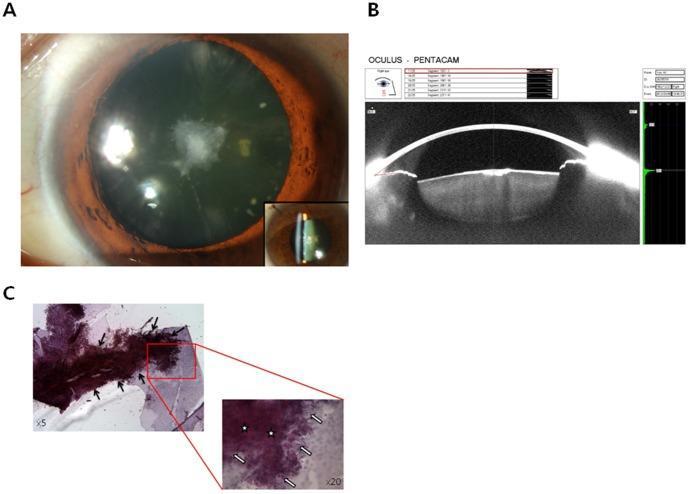
This composite ophthalmological figure illustrates the clinical and histopathological features of an anterior polar cataract (APC). Panel A presents a slit-lamp photograph showing a central, irregular white-grey opacity located directly beneath the anterior lens capsule, with an inset demonstrating the focal nature of the opacity within the slit beam. Panel B displays a Scheimpflug imaging scan (Pentacam) which provides a cross-sectional density map, confirming the focal hyperreflectivity at the anterior lens pole. Panel C shows light microscopy of the excised anterior capsule using H&E or similar staining. The low-power view (x5) reveals a multilamellar arrangement with distinct collagenous aggregations (black arrows). The high-power inset (x20) highlights proliferative changes in the lens epithelial cells (open arrows) and dense collagenous deposits (stars), illustrating the fibrotic transdifferentiation characteristic of this cataract type. The material is intended for advanced medical education regarding lens pathology and diagnostic imaging in ophthalmology.
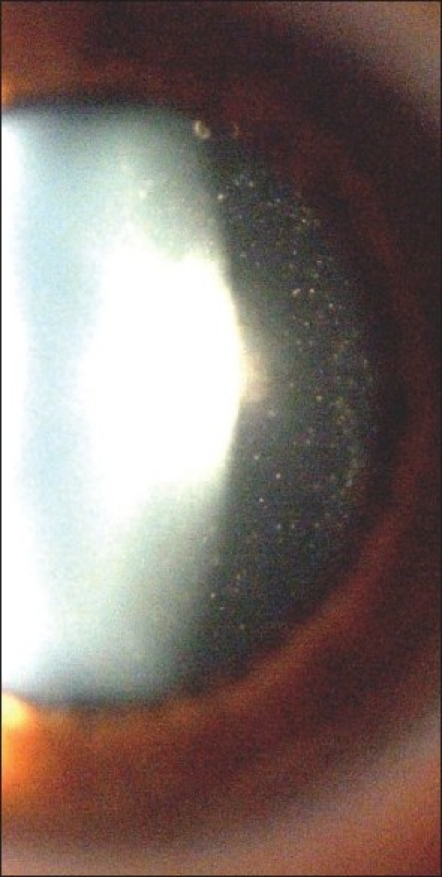
**Imaging Modality:** Slit-lamp biomicroscopy photograph of the anterior segment. **Anatomical Region:** Crystalline lens and anterior vitreous chamber. **Observed Pathology:** The image demonstrates a localized, dense, white crystalline opacity situated at the posterior pole of the lens, characteristic of a posterior polar cataract. Extending posterior to the lens capsule into the anterior vitreous is a diffuse distribution of fine, refractile, punctate opacities. **Characteristic Visual Features:** - **Posterior Lens Opacity:** A well-defined, bright white plaque at the posterior lens cortex/capsule interface. - **Vitreous Infiltration:** Numerous small, hyper-reflective, crystalline-like seeds or infiltrates are visible within the retro-lental space, indicating a potential compromise of the posterior capsule or an associated inflammatory/degenerative vitreous process. - **Lighting:** Slit-beam illumination highlights the depth and axial location of the lens opacity and the suspended nature of the vitreous particles. **Key Diagnostic Features:** The combination of a stationary posterior polar lens opacity and mobile-appearing infiltrates in the vitreous space is a critical finding for surgical planning, often indicating a pre-existing posterior capsular defect or posterior segment involvement.
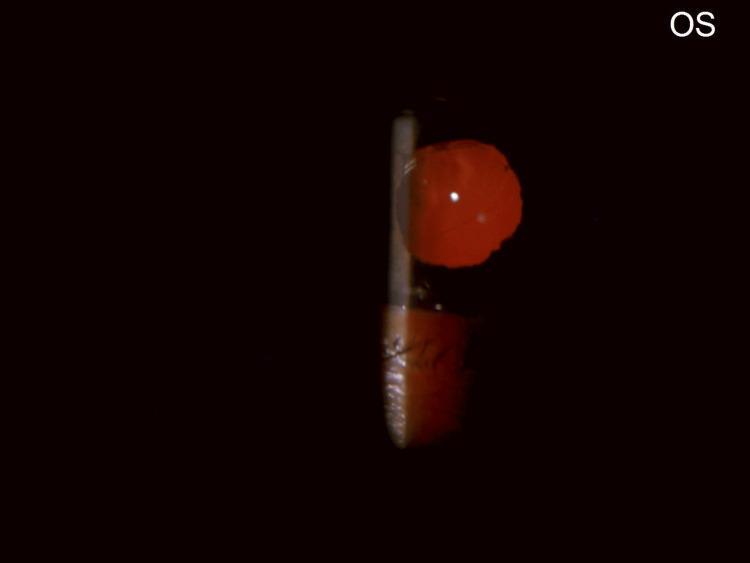
This clinical photograph shows a slit-lamp examination of the left eye (OS) in a post-operative state following cataract surgery. The image demonstrates a clear anterior chamber and pseudophakia, evidenced by a centrally positioned intraocular lens (IOL). A prominent, bright red reflex (red glow) fills the pupillary aperture, indicating a clear visual axis through the IOL to the fundus. The pupil is slightly irregular in shape. A vertical slit-lamp light beam is visible on the left side of the iris and cornea, providing cross-sectional illumination that reveals the depth of the anterior segment. Within the red reflex, a sharp, white punctate reflection is visible on the anterior surface of the IOL, along with a subtle curved edge of the lens optic. This diagnostic image is used in ophthalmology to confirm the correct placement of a posterior chamber intraocular lens and to assess the clarity of the ocular media after surgical intervention.
posterior polar cataract surgery phacoemulsification posterior capsule rupture complication
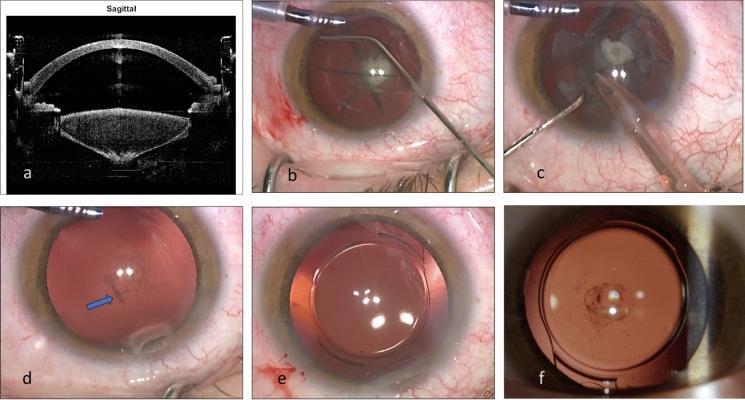
This composite figure illustrates a surgical sequence for Femtosecond Laser-Assisted Cataract Surgery (FLACS) in a patient with a posterior polar cataract. (a) A preoperative sagittal OCT image shows the characteristic posterior bulge of the lens material toward the posterior capsule, with no visible capsular rupture. (b) Intraoperative photograph shows manual hydrodissection using a cannula to separate the lens from the capsule. (c) Phacoemulsification stage, where a central posterior white plaque is manipulated and flipped anteriorly for safe removal. (d) Post-extraction view demonstrating an intact posterior capsule with remnant pigmented dots and a localized surgical scar (arrow) from adhesion removal. (e) Successful implantation of a posterior chamber intraocular lens (PC-IOL) within the intact capsular bag. (f) A one-month post-operative retroillumination photograph showing residual posterior stippling that does not affect visual acuity. This educational series highlights the surgical precautions and diagnostic imaging necessary to manage the risk of posterior capsule rupture in polar cataract cases.
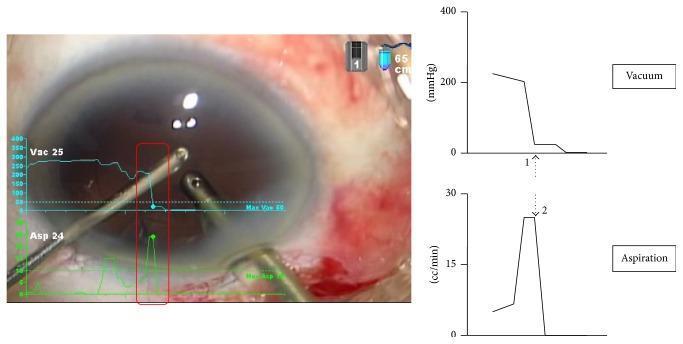
This image is a composite of a clinical photograph and synchronized physiological data graphs representing a cataract surgery complication. The photograph shows the anterior segment of a human eye during bimanual irrigation and aspiration (IA). Two metallic surgical instruments are visible within the anterior chamber; the tip of one instrument is positioned near the posterior capsule. To the right, two line graphs illustrate the real-time fluidics data provided by a Surgical Media Center (SMC). The top graph displays vacuum levels (mmHg, 0–400), showing a sharp decline (arrow 1). The bottom graph displays the aspiration rate (cc/min, 0–30), showing a sudden spike followed by a rapid fall (arrow 2). This inverse relationship—a vacuum drop combined with an abrupt aspiration increase—is characteristic of a post-occlusion surge. This surge resulted in the accidental aspiration and subsequent rupture of the posterior capsule. The clinical relevance is to demonstrate the importance of monitoring fluidic parameters during phacoemulsification to prevent intraoperative complications.
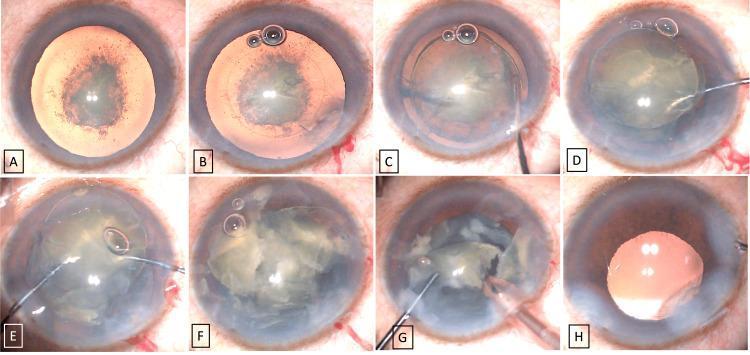
A series of eight clinical photographs (A-H) documenting the surgical stages of phacoemulsification for a posterior polar cataract (PPC). (A) Preoperative view showing a dense posterior subcapsular plaque and grade III nuclear sclerosis. (B) Execution of a 5mm continuous curvilinear capsulorhexis. (C) Successful hydrodelineation, showing the separation of the inner nucleus from the outer epinucleus. (D) Prolapse of the nucleus into the anterior chamber using a Y-rotator instrument. (E) Manual mechanical cracking of the nucleus using the 'two-Y crushing technique' with two rotators. (F) Completion of nuclear fragmentation into multiple segments. (G) Emulsification of the nuclear fragments using a phacoemulsification probe. (H) Postoperative result showing a clear, well-centered single-piece intraocular lens (IOL) implanted within the capsular bag. The series demonstrates an specialized approach to PPC management designed to minimize posterior capsule rupture by prolapsing and mechanical crushing of the nucleus in the anterior segment rather than the posterior chamber.
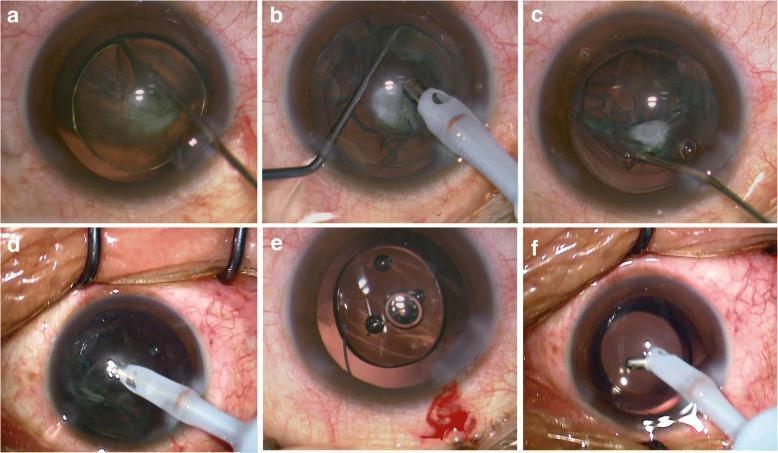
A series of six clinical photographs (a-f) documenting intraoperative stages of cataract surgery and intraocular lens (IOL) implantation. (a) Displays a 'golden ring' reflex indicating hydrodelineation, separating the lens nucleus from the epinucleus. (b) Demonstrates phacoemulsification using the phaco-chop technique to fragment the nucleus while maintaining the posterior capsular cataract (PPC) and epinucleus. (c) Shows OVD-assisted hydrodissection, where viscoelastic material is used to lift the PPC from the posterior capsule. (d) Illustrates the irrigation/aspiration phase for the removal of the remaining epinuclear and PPC material. (e) Details the surgical management of a posterior capsular rupture, showing a 3-piece acrylic IOL implanted into the ciliary sulcus for stable fixation. (f) Shows a standard 1-piece acrylic IOL successfully positioned within the intact capsular bag. This educational sequence highlights diagnostic landmarks, surgical maneuvers for complex cataracts, and complication management in ophthalmology.
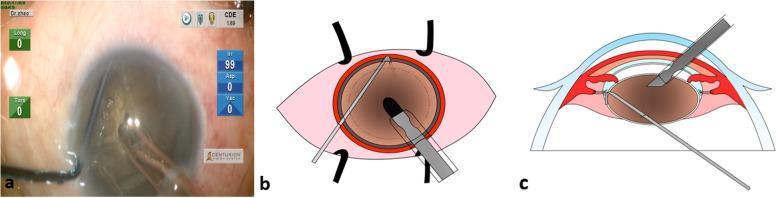
Educational panel illustrating the initial step of a phacoemulsification procedure for cataract surgery, consisting of an intraoperative screenshot (a) and corresponding schematic diagrams in front (b) and lateral (c) views. The visuals demonstrate the 'embedding' technique where a phaco tip, protected by a sleeve, is inserted through a circular capsulorhexis (rhexis) into the lens nucleus. The entry point of the metallic phaco tip is positioned slightly axial to the rhexis margin, allowing the distal end of the tip to penetrate toward the central, densest portion of the brown, opaque nucleus. The diagrams clearly delineate the anatomical relationships between the cornea, iris, anterior capsule opening, and the lens. This visual guide is designed for ophthalmology trainees to understand the spatial orientation and instrument depth required to achieve firm holdability of a dense cataract nucleus prior to mechanical chopping. The lateral schematic (c) specifically highlights the angle of approach, ensuring the tip remains within the safe margins of the lens to avoid posterior capsule rupture.
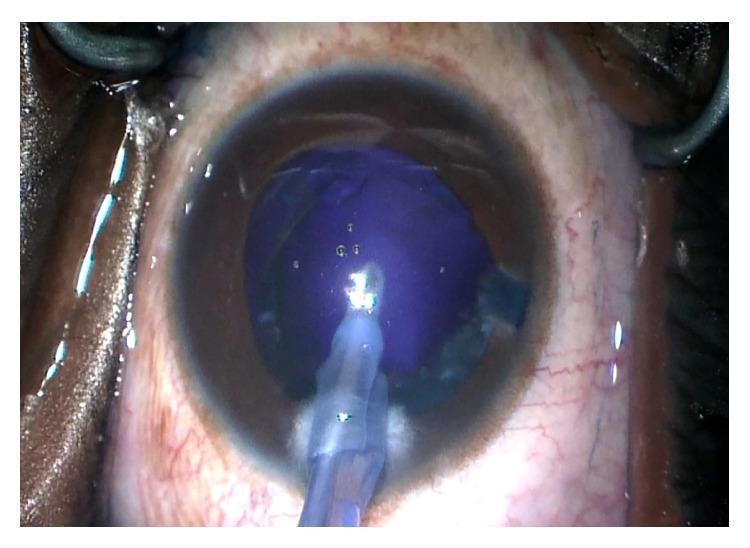
This clinical photograph captures a surgical view of the anterior segment during cataract surgery, specifically after the removal of the lens cortex. The image shows the eye with the cornea and sclera visible, and the surgical field is maintained by a speculum. Within the dilated pupil, the posterior capsule is prominently visible and exhibits a distinct deep blue hue, likely due to unintended Trypan Blue staining. The typical red reflex is notably absent. An irrigation and aspiration (I/A) handpiece is positioned centrally within the anterior chamber, used to clear cortical material. Tiny air bubbles are present on the surface of the capsule or within the viscoelastic material. The image illustrates a specific intraoperative finding where the dye, intended only for the anterior capsule, has reached the posterior capsule, facilitating its visualization during the final stages of phacoemulsification.
posterior polar cataract OCT anterior segment preoperative assessment posterior capsule defect
![This diagnostic image shows an Anterior Segment Optical Coherence Tomography (AS-OCT) scan of a human eye, specifically focusing on the crystalline lens morphology. The scan provides a cross-sectional grayscale view of the anterior chamber, including the iris and the lens. Overlaid on the raw OCT data are orange biometric tracing lines used to calculate the curvature of the lens capsules. Quantitative measurements displayed in green text indicate an anterior capsule curvature radius (AR) of 14.962 mm and a significantly steeper posterior capsule curvature radius (PR) of 5.479 mm within the 4 mm central zone. Orientation markers '180 (N)' and '0 (T)' denote the nasal and temporal axes, while 'Decentration 0.000 [mm]' confirms the alignment of the measurement. This type of imaging is essential in ophthalmology for pre-operative cataract assessment, intraocular lens (IOL) power calculations, and the study of accommodative changes in the crystalline lens. The educational focus is on anterior segment biometry and the anatomical distinction between the relatively flat anterior lens surface and the highly convex posterior surface.](https://cdn.orris.care/cdss_images/pmc_clinical_VQA_db39357922bb45f953f2c05e9a4253604abcd17c4aa679598dbe544d8fc7dd6b.jpg)
This diagnostic image shows an Anterior Segment Optical Coherence Tomography (AS-OCT) scan of a human eye, specifically focusing on the crystalline lens morphology. The scan provides a cross-sectional grayscale view of the anterior chamber, including the iris and the lens. Overlaid on the raw OCT data are orange biometric tracing lines used to calculate the curvature of the lens capsules. Quantitative measurements displayed in green text indicate an anterior capsule curvature radius (AR) of 14.962 mm and a significantly steeper posterior capsule curvature radius (PR) of 5.479 mm within the 4 mm central zone. Orientation markers '180 (N)' and '0 (T)' denote the nasal and temporal axes, while 'Decentration 0.000 [mm]' confirms the alignment of the measurement. This type of imaging is essential in ophthalmology for pre-operative cataract assessment, intraocular lens (IOL) power calculations, and the study of accommodative changes in the crystalline lens. The educational focus is on anterior segment biometry and the anatomical distinction between the relatively flat anterior lens surface and the highly convex posterior surface.
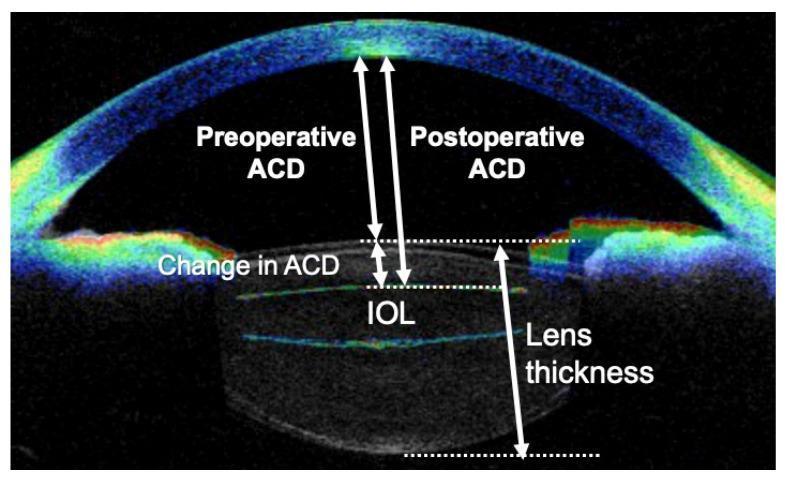
This diagnostic image is an anterior segment optical coherence tomography (AS-OCT) scan of a human eye, specifically capturing a cross-sectional view of the anterior chamber, cornea, and lens. The image serves as a clinical diagram to illustrate biometric changes following cataract surgery. High-contrast annotations and white arrows denote key anatomical measurements: Preoperative Anterior Chamber Depth (ACD) measured from the posterior corneal surface to the anterior lens capsule; Postoperative ACD measured to the anterior surface of the Intraocular Lens (IOL); and the 'Change in ACD' representing the shift in position. Additionally, 'Lens Thickness' is delineated by the distance between the anterior and posterior lens surfaces. The pseudocolor heat map displays the cornea and sclera in shades of blue and green, while the iris and lens structures show varying levels of reflectivity. This visual is intended for ophthalmic education regarding surgical outcomes, IOL positioning, and anterior chamber morphometry.
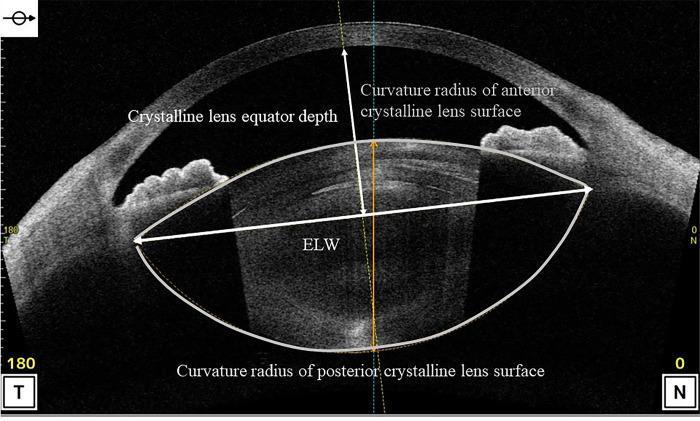
This diagnostic image is an Anterior Segment Optical Coherence Tomography (AS-OCT) cross-section of the human eye, specifically used for preoperative cataract surgery analysis. The image depicts the anatomical structures of the anterior segment, including the curved cornea at the top and the biconvex crystalline lens positioned posteriorly. Key clinical parameters are annotated to describe the lens morphology and spatial relationship to corneal structures. The 'Crystalline lens equator depth' is marked by a vertical arrow extending from the posterior corneal surface (CP) to the equatorial plane. The 'ELW' (Equatorial Lens Width) is represented by a horizontal white line across the widest part of the lens. Additional annotations highlight the 'Curvature radius of anterior crystalline lens surface' and 'Curvature radius of posterior crystalline lens surface,' indicated by solid white arcs outlining the lens boundaries. Orientation markers 'T' (Temporal) and 'N' (Nasal) are visible at the bottom. This image serves as a pedagogical tool for understanding biometric measurements necessary for predicting postoperative intraocular lens (IOL) position and stability.
This composite figure illustrates a surgical sequence for Femtosecond Laser-Assisted Cataract Surgery (FLACS) in a patient with a posterior polar cataract. (a) A preoperative sagittal OCT image shows the characteristic posterior bulge of the lens material toward the posterior capsule, with no visible capsular rupture. (b) Intraoperative photograph shows manual hydrodissection using a cannula to separate the lens from the capsule. (c) Phacoemulsification stage, where a central posterior white plaque is manipulated and flipped anteriorly for safe removal. (d) Post-extraction view demonstrating an intact posterior capsule with remnant pigmented dots and a localized surgical scar (arrow) from adhesion removal. (e) Successful implantation of a posterior chamber intraocular lens (PC-IOL) within the intact capsular bag. (f) A one-month post-operative retroillumination photograph showing residual posterior stippling that does not affect visual acuity. This educational series highlights the surgical precautions and diagnostic imaging necessary to manage the risk of posterior capsule rupture in polar cataract cases.
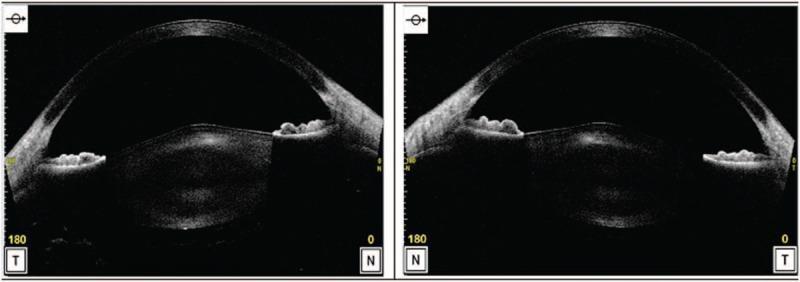
Diagnostic Image: Anterior segment optical coherence tomography (AS-OCT) cross-sections of the right eye (left panel) and left eye (right panel). The images demonstrate bilateral anterior lenticonus, characterized by a distinct conical or globular protrusion of the central anterior lens surface into the anterior chamber. The overlying cornea maintains a relatively normal curvature, and the anterior chamber depth is visible. Within the lens substance, there are hyperreflective areas, particularly in the posterior cortex, consistent with posterior subcapsular cataract. These findings are pathognomonic clinical markers for Alport Syndrome (AS). The AS-OCT provides a high-resolution morphological assessment of the lens capsule and cortex, illustrating the localized thinning and outward bulging of the lens capsule. This diagnostic imaging is essential for ophthalmology education regarding hereditary basement membrane disorders and the surgical planning for lenticonus-related visual impairment.
Medical educational diagram of posterior polar cataract anatomy and pathology. Show two panels: LEFT PANEL - Cross section of eye lens showing posterior polar cataract: label anterior capsule, anterior cortex, nucleus, posterior cortex, posterior subcapsular zone, posterior capsule. Show a dense white circular plaque at the posterior pole labeled 'Posterior polar opacity'. Show thinned/absent posterior capsule beneath the plaque (dashed line = deficient capsule). Show Mittendorf dot as small dot on posterior capsule. Arrows pointing to: 1) adherent opacity, 2) preexisting posterior capsule defect, 3) surrounding concentric rings. RIGHT PANEL - Retroillumination appearance: circular red background with dark central opacity at posterior pole showing 'bull's eye' or 'ring' pattern with concentric lamellar rings around the central dense white plaque. Label: central dense nucleus, surrounding cortical rings, clear periphery. Color coded anatomical illustration style, clean white background, clear medical labels.
Medical surgical diagram showing steps for safe phacoemulsification in posterior polar cataract. 6 step illustrated panels labeled A-F: A) Capsulorhexis - larger 5.5mm CCC shown B) NO hydrodissection - showing cannula avoiding posterior plaque, fluid wave diverted laterally (red X over hydrodissection, green check over hydrodelineation only) C) Hydrodelineation - golden ring sign visible, separating epinucleus from nucleus D) Nucleus prolapse into anterior chamber using viscoelastic cushion E) Phacoemulsification of nucleus in anterior chamber, away from posterior capsule F) Careful cortex aspiration leaving posterior plaque, then viscoelastic injection to float plaque off posterior capsule Include warning labels: 'Avoid hydrodissection - risk of hydraulic rupture', 'Hydrodelineation preferred'. Clean medical illustration, color-coded steps, white background.
POSTERIOR POLAR CATARACT
Postgraduate Theory Answer (Long Question)
INTRODUCTION AND DEFINITION
- The opacity is adherent to or incorporated within the posterior capsule
- There is frequently a pre-existing posterior capsular defect beneath the plaque
- It carries the highest risk of posterior capsule rupture (PCR) of any cataract type during phacoemulsification
- It demands a completely different surgical strategy compared to routine cataract surgery
"Posterior polar cataract is often closely integrated with the lens capsule and/or a pre-existing defect, with a very high risk of dehiscence during surgery." - Kanski's Clinical Ophthalmology, 10th Edition
PART I: EMBRYOLOGY AND PATHOGENESIS
Normal Posterior Capsule Development
Pathogenesis of PPC
-
Persistence of posterior tunica vasculosa lentis (TVL) - During embryonic development, the TVL regresses completely by the 7th month of gestation. Persistence of the posterior vascular layer at the site of the hyaloid artery attachment leads to:
- Traction on the posterior capsule
- Secondary capsular thinning or frank deficiency
- Progressive opacity formation in the posterior subcapsular cortex
-
Mittendorf dot - A white dot slightly nasal and below the posterior pole, representing the remnant of the hyaloid artery attachment point. This is distinct from PPC but may co-exist.
-
Primary capsular weakness - In hereditary cases, a structural defect in type IV collagen (COL4A1/COL4A2) or crystallin proteins leads to primary capsular thinning and secondary opacity.
-
The net result: the opacity is not merely adherent to but is structurally part of the posterior capsule at the plaque site.
PART II: CLINICAL FEATURES
A. Slit-Lamp Appearance
- Dense white, well-circumscribed discoid plaque at the posterior pole
- Located at the geometric center of the lens, immediately anterior to the posterior capsule
- May have a central "mother-of-pearl" or "white chalk-like" appearance
- Overlying lens is usually clear - nucleus and cortex transparent
- Central dark shadow obscuring the red reflex at the posterior pole
- Characteristic "bull's-eye" or "ring" pattern - concentric lamellar rings (cortical extensions) surrounding the central dense plaque
- The rings represent secondary cortical changes spreading concentrically from the primary opacity
- Plaque may appear darker (denser) or lighter depending on degree of cortical involvement
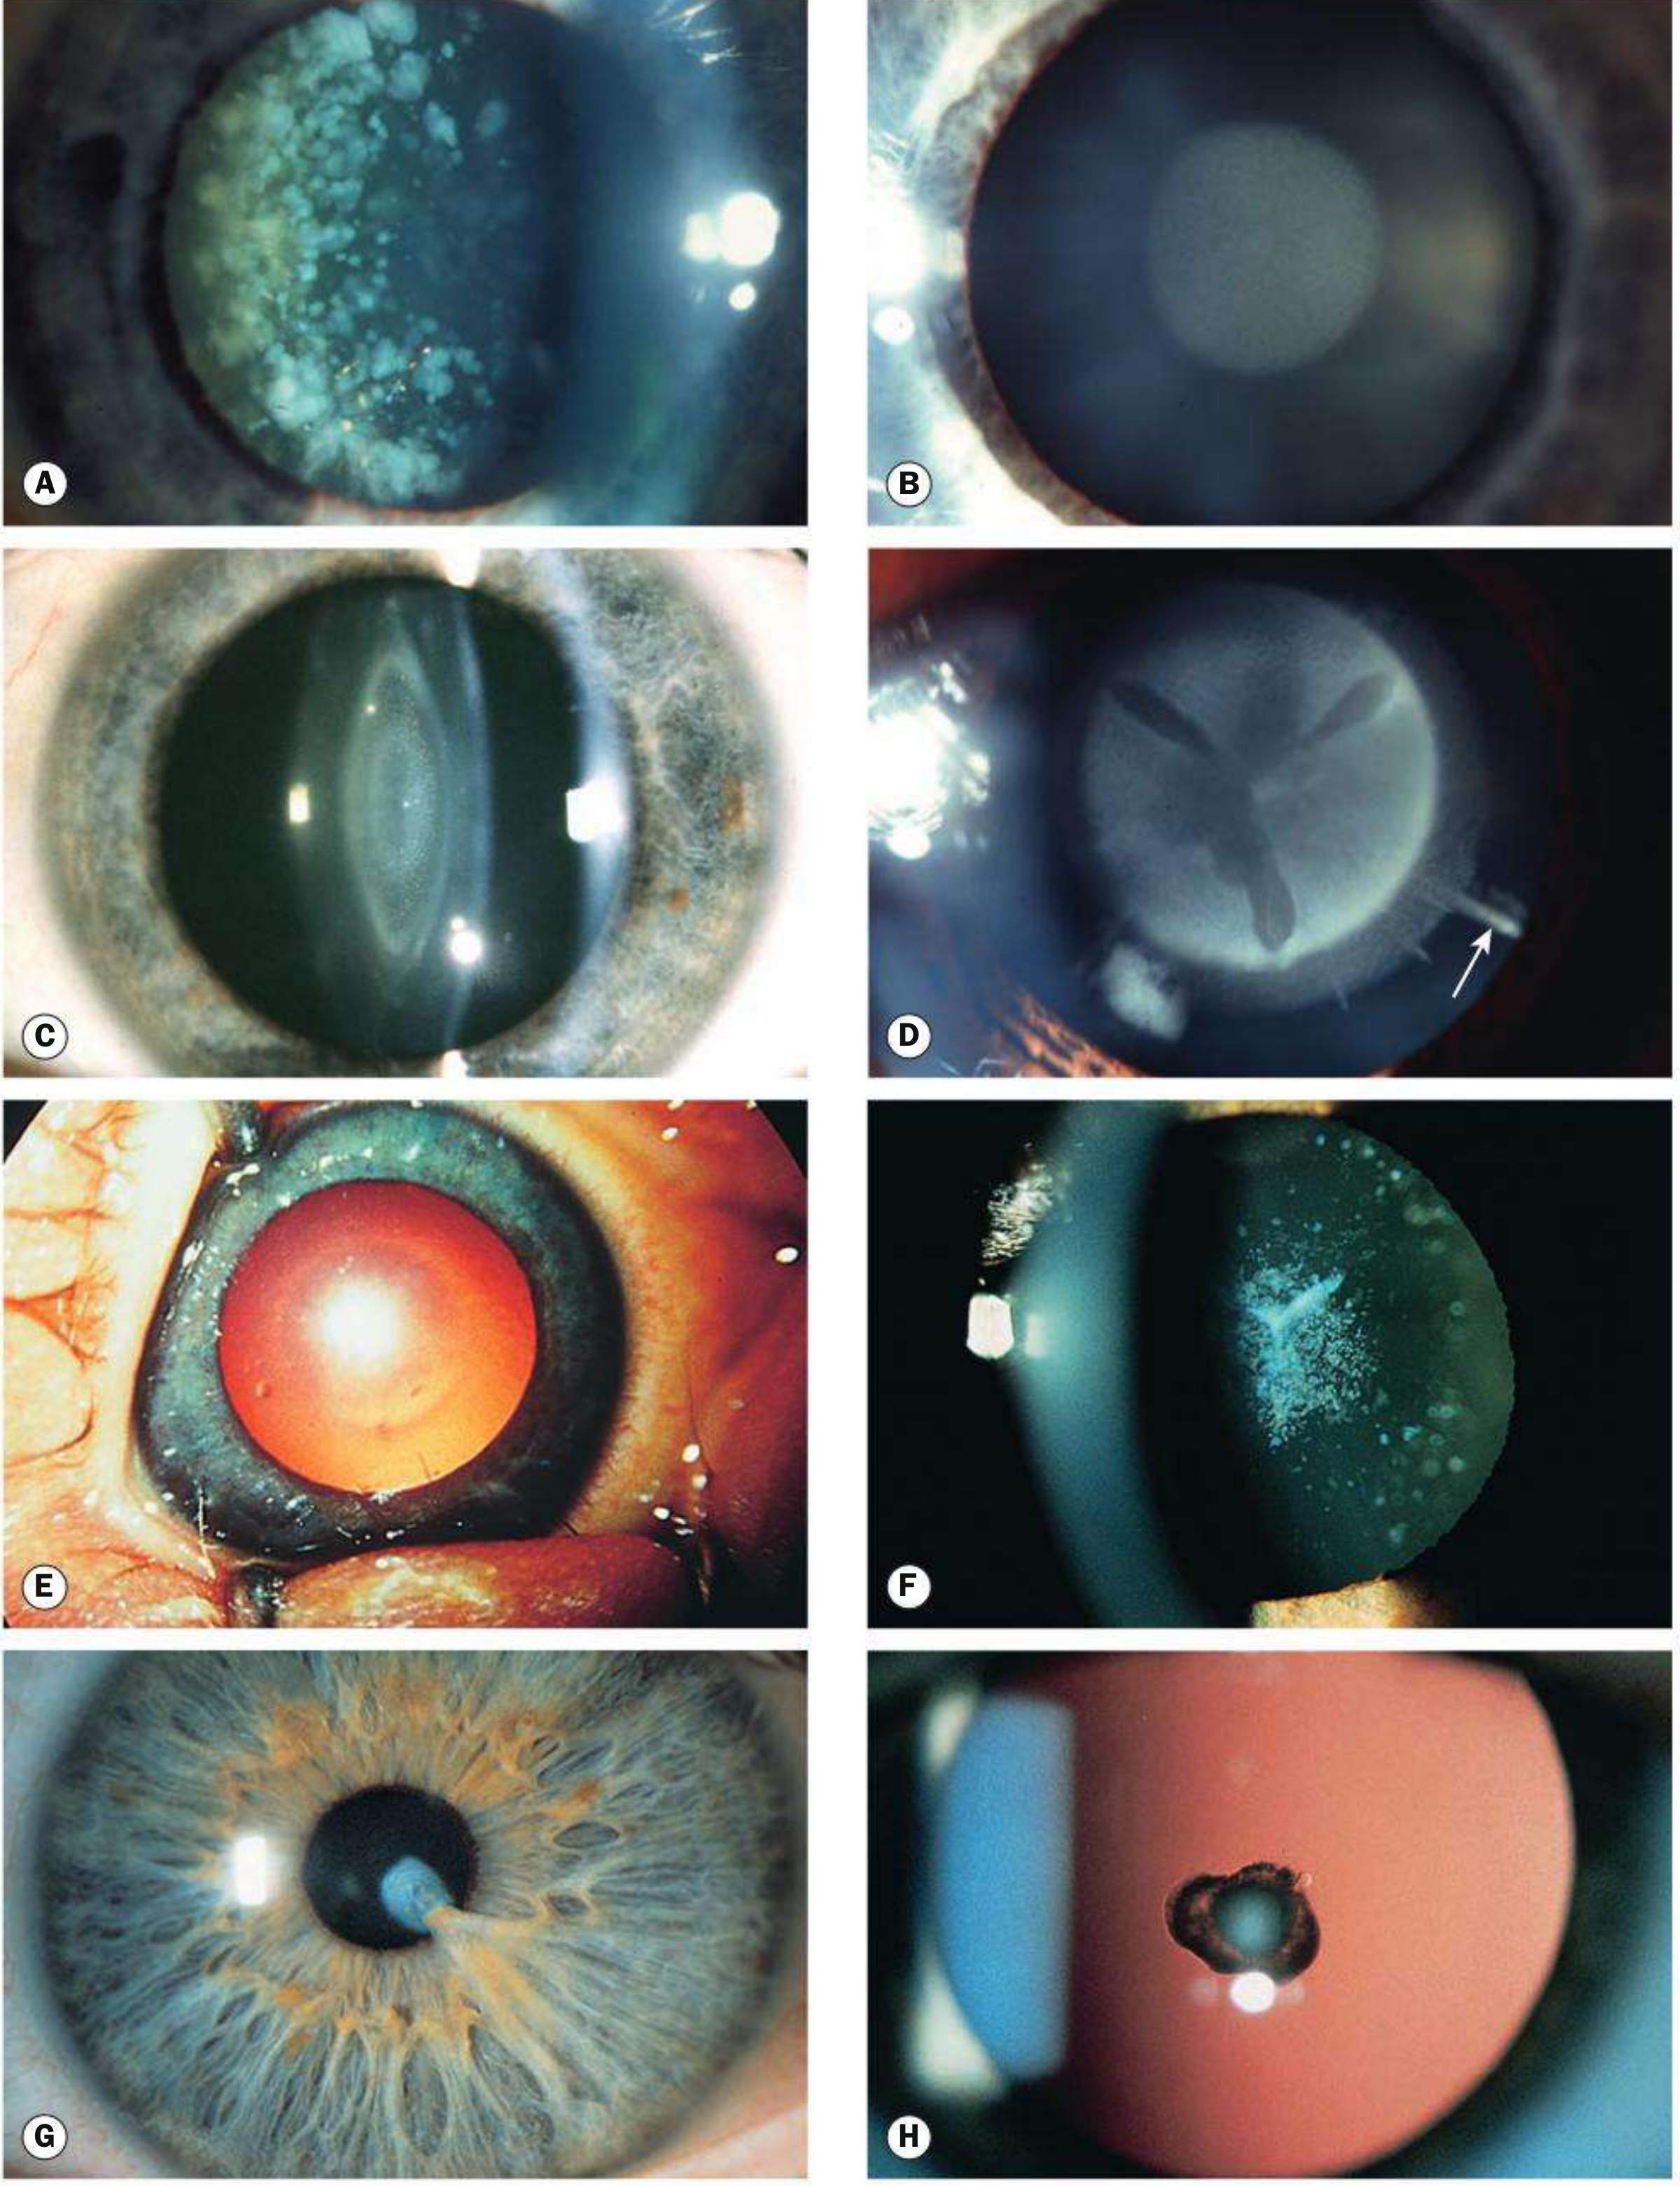
B. Visual Symptoms
- Early visual impairment even with small opacity, due to axial location
- Glare - marked in bright light (opacity at nodal point)
- Blurred central vision - affects near and distance equally
- Reduced contrast sensitivity - often disproportionate to Snellen acuity
- Monocular diplopia - if concentric rings scatter light along multiple foci
- Amblyopia - in childhood onset, especially if unilateral
C. Associated Ocular Features (Kanski, Khurana)
| Association | Comment |
|---|---|
| Posterior lenticonus | Posterior bulging of the capsule; may co-exist with PPC |
| Mittendorf dot | Remnant of hyaloid artery; seen nasally below posterior pole |
| Persistent fetal vasculature (PFV) | Extensive form; may have retrolental fibrovascular membrane |
| High myopia | Due to stretched, thin posterior capsule |
| Posterior coloboma | Rare association |
| Peters anomaly | Anterior segment dysgenesis, rarely associated |
PART III: CLASSIFICATION
A. By Morphology / Severity
- Dense central white discoid plaque at the posterior pole
- Sharply demarcated, no concentric rings
- Usually < 4 mm diameter
- Most common form
- Posterior capsule beneath plaque is thin/absent in ~60-75% of cases
- Central plaque + concentric lamellar cortical rings extending peripherally
- "Rosette" or "bull's eye" appearance on retroillumination
- Rings represent secondary cortical liquefaction and extension
- Larger opacity, more visual impact
- Higher risk of spontaneous progression
- PPC associated with posterior lenticonus
- Posterior bulging of the capsule (posterior lenticonus) + opacity at the bulge
- Seen in Alport syndrome
- Very thin, abnormal posterior capsule
- Highest risk of surgical complications
- PPC in the setting of persistent fetal vasculature
- Fibrovascular tissue extends from vitreous to posterior capsule
- Associated with leukocoria, microphthalmos
- Poor visual prognosis due to associated posterior segment anomalies
B. By Aetiology
| Category | Examples |
|---|---|
| Congenital idiopathic | Most common; sporadic, no systemic association |
| Hereditary | Autosomal dominant (most common), AR, X-linked |
| Syndromic/Systemic | Alport syndrome (anterior lenticonus + PPC), Nance-Horan syndrome, Lowe syndrome |
| Associated with PFV | Persistence of posterior TVL, Mittendorf dot variant |
| Traumatic | Blunt trauma causing posterior subcapsular opacity |
| Drug-induced | Corticosteroid-induced PSC (mimics PPC morphologically) |
C. By Genetics (Duke-Elder, Khurana)
| Gene | Protein | Inheritance | Notes |
|---|---|---|---|
| PITX3 | Paired-like homeodomain TF | AD | Isolated PPC or with anterior segment dysgenesis |
| CRYAA | Alpha-A crystallin | AD/AR | Multiple lens opacity types including PPC |
| CRYAB | Alpha-B crystallin | AD | PPC; also associated with DCM (dilated cardiomyopathy) |
| CRYBB2 | Beta-B2 crystallin | AD | PPC; chromosome 22q11 |
| COL4A1 | Type IV collagen alpha-1 | AD | Basement membrane protein; thin/defective posterior capsule |
| NHS | Nance-Horan syndrome | X-linked | Males severely affected; carriers have Y-suture opacities |
| GJA3 | Connexin 46 | AD | Nuclear and polar cataracts |
| TMEM114 | Transmembrane protein | AD | Posterior polar cataract locus 14q24 |
Key genetic principle (Duke-Elder): Autosomal dominant inheritance with high penetrance is the most common genetic pattern. There is significant genetic heterogeneity - same gene can produce different morphology, and same morphology can arise from different genes.
D. By Progression
- Stationary (~40-50%): Opacity remains the same size for years to decades; discovered incidentally
- Progressive (~50-60%): Central plaque enlarges with increasing concentric cortical rings; visual deterioration follows
PART IV: INVESTIGATIONS
1. Slit-Lamp Biomicroscopy
- Most important investigation
- Assess: size of plaque, concentric rings, clarity of overlying nucleus and cortex
- Note: whether posterior capsule is visible/intact beneath opacity
- Rule out: posterior lenticonus, PFV, vitreous remnant
2. Anterior Segment OCT (AS-OCT)
- Investigation of choice for preoperative surgical planning
- Can directly visualize:
- Posterior capsule integrity beneath the plaque
- Degree of posterior capsule thinning or defect
- Adherence of opacity to capsule
- Posterior bulge (lenticonus)
- OCT-guided decisions on hydrodissection vs. hydrodelineation strategy
3. B-scan Ultrasonography
- If fundus not visible
- Rule out: persistent fetal vasculature, retinal detachment, PHPV
4. Visual Evoked Potential (VEP)
- Assess visual potential especially in children/infants
5. Scheimpflug Imaging (Pentacam)
- Density map of the lens
- Useful in quantifying opacity and planning surgical approach
6. Family history and genetic screening
- Document inheritance pattern
- Genetic testing for CRYAA, CRYAB, PITX3, COL4A1 in hereditary cases
- Screen siblings and parents
PART V: SURGICAL MANAGEMENT
Preoperative Preparation
-
Informed consent - must specifically mention:
- High risk of posterior capsule rupture (PCR: ~25-35% vs. ~0.5-1% in routine cataract)
- Possible vitreous loss
- Possible need for anterior vitrectomy
- Possible sulcus IOL placement (vs. in-the-bag)
- Risk of dropped nucleus if PCR occurs
- Possible second surgery (PPV, IOL exchange)
-
Pupil dilation - maximum possible (2-3 dilating agents)
-
Surgeon experience - should be performed by experienced phaco surgeons only; not a case for trainees
-
Equipment ready - vitrectomy machine set up and primed; extra OVD (viscoelastic); sulcus IOL available
Surgical Technique (Step by Step)
Step 1: Corneal Incisions
- Standard clear corneal or scleral tunnel incisions
- Side-port incision - 2 ports for bimanual maneuvers if needed
Step 2: Capsulorhexis (CCC - Continuous Curvilinear Capsulorhexis)
- Larger than usual CCC: 5.5-6.0 mm (vs. standard 5-5.5 mm)
- Larger CCC allows:
- Better visualization of posterior pole during surgery
- Easier prolapse of nucleus into AC
- Safer cortical aspiration near the posterior plaque
- Captures IOL edge better if sulcus placement needed
Step 3: THE CRITICAL STEP - Hydrodissection vs. Hydrodelineation
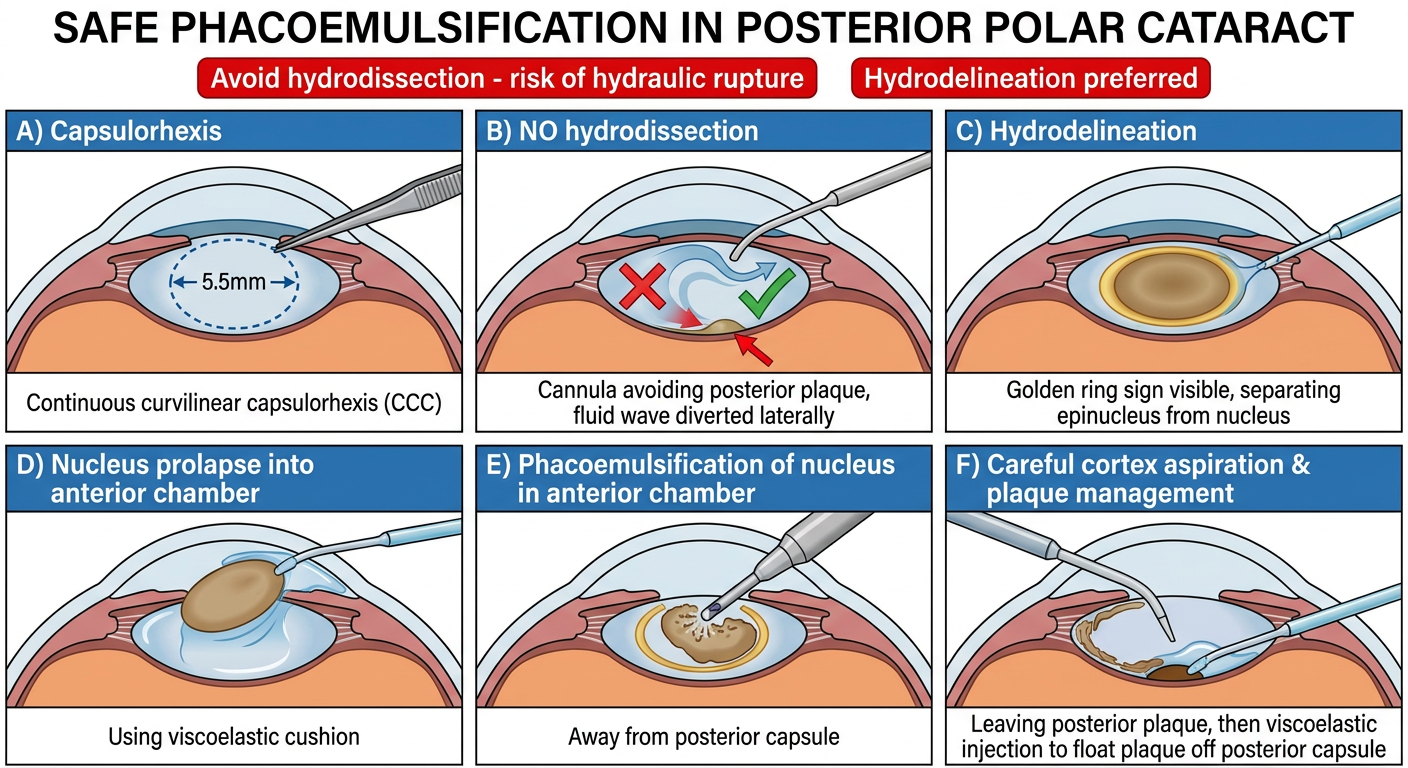
- In a normal lens, hydrodissection cleaves the lens-capsule interface, freeing the nucleus
- In PPC, the opacity is adherent to/embedded in the posterior capsule
- A fluid wave driven posteriorly (hydrodissection) will:
- Hit the adherent plaque-capsule complex
- Build up pressure (hydraulic pressure) behind the plaque
- Blow out the posterior capsule (hydraulic rupture) - the "squirt gun" mechanism
- This can happen with even a single, seemingly gentle injection of BSS
"No hydrodissection - this is the cardinal rule in PPC surgery." (Vasavada & Singh; Khurana)
- Fluid injected into the substance of the nucleus (mid-peripheral cortex), creating a cleavage plane between the nucleus and epinucleus (NOT between nucleus and capsule)
- Creates a "golden ring" sign - a circular golden reflex visible at the plane of delineation
- The epinucleus remains as a protective cushion around the posterior plaque during nuclear removal
- The posterior plaque and adhered capsule are left undisturbed until the very end
Step 4: Nuclear Removal
- Do NOT emulsify the nucleus in the posterior chamber (too close to adherent plaque)
- Prolapse the nucleus into the anterior chamber first using viscoelastic:
- Fill the bag with OVD (Healon GV or similar cohesive OVD)
- Use a nucleus rotator/spatula to tilt and prolapse the nucleus into the AC
- Once in AC, nucleus is now safely away from the posterior capsule
- Emulsify in the anterior chamber using chop technique or divide-and-conquer
- Low vacuum, low flow settings to minimize turbulence near posterior capsule
Step 5: Epinuclear Shell and Cortex Removal
- The epinuclear bowl is left intact - it protects the posterior capsule from the phaco tip
- Remove epinucleus carefully with low vacuum I/A
- Aspirate cortex circumferentially, avoiding the posterior plaque
- Leave a generous OVD cushion under the posterior capsule at all times
Step 6: Managing the Posterior Plaque
- OVD injected under the plaque lifts it off the posterior capsule
- Plaque aspirated with low vacuum (or removed with forceps)
- Posterior capsule intact - proceed to IOL implantation in bag
- Inject OVD (viscoelastic) BETWEEN the plaque and the posterior capsule
- The hydrostatic cushion lifts the plaque off the capsule
- Peel the plaque off the capsule with a Sinskey hook or I/A tip
- Very gentle, controlled movement - do NOT pull or tug
- If plaque lifts successfully: IOL in-the-bag
- STOP all fluidics immediately
- Fill the eye with OVD
- Proceed as per PCR management protocol (see Complications below)
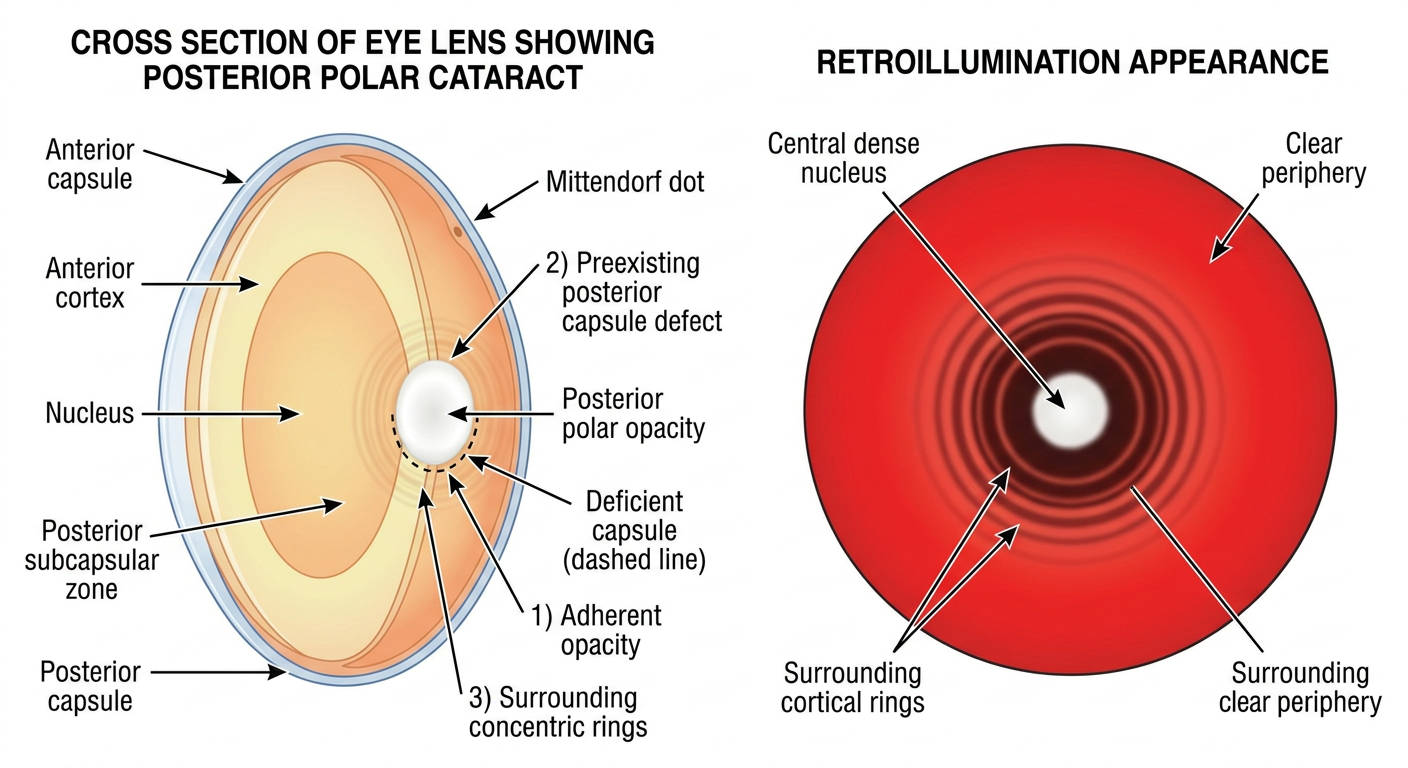
Step 7: IOL Implantation
- In-the-bag: if posterior capsule intact after plaque removal
- Sulcus: if small PCR with intact anterior vitreous face; use 3-piece IOL
- ACIOL or iris-claw: if large PCR with vitreous prolapse
PART VI: COMPLICATIONS
A. Intraoperative Complications
1. POSTERIOR CAPSULE RUPTURE (PCR) - THE MOST FEARED COMPLICATION
| Mechanism | Trigger | Prevention |
|---|---|---|
| Hydraulic rupture | Hydrodissection in adherent PPC | Avoid hydrodissection completely |
| Traction rupture | Excessive nuclear rotation tearing adhered plaque | Gentle maneuvers; OVD before rotation |
| Aspiration rupture | I/A tip engaging pre-existing capsular defect | Low vacuum; avoid posterior pole during aspiration |
| Spontaneous | Pre-existing posterior capsule defect opens | AS-OCT preoperatively to identify defect |
- Sudden loss of red reflex
- Iris prolapse
- Deepening of anterior chamber
- Nucleus tilting or dropping posteriorly
- Vitreous visible at pupil margin (Vitreous strands = "chandelier sign")
- STOP phacoemulsification immediately
- Fill eye with OVD (cohesive - Healon)
- Do NOT hydrate the wound - prevents vitreous prolapse
- If nucleus partially dropped: use OVD to float it anteriorly; consider fragmentome or limbal vitrectomy approach
- Anterior vitrectomy if vitreous prolapse has occurred:
- Bimanual or single-port vitrectomy
- Cut vitreous (never aspirate/pull)
- Stain with triamcinolone (Kenacort) to visualize vitreous strands
- IOL placement based on residual capsular support:
- Intact anterior capsular rim + >50% posterior capsule: in-the-bag IOL
- Intact anterior rim + torn posterior capsule: 3-piece sulcus IOL
- No capsular support: ACIOL, iris-fixated, scleral-fixated IOL
- Posterior vitrectomy: if nucleus dropped into vitreous (referred to vitreoretinal surgeon)
2. VITREOUS LOSS
- Occurs with PCR
- Must be managed with anterior vitrectomy
- Unclean vitrectomy leads to: vitreous wick syndrome, cystoid macular edema (CME), retinal detachment
3. DROPPED NUCLEUS
- If large PCR + inadequate OVD support
- Nucleus or nuclear fragment falls into vitreous cavity
- Requires pars plana vitrectomy (PPV) by vitreoretinal surgeon
- Major complication - endophthalmitis, retinal detachment risk
4. ZONULAR DEHISCENCE
- In Alport syndrome with generalized basement membrane weakness
- Marfan syndrome with PPC variant
- Manage with capsular tension ring (CTR) + careful surgery
B. Early Postoperative Complications
| Complication | Mechanism | Management |
|---|---|---|
| Corneal edema | Extended surgical time, vitreous loss | Topical steroids, hypertonic saline |
| Elevated IOP | OVD retention, hyphema | Anterior chamber washout if needed; anti-glaucoma drops |
| Uveitis | Cortical remnants, vitreous loss | Intensive topical steroids |
| Hyphema | Iris trauma during vitrectomy | Observation; AC washout if >4mm |
| IOL decentration | Sulcus placement without adequate haptic support | Refixation surgery |
| CME (Cystoid Macular Edema) | Vitreous loss, vitreoretinal traction | NSAIDs + topical steroids for 3 months |
| Endophthalmitis | Vitreous wick syndrome | Urgent intravitreal antibiotics |
C. Late Postoperative Complications
1. Posterior Capsule Opacification (PCO)
- More common after PPC surgery than routine cataract surgery
- Reasons: residual plaque material, lens epithelial cells (LECs) proliferating from edges
- Treatment: Nd:YAG laser posterior capsulotomy
- Caution: If IOL in sulcus, Nd:YAG may cause zonular damage or IOL decentration
2. Retinal Detachment (RD)
- Particularly if PCR + vitreous loss occurred intraoperatively
- Young patients with PPC have lattice degeneration (association with high myopia)
- Incidence of RD after PCR ≈ 3-8% vs. <0.1% in uncomplicated surgery
- Preoperative peripheral retinal examination mandatory; treat any breaks before cataract surgery
3. Amblyopia
- In childhood PPC: deprivation amblyopia is the major long-term challenge
- Aggressive anti-amblyopia therapy post-surgery
- Visual prognosis depends on timing of surgery and patching compliance
4. Glaucoma
- Vitreous in AC → blockage of trabecular meshwork
- Cortical remnants → phacolytic/phacoanaphylactic glaucoma
- Monitor IOP long-term
5. CME (Late)
- Chronic CME if vitreous wick persists
- OCT macula essential at 6-12 weeks postoperatively
PART VII: SPECIAL CONSIDERATIONS
PPC in Children
- Higher rate of PCR due to thin sclera, positive vitreous pressure, small eye
- Posterior capsulectomy + anterior vitrectomy often done primarily (especially in infants)
- Amblyopia treatment is the dominant long-term challenge
- Contact lens or glasses immediately post-surgery
PPC in Alport Syndrome
- Anterior lenticonus (pathognomonic) + PPC + renal failure + sensorineural deafness
- Capsule structurally abnormal (COL4A3/COL4A4/COL4A5 mutations) = greatly elevated PCR risk
- Multidisciplinary approach (nephrology, ENT, ophthalmology)
PPC with High Myopia
- Additional challenge: thin posterior capsule from myopic axial elongation
- Scleral indentation technique for vitreous dissection if dropped nucleus
- IOL power calculation (longer axial length) needs Holladay 2 / Barrett formula
PPC - Role of Femtosecond Laser
- Femtosecond laser (FEMTO-FLACS) can create precise CCC with no surge
- Does NOT overcome the problem of adherent posterior plaque
- Hydrodelineation still mandatory
- Some evidence that FEMTO may reduce PCR rates in PPC (Schultz et al.)
PART VIII: DIFFERENTIAL DIAGNOSIS
| Condition | Distinguishing Feature |
|---|---|
| PSC (Posterior Subcapsular Cataract) | Drug-induced/metabolic; PSC is NOT adherent to capsule; spreads anteriorly; granular "breadcrumb" appearance |
| Posterior lenticonus | Bulging of posterior capsule WITHOUT necessarily having overlying opacity; oil-droplet reflex |
| Persistent Fetal Vasculature | Fibrovascular strand from retina to lens; associated microphthalmos |
| Mittendorf dot | Tiny, stationary, nasally displaced dot; no visual significance; no ring pattern |
| Peters anomaly | Associated anterior segment pathology, corneal clouding |
| Coats disease | Retinal telangiectasia; unilateral; male; white reflex from retina not lens |
| Retinoblastoma | Leukocoria; calcification on B-scan; urgent |
PART IX: PROGNOSIS
- Visual prognosis in adults: generally good if surgery uncomplicated; VA 6/6 achievable
- If PCR occurs: prognosis depends on whether vitreous loss/nucleus drop occurred; worse if retinal detachment develops
- In children: prognosis guarded; depends on amblyopia treatment compliance and age at surgery
- Hereditary PPC: non-progressive in most; good prognosis if surgery timed appropriately
SUMMARY - KEY EXAMINATION POINTS
| Fact | Answer |
|---|---|
| Most important rule in PPC surgery | Avoid hydrodissection |
| Why avoid hydrodissection? | Hydraulic rupture of the adhered posterior capsule |
| Alternative to hydrodissection | Hydrodelineation (golden ring sign) |
| Most feared complication | Posterior capsule rupture (PCR) incidence 25-36%) |
| Kanski's description | "Often closely integrated with the lens capsule and/or a pre-existing defect, with a very high risk of dehiscence during surgery" |
| Best investigation before surgery | Anterior segment OCT (AS-OCT) |
| Most common inheritance | Autosomal dominant |
| Most important gene | CRYAB, PITX3, COL4A1 |
| Associated with systemic disease | Alport syndrome (COL4A3/4/5), CRYAB → dilated cardiomyopathy |
| IOL choice if small PCR | 3-piece IOL in sulcus |
| Late complication requiring vigilance | Retinal detachment, CME, PCO |
| What is "bull's eye" / ring pattern? | Central plaque + concentric lamellar cortical rings on retroillumination |
- Kanski's Clinical Ophthalmology 10th Ed. - Brad Bowling, Chapter 10, p. 352-354
- Khurana AK - Comprehensive Ophthalmology 6th Ed., Chapter 7: Diseases of the Lens
- Duke-Elder SS - System of Ophthalmology Vol. III (Embryology) and Vol. XI (Diseases of the Lens)
- The Wills Eye Manual 8th Ed. - Chapter on Pediatric Lens Opacities
- Vasavada AR, Singh R - Phacoemulsification in eyes with posterior polar cataract, J Cataract Refract Surg 1999;25:238-45
- Osher RH, Yu BC, Koch DD - Posterior polar cataracts: a predisposition to intraoperative posterior capsular rupture, J Cataract Refract Surg 1990;16:157-162
- Khanna R, Sharma N - Surgical management of posterior polar cataract, Indian J Ophthalmol 2022