
genetic human diseases and mendelian disorders
Mendelian genetic disorders classification inheritance patterns 2025
Mendelian inheritance patterns autosomal dominant recessive X-linked pedigree diagram
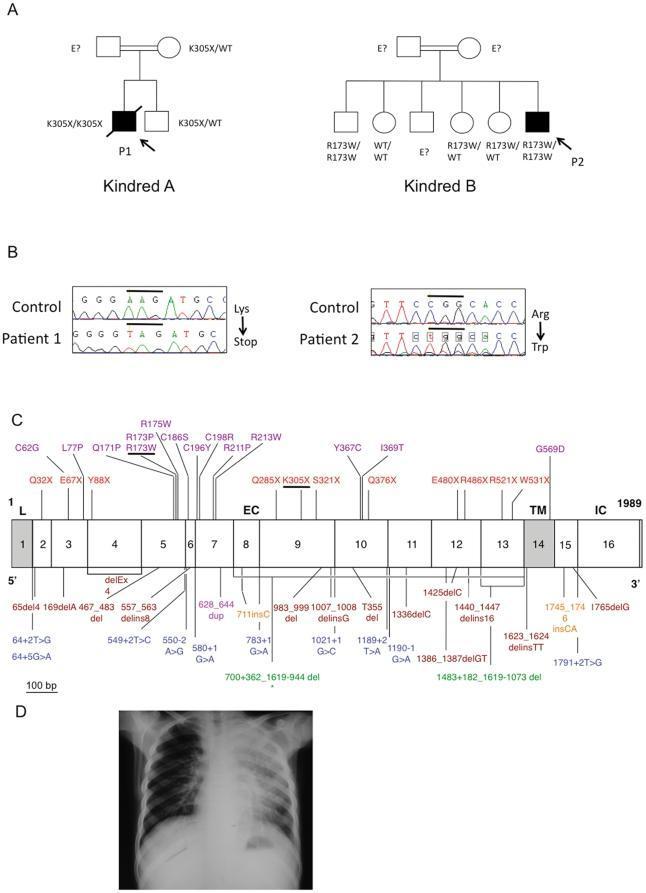
A multi-panel medical figure documenting Mendelian susceptibility to mycobacterial diseases (MSMD) caused by IL12RB1 mutations. Panel A: Pedigree charts for Kindred A and Kindred B showing an autosomal recessive inheritance pattern; affected individuals (black symbols) include probands P1 (K305X homozygote) and P2 (R173W homozygote) with severe Mycobacterium tuberculosis. Panel B: DNA sequencing electrophoregrams for Patients 1 and 2 compared to healthy controls, demonstrating the specific base pair substitutions. Panel C: A comprehensive schematic map of the IL-12R̡1 receptor protein coding region across 17 exons, depicting the leader (L), extracellular (EC), transmembrane (TM), and intracellular (IC) domains. The diagram color-codes various mutation types including missense, nonsense, splicing, and deletions, with the K305X and R173W mutations highlighted. Panel D: An anteroposterior chest X-ray of Patient 1 showing extensive bilateral opacification and consolidation primarily in the upper lobes, indicative of severe pulmonary tuberculosis.
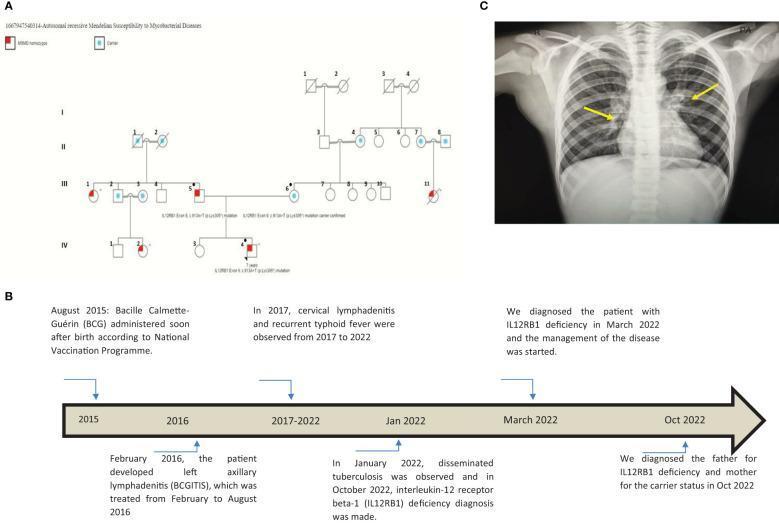
Educational composite image regarding Mendelian susceptibility to mycobacterial disease (MSMD). Panel A is a four-generation pedigree diagram illustrating autosomal recessive inheritance of an IL12RB1 mutation, with affected individuals (red) and carriers (blue dots) identified across lineages. Panel B is a clinical timeline ranging from 2015 to 2022, detailing a patient's progression from BCG vaccination to BCGitis, recurrent typhoid fever, disseminated tuberculosis, and eventual molecular diagnosis of IL12RB1 deficiency. Panel C is a posterior-anterior (PA) chest radiograph of a pediatric patient showing bilateral hilar lymphadenopathy (indicated by yellow arrows) and diffuse bilateral reticular interstitial opacities. Multiple hyperlucencies are visible in the upper and middle lobes bilaterally and the left lower lobe, findings consistent with early bronchiectasis in the context of chronic mycobacterial infection. The diagnostic focus is on primary immunodeficiency leading to severe mycobacterial pathology and associated radiological findings.
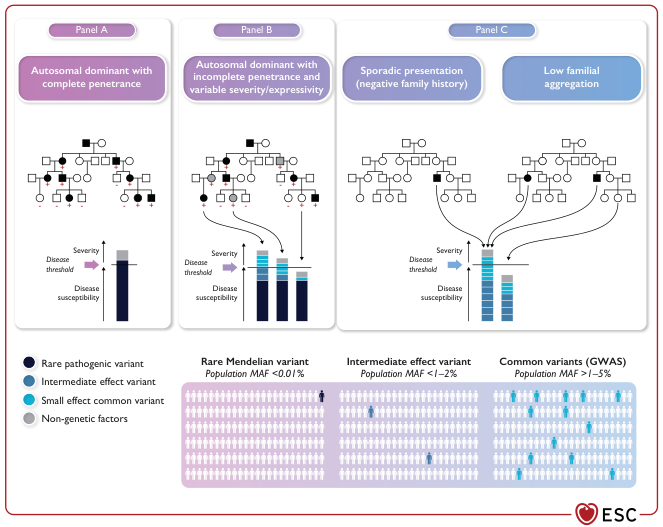
Summary : This figure illustrates the genetic architecture of inherited cardiac conditions, comparing patterns of inheritance, variant types, and disease susceptibility across different scenarios: autosomal dominant with complete penetrance, autosomal dominant with incomplete penetrance/variable expressivity, sporadic presentation, and low familial aggregation. It integrates pedigree diagrams, bar charts of disease susceptibility, and population frequency graphics for rare, intermediate, and common genetic variants. flowchart and schematic diagram: # Panel Structure : • Three main panels: Panel A, Panel B, Panel C. • Panel A: "Autosomal dominant with complete penetrance". • Panel B: "Autosomal dominant with incomplete penetrance and variable severity/expressivity". • Panel C: Two sub-panels: "Sporadic presentation (negative family history)" and "Low familial aggregation". # Pedigree Diagrams : • Each panel contains a pedigree chart with squares (males) and circles (females), filled (affected) and unfilled (unaffected). • Panel A: Multiple affected individuals in each generation, consistent with autosomal dominant inheritance. • Panel B: Some carriers unaffected, variable expressivity and penetrance. • Panel C: Few affected individuals, often only one per family or scattered cases. # Disease Susceptibility Bar Charts : • Each panel shows a vertical bar chart representing "Disease susceptibility" and a "Disease threshold". • Panel A: Single tall bar (rare pathogenic variant) exceeding the threshold. • Panel B: Multiple bars of varying heights (rare, intermediate, common variants, and non-genetic factors) sometimes exceeding the threshold. • Panel C: Several shorter bars (intermediate, common variants, non-genetic factors) collectively exceeding the threshold. # Variant Types and Population Frequency : • Legend for variant types: • Dark blue: Rare pathogenic variant. • Medium blue: Intermediate effect variant. • Light blue: Small effect common variant. • Grey: Non-genetic factors. • Three population frequency graphics: • "Rare Mendelian variant" (MAF <0.01%): Very few individuals affected. • "Intermediate effect variant" (MAF <1–2%): More individuals affected. • "Common variants (GWAS)" (MAF >1–5%): Many individuals affected. # Design Encodings : • Colour-coded bars and pedigree symbols. • Arrows indicating inheritance and contribution to disease susceptibility. • "+" and "–" signs below individuals indicating presence/absence of disease susceptibility. # Analysis : • Panel A shows classic Mendelian inheritance with high penetrance: a single rare pathogenic variant is sufficient for disease. • Panel B demonstrates incomplete penetrance and variable expressivity: disease may require a combination of rare, intermediate, and common variants, plus non-genetic factors. • Panel C illustrates sporadic or low familial aggregation: disease arises from the cumulative effect of multiple common and intermediate variants, often without a strong family history. • The population frequency graphics highlight that rare variants are present in very few individuals, while common variants are widespread but confer lower individual risk. • Overall, the figure emphasizes the spectrum from monogenic to polygenic inheritance in cardiac conditions, with increasing complexity and decreasing familial clustering as variant frequency rises.
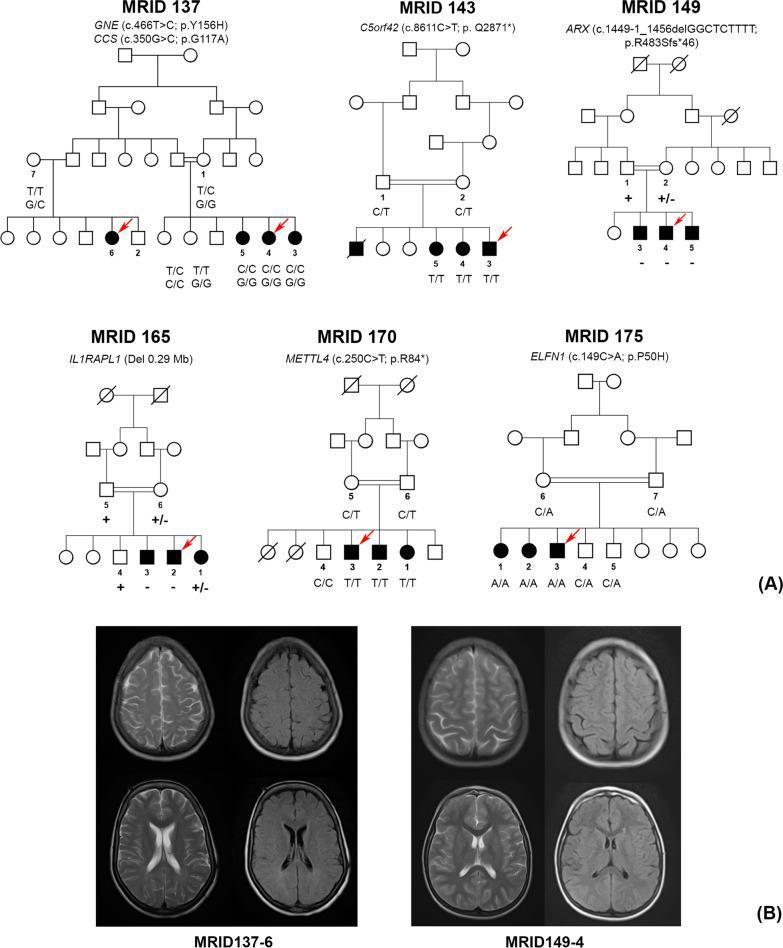
This composite educational image consists of two primary sections: genomic pedigrees (A) and diagnostic neuroimaging (B), relating to intellectual disability research. Section A displays six multi-generational pedigrees (MRID 137, 143, 149, 165, 170, and 175) demonstrating autosomal recessive and X-linked inheritance patterns. Each pedigree includes specific genetic variant notation (e.g., GNE p.Y156H, ARX p.R483Sfs*46) and segregation results for individuals available for study. Red arrows indicate probands selected for whole-exome sequencing. Section B presents axial non-contrast MRI brain scans for patients MRID137-6 and MRID149-4. Both patients exhibit mildly prominent sulci in the parietal regions and age-appropriate ventricular size. In patient MRID137-6, subtle hyperintense lesions are visible in the periventricular white matter on T2-weighted/FLAIR sequences, whereas MRID149-4 shows relatively normal white matter signal. The images serve to correlate specific genetic variants with visible neuroanatomical features in Pakistani families with intellectual disabilities.
genetic disease chromosomal mutation types single gene disorder
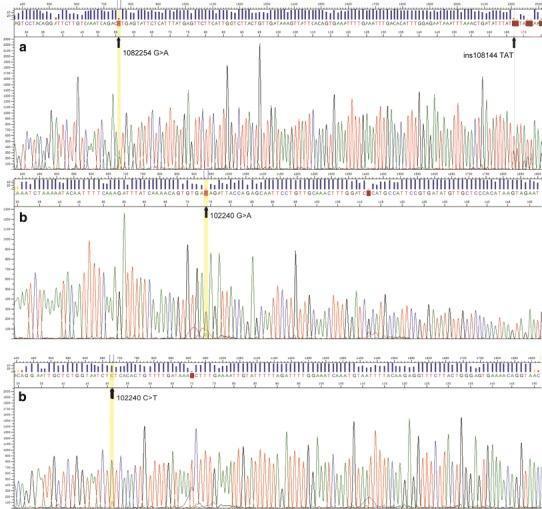
This diagnostic image displays Sanger sequencing chromatograms identifying genetic mutations in the ADAM3A gene. Panel (a) shows the sequence for Case 5 (positions 108223–108282 bp) in reverse orientation, highlighting a 108225 G>A single nucleotide substitution and a TAT insertion at position 108114 (ins108114). Panels (b) present the sequencing results for Case 12 (positions 102217–102276 bp). The upper part of panel (b) shows the forward orientation with a 102240 G>A mutation, while the lower part shows the reverse orientation confirming the corresponding 102240 C>T mutation. The chromatograms feature distinct color-coded fluorescent peaks (adenine, thymine, cytosine, and guanine) with signal intensity on the y-axis and nucleotide position on the x-axis. Vertical yellow shading and black arrows pinpoint the exact locations of the mutations. These findings are clinically relevant to the molecular characterization of extranodal NK/T-cell lymphoma (NK/TCL) and the investigation of chromosomal aberrations at the 8p11.23 locus.
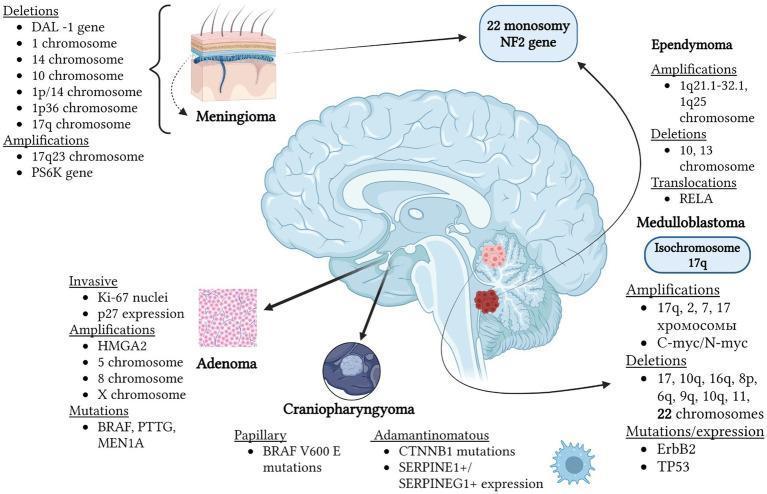
An educational pathophysiology diagram illustrating the genetic and chromosomal anomalies associated with specific human brain tumors, set against a sagittal anatomical view of the brain. The diagram categorizes molecular findings for five major tumor types: Meningioma, Adenoma, Craniopharyngioma, Ependymoma, and Medulloblastoma. Key features include: 1) Meningioma: associated with chromosome 22 monosomy, NF2 gene mutation, and various deletions (DAL-1, 1p/14, 1p36). 2) Medulloblastoma: highlights isochromosome 17q, C-myc/N-myc amplifications, and multiple deletions (17, 10q, 16q, 22). 3) Ependymoma: shows 1q25 amplifications and RELA translocations. 4) Adenoma (Pituitary): details Ki-67 nuclei presence, HMGA2 amplification, and BRAF/MEN1A mutations. 5) Craniopharyngioma: distinguishes between Papillary (BRAF V600E) and Adamantinomatous (CTNNB1) mutations. The visual summarizes cytogenetic profiles including monosomies, trisomies, and gene-specific mutations that serve as diagnostic or prognostic markers in neuro-oncology.
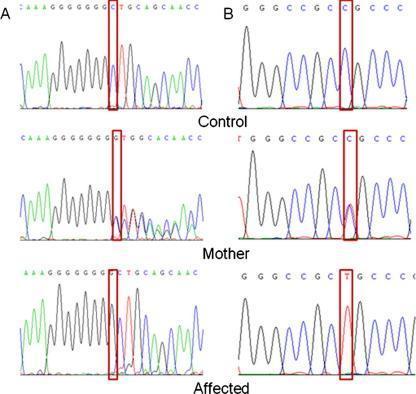
This diagnostic image displays DNA sequence chromatograms from Sanger sequencing, illustrating genetic mutations in the PCFT gene associated with Hereditary Folate Malabsorption. The content is organized into two panels, A and B, each comparing a wild-type Control, a heterozygous Mother, and a homozygous Affected individual. Panel A demonstrates a frameshift mutation (c.194dupG) in exon 1. The control shows clear single peaks; the mother exhibits overlapping peaks (double trace) following the mutation site indicating heterozygosity; the affected individual shows a distinct shift and overlapping peaks from the insertion point. Panel B illustrates a missense mutation (c.340C>T) in exon 2. The red boxes highlight the specific nucleotide position: the control shows a single blue peak (C), the mother shows overlapping blue (C) and red (T) peaks, and the affected individual shows a single red peak (T). This comparison serves as an educational tool for identifying different inheritance patterns (heterozygous vs. homozygous) and mutation types (frameshift vs. point mutation) in clinical genetics.
cystic fibrosis sickle cell Huntington disease pathology
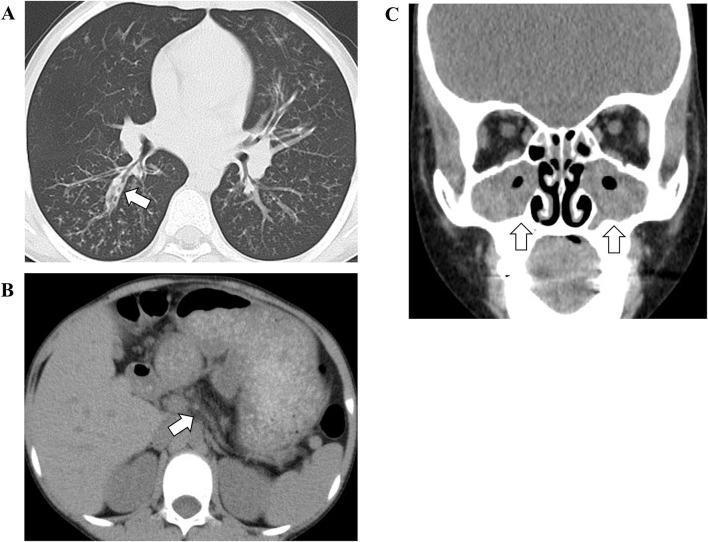
This composite of computerized tomography (CT) images illustrates multi-organ manifestations of cystic fibrosis. Image A (Axial Chest CT) shows significant pulmonary pathology, including bilateral thickened bronchial walls and bronchiectasis (white arrow), with underlying lung hyperinflation indicative of chronic obstructive airway disease. Image B (Axial Abdominal CT) reveals an atrophic pancreas characterized by fatty infiltration (white arrow), a hallmark of exocrine pancreatic insufficiency. Image C (Coronal Facial CT) demonstrates paranasal sinus involvement with bilateral opacification and distinct gas-fluid levels (white arrows), accompanied by internal gas bubbles suggesting acute-on-chronic sinusitis. Together, these diagnostic images provide a comprehensive clinical overview of the respiratory, gastrointestinal, and ENT manifestations associated with CFTR gene mutations.
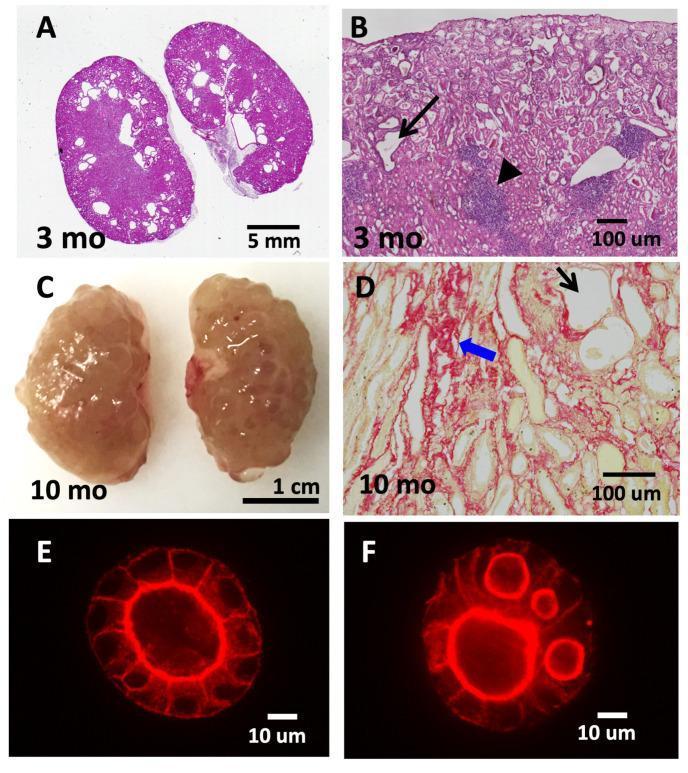
This composite figure illustrates the progression of cystic kidney disease in Tns1-knockout (KO) models through clinical photography, light microscopy, and cell culture. Panel A (H&E stain) shows whole-kidney cross-sections from a 3-month-old mouse with early tubular dilatations. Panel B provides a higher magnification (100 µm scale) of the 3-month-old tissue, highlighting dilated tubules (black arrow) and interstitial leukocyte infiltration (arrowhead). Panel C displays gross morphology of 10-month-old kidneys, exhibiting a pale, bosselated surface with multiple prominent cysts. Panel D (Sirius Red stain) reveals significant interstitial fibrosis (blue arrow) and severe tubular lumen expansion (black arrow) at 10 months. Panels E and F compare wild-type (WT) and Tns1-KO MDCK cells in 3D Matrigel culture stained for actin (red); while WT cells form a single, polarized lumen, Tns1-KO cells exhibit a multi-lumen phenotype. This figure demonstrates how Tns1 deficiency leads to progressive renal structural deterioration, including fibrosis and cystogenesis, serving as an educational model for recessive cystic kidney disease pathology.
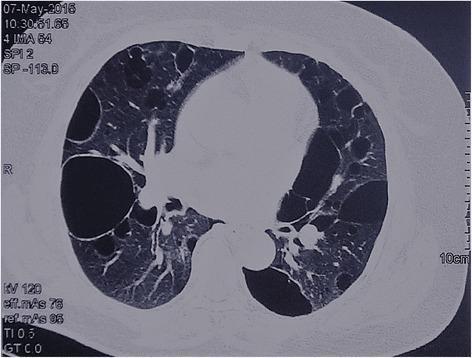
This diagnostic axial chest CT scan demonstrates a primary pathology of diffuse cystic lung disease. Multiple thin-walled air-filled cysts are distributed bilaterally throughout the lung parenchyma. The cysts vary significantly in size, with several large, dominant cysts measuring several centimeters in diameter located predominantly in the subpleural and peripheral regions. The cysts exhibit a lenticular or irregular morphology with well-defined, paper-thin walls. The intervening lung parenchyma and tissue immediately surrounding the cysts appear relatively normal in density, without evidence of ground-glass opacities, consolidation, or significant interstitial fibrosis. The vascular and bronchial structures are anatomically visible but displaced by the cystic lesions. These findings are characteristic of Birt-Hogg-Dubé (BHD) syndrome, a genetic condition often presenting with multiple basally located pulmonary cysts. The image serves as a clinical example for differentiating cystic lung diseases such as lymphangioleiomyomatosis (LAM) or pulmonary Langerhans cell histiocytosis (PLCH).
Genetic Human Diseases & Mendelian Disorders
1. Terminology: Hereditary vs. Familial vs. Congenital
- Hereditary - transmitted in the parents' gametes; always familial, may not appear at birth
- Familial - occurs in families; may not always be hereditary (e.g., shared environment)
- Congenital - present at birth; may or may not be genetic (e.g., congenital rubella is not hereditary)
2. Four Major Categories of Genetic Disorders
| Category | Description | Examples |
|---|---|---|
| Mendelian (single-gene) | High-penetrance mutations in one gene | Cystic fibrosis, Huntington disease |
| Complex/multifactorial | Multiple genes + environment | Hypertension, diabetes, allergies |
| Chromosomal | Change in chromosome number or structure | Down syndrome (trisomy 21) |
| Nonclassic single-gene | Single gene, but not classic Mendelian rules | Fragile X, mitochondrial diseases, imprinting disorders |
3. Types of Mutations Causing Genetic Disease
- Point (missense) mutations - substitution of one nucleotide base; e.g., a point mutation in the beta-globin chain converts Hb-A to Hb-S, causing sickle cell disease
- Nonsense mutations - create a premature stop codon, truncating or eliminating the protein
- Frameshift mutations - insertion or deletion of one or two base pairs alters the reading frame
- Trinucleotide repeat mutations - amplification of a 3-nucleotide sequence; e.g., in fragile X syndrome, >200 CGG repeats in the FMR1 gene silences expression, causing intellectual disability. These are dynamic mutations - the degree of amplification increases with each generation (anticipation)
- Copy number variants (CNVs) - amplifications, deletions, or translocations of chromosomal segments; e.g., 22q microdeletion syndrome; the Philadelphia chromosome t(9;22) in CML
4. Mendelian (Single-Gene) Disorders - The Five Inheritance Patterns
Autosomal Dominant (AD)
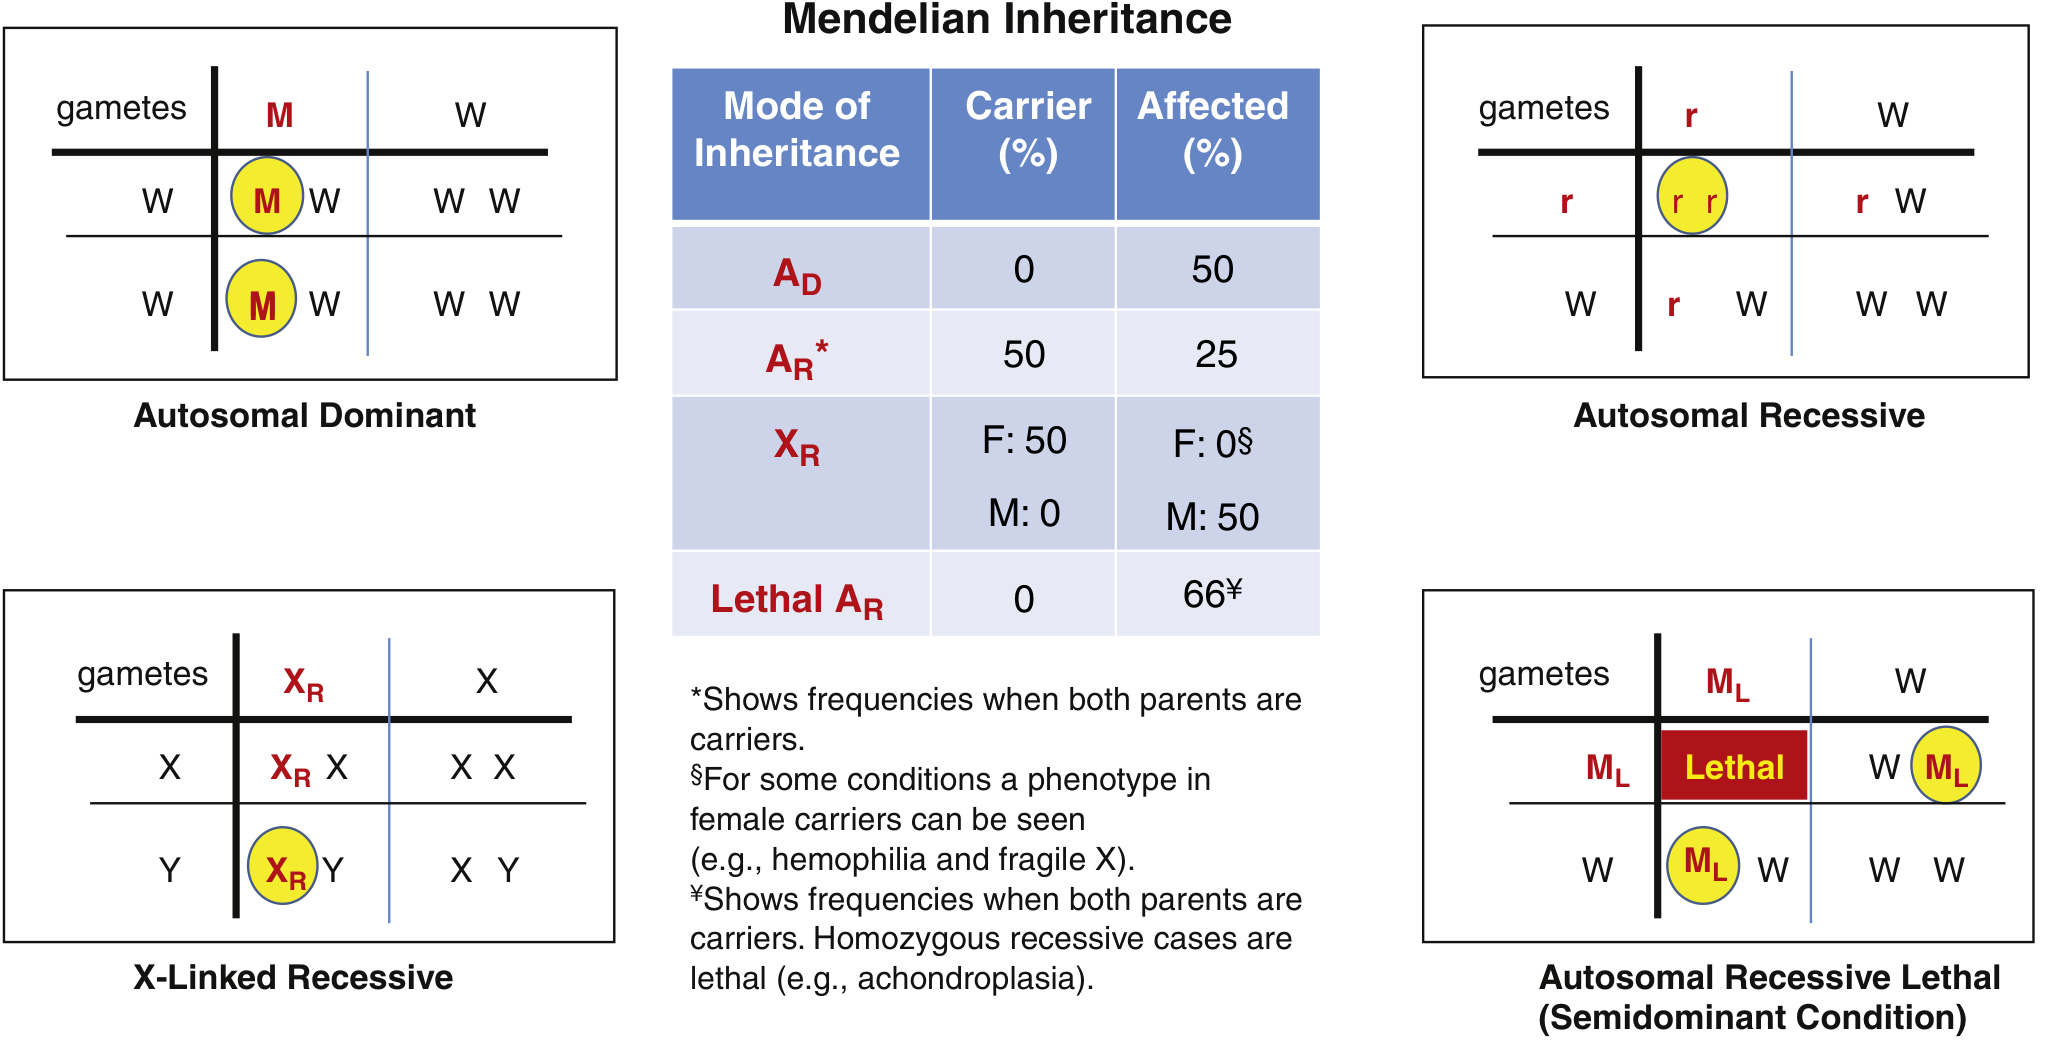
- One mutant allele is sufficient to express disease
- Affects both sexes equally; vertical transmission (parent-to-child)
- 50% of offspring of an affected person are affected
- Key mechanisms: gain-of-function (e.g., Huntington disease), dominant negative effect, or haploinsufficiency
- Penetrance = proportion of people with the mutation who express the phenotype; expressivity = severity variation among those who do
- A single gene may cause many phenotypic effects (pleiotropy) - e.g., Marfan syndrome affects skeleton, eyes, and cardiovascular system through a single fibrillin-1 (FBN1) mutation
| Disease | Gene/Mechanism | Key Features |
|---|---|---|
| Huntington disease | HTT - trinucleotide CAG repeat expansion | Neurodegeneration, chorea, dementia (onset 30-50 yrs) |
| Marfan syndrome | FBN1 mutation - connective tissue defect | Tall stature, arachnodactyly, aortic root dilation, lens subluxation |
| Familial hypercholesterolemia | LDL receptor loss-of-function | 1 in 500; premature atherosclerosis, xanthomas; cholesterol up to 2-3x normal in heterozygotes |
| Achondroplasia | FGFR3 gain-of-function | Short-limbed dwarfism; homozygous form is lethal (semidominant) |
| Hereditary spherocytosis | Spectrin/ankyrin defects | Hemolytic anemia, splenomegaly |
| Polycystic kidney disease (ADPKD) | PKD1/PKD2 | 1 in 1000; bilateral renal cysts, hypertension, renal failure |
| Neurofibromatosis type 1 | NF1 (neurofibromin) | Cafe-au-lait spots, neurofibromas, Lisch nodules |
Autosomal Recessive (AR)
- Two mutant alleles required (homozygous or compound heterozygous)
- Often involves enzyme deficiencies (inborn errors of metabolism) - loss of function
- Typically horizontal transmission - multiple affected siblings, unaffected carrier parents
- More common in populations with high consanguinity rates
- 25% of children affected when both parents are carriers; 50% carriers
| Disease | Gene/Mechanism | Key Features |
|---|---|---|
| Cystic fibrosis | CFTR - Cl- channel defect | 1 in 3200 (European); thick secretions, pulmonary infections, pancreatic insufficiency |
| Sickle cell anemia | HBB - Hb-S polymerization | 1 in 500 (U.S. African descent); vaso-occlusion, hemolytic anemia, pain crises |
| Phenylketonuria (PKU) | PAH - phenylalanine accumulation | Intellectual disability if untreated; detected by newborn screen |
| Tay-Sachs disease | HEXA - GM2 ganglioside accumulation in neurons | 1 in 3500 (Ashkenazi Jewish); progressive neurodegeneration, cherry-red macula |
| Wilson disease | ATP7B - copper accumulation | Liver cirrhosis, Kayser-Fleischer rings, neuropsychiatric disease |
| Galactosemia | GALT - galactose-1-phosphate toxicity | Cataracts, liver damage, E. coli sepsis in newborns |
| Mucopolysaccharidoses (MPS) | Various lysosomal enzymes | Coarse facies, organomegaly, bone deformities |
| Glycogen storage diseases | Various glycogen enzymes | Hepatomegaly, hypoglycemia, myopathy |
| Congenital adrenal hyperplasia | CYP21A2 (21-hydroxylase deficiency) | Virilization, salt-wasting, adrenal insufficiency |
X-Linked Recessive (XR)
- Gene is on the X chromosome; males (hemizygous XY) are almost always affected
- Females are carriers (heterozygous XX); rarely affected due to lyonization
- No father-to-son transmission (father passes Y chromosome to sons)
- Carrier females have a 50% chance of affected sons and 50% chance of carrier daughters
| Disease | Gene | Key Features |
|---|---|---|
| Duchenne muscular dystrophy | DMD - dystrophin absent | Progressive proximal muscle weakness, calf pseudohypertrophy, cardiomyopathy; onset early childhood |
| Hemophilia A | F8 - Factor VIII deficiency | Bleeding diathesis, hemarthroses |
| Hemophilia B | F9 - Factor IX deficiency | Similar to hemophilia A |
| Glucose-6-phosphate deficiency | G6PD | Hemolytic anemia triggered by oxidative stress (drugs, infection, fava beans) |
| Fragile X syndrome | FMR1 - CGG repeat expansion | Most common inherited intellectual disability; macro-orchidism, large ears, autism features |
| Lesch-Nyhan syndrome | HPRT - hypoxanthine accumulation | Gout, intellectual disability, self-mutilating behavior |
X-Linked Dominant (XD)
- One mutant X allele is sufficient to cause disease
- Both males and females are affected; males often more severely
- No male-to-male transmission (fathers cannot pass X to sons)
- Some X-linked dominant disorders are lethal in males (e.g., incontinentia pigmenti)
Y-Linked Inheritance
- Only males affected; transmitted from father to all sons
- Very rare; involves genes on the Y chromosome
- Example: Azoospermia factor (AZF) deletions causing male infertility
5. Important Concepts in Mendelian Genetics
Penetrance and Expressivity
- Penetrance - the proportion of individuals with a mutation who show clinical features (some AD conditions have incomplete penetrance)
- Expressivity - the range of phenotypic severity among those affected; influenced by modifier genes and environment
Pleiotropy vs. Genetic Heterogeneity
- Pleiotropy - one mutation, many effects (e.g., Marfan syndrome: skeleton + eyes + cardiovascular)
- Genetic heterogeneity - many different mutations cause the same phenotype (e.g., retinitis pigmentosa can result from mutations in >60 genes) - Robbins & Kumar Basic Pathology
Codominance
- Both alleles fully expressed (e.g., ABO blood groups, HbS/HbC in sickle-hemoglobin C disease)
Semidominance
- Heterozygotes show an intermediate phenotype; homozygotes show severe or lethal disease
- Example: achondroplasia - one FGFR3 mutation gives dwarfism; two copies are lethal
6. Non-Classic Single-Gene Disorders
Trinucleotide Repeat Disorders (Anticipation)
| Disease | Gene | Repeat | Inheritance | Normal | Affected |
|---|---|---|---|---|---|
| Huntington disease | HTT | CAG (exonic) | AD | <36 | >36 (full) |
| Fragile X syndrome | FMR1 | CGG (5'UTR) | XR | 6-54 | >200 (full mutation) |
| Myotonic dystrophy | DMPK | CTG (3'UTR) | AD | 5-37 | >50 |
| Friedreich ataxia | FXN | GAA (intronic) | AR | 7-33 | >66 |
Mitochondrial (Maternal) Inheritance
- Mitochondria are inherited almost exclusively from the mother via the oocyte
- Mitochondrial DNA (mtDNA) has a higher mutation rate than nuclear DNA
- Disease affects both sexes but transmitted only through females (matrilinear)
- Features: neurological + myopathic + multisystem (cardiomyopathy, diabetes, deafness)
- Examples: MELAS (mitochondrial encephalomyopathy, lactic acidosis, stroke-like episodes), MERRF (myoclonic epilepsy with ragged-red fibers), Leber hereditary optic neuropathy (LHON)
- Heteroplasmy (mixture of normal and mutant mtDNA in the same cell) determines severity
Genomic Imprinting
- The same genetic region produces different phenotypes depending on whether the mutation is inherited from the mother or father
- Examples:
- Prader-Willi syndrome - deletion of paternal 15q11-q13 (or maternal uniparental disomy); features: hypotonia, hyperphagia, obesity, intellectual disability
- Angelman syndrome - deletion of maternal 15q11-q13 (or paternal UPD); features: seizures, absent speech, happy affect, intellectual disability
- Beckwith-Wiedemann syndrome - dysregulation of 11p15.5 imprinting; overgrowth, macroglossia, omphalocele, Wilms tumor risk
7. Chromosomal Disorders (Overview)
| Disorder | Chromosomal Change | Key Features |
|---|---|---|
| Down syndrome | Trisomy 21 | Intellectual disability, characteristic facies, AV canal defects, increased leukemia risk |
| Turner syndrome | 45,X | Short stature, webbed neck, ovarian failure, coarctation of aorta |
| Klinefelter syndrome | 47,XXY | Tall, hypogonadism, infertility, gynecomastia |
| Patau syndrome | Trisomy 13 | Severe defects; cleft palate, polydactyly, holoprosencephaly |
| Edwards syndrome | Trisomy 18 | IUGR, rocker-bottom feet, overlapping fingers |
| DiGeorge/22q11.2 del | 22q11.2 microdeletion | Conotruncal cardiac defects, hypocalcemia, T-cell immunodeficiency |
8. Complex (Multifactorial) Disorders
9. Prevalence Reference Table (Selected Mendelian Disorders)
| Disorder | Inheritance | Estimated Prevalence |
|---|---|---|
| Familial hypercholesterolemia | AD | 1 in 500 |
| Polycystic kidney disease | AD | 1 in 1000 |
| Marfan syndrome | AD | 1 in 5000 |
| Huntington disease | AD | 1 in 10,000 |
| Sickle cell anemia | AR | 1 in 500 (U.S. African descent) |
| Cystic fibrosis | AR | 1 in 3200 (N. European descent) |
| Tay-Sachs disease | AR | 1 in 3500 (Ashkenazi Jewish) |
| Phenylketonuria | AR | 1 in 10,000 |
| Duchenne muscular dystrophy | XR | 1 in 3500 males |
| Fragile X syndrome | XR | 1 in 4000 males |
10. Key Clinical Concepts: Genetic Counseling
- Carrier testing (e.g., for CF, Tay-Sachs) is offered to at-risk populations and is highly effective in reducing incidence
- Prenatal diagnosis via chorionic villus sampling (CVS, 10-13 weeks) or amniocentesis (15-20 weeks)
- Preimplantation genetic testing (PGT) in IVF cycles allows selection of unaffected embryos
- Modifier genes affect disease severity in single-gene disorders (e.g., CF lung disease severity is partially determined by non-CFTR loci) - Robbins & Kumar Basic Pathology
- OMIM (omim.org) is the definitive, continuously updated database of all known Mendelian disorders