
Relation between health and sleep
sleep and health relationship effects 2025
sleep health outcomes
sleep deprivation cardiovascular metabolic disease
sleep health effects body diagram
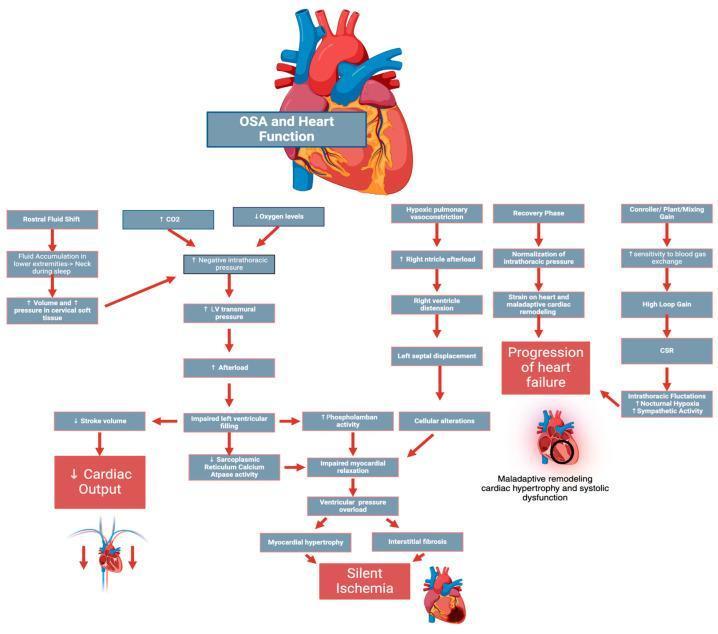
A complex pathophysiology flowchart titled 'OSA and Heart Function' detailing the multi-pathway effects of Obstructive Sleep Apnea on cardiac health. The diagram starts with primary drivers including rostral fluid shift (causing cervical soft tissue pressure), hypercapnia (↑CO2), and hypoxia (↓oxygen levels). These lead to increased negative intrathoracic pressure, which elevates left ventricular (LV) transmural pressure and afterload. Resulting impaired LV filling leads to decreased stroke volume and cardiac output. Another pathway describes how hypoxic pulmonary vasoconstriction increases right ventricle (RV) afterload, causing RV distension and left septal displacement. These hemodynamic stresses, combined with cellular alterations (increased phospholamban activity and decreased SERCA activity), lead to impaired myocardial relaxation, ventricular pressure overload, myocardial hypertrophy, and interstitial fibrosis. The flowchart culminates in major clinical outcomes: 'Progression of Heart Failure' and 'Silent Ischemia,' categorized as maladaptive cardiac remodeling and systolic/diastolic dysfunction. Additional loops include the impact of high loop gain and Cheyne-Stokes respiration (CSR) on sympathetic activity and nocturnal hypoxia.
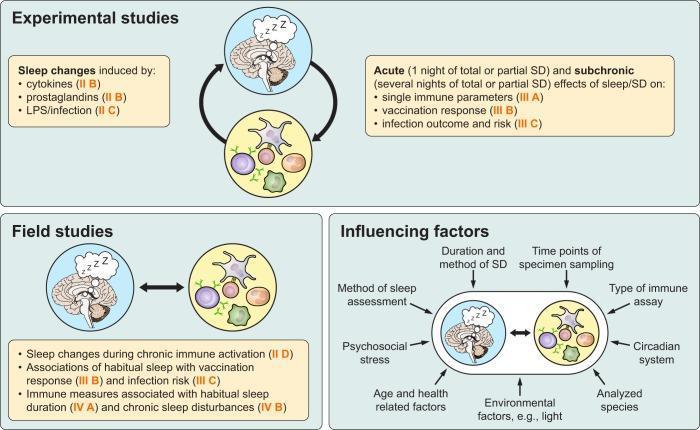
A medical conceptual diagram summarizing research approaches to sleep-immune interactions. The visual is divided into three panels: Experimental Studies, Field Studies, and Influencing Factors. Throughout the diagram, sleep is represented by a brain illustration with 'zzz' symbols, and the immune system is represented by a circle containing various immune cells (including a dendritic-like cell, lymphocytes, and cytokines/PAMPs). The Experimental Studies panel uses bidirectional arrows to indicate causal investigations into how sleep changes are induced by cytokines, prostaglandins, and infection, as well as the effects of acute/subchronic sleep deprivation (SD) on immune parameters, vaccination response, and infection risk. The Field Studies panel shows observational associations between chronic immune activation, habitual sleep, and disease risk. The Influencing Factors panel highlights variables affecting these studies, such as SD methods, psychosocial stress, age, circadian rhythms, and environmental factors like light. The diagram serves as a methodological framework for psychoneuroimmunology, illustrating the reciprocal signaling pathways between the central nervous system and immune function.
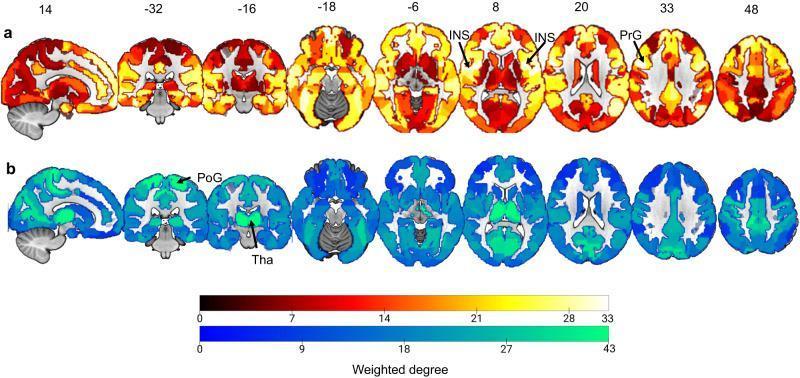
Diagnostic neuroimaging diagram illustrating maps of brain region importance scores related to sleep health. The image consists of two panels, (a) and (b), each featuring a series of axial fMRI brain slices and a single sagittal view. These maps represent resting-state functional connectivity (RSFC) loadings summed for regions in the Brainnetome atlas. Panel (a) depicts the positive network importance scores using a warm color gradient (dark red to yellow to white), with values ranging from 0 to 33. Specific anatomical labels include the Insular Gyrus (INS) in slices 8 and 20, and the Precentral Gyrus (PrG) in slice 33. Panel (b) depicts the negative network importance scores using a cool color gradient (dark blue to cyan/green), with values ranging from 0 to 43. Key identified regions include the Postcentral Gyrus (PoG) and the Thalamus (Tha), visible in slices -32 and -16. This visualization demonstrates the spatial distribution of brain nodes that covary with sleep health dimensions, highlighting the functional importance of subcortical, somatomotor, and insular regions in sleep-related connectome biomarkers.
Sleep and Health: A Comprehensive Overview
How Much Sleep Do We Need?
- Harrison's Principles of Internal Medicine, 22E, p. 253
Sleep Architecture: The Basics
- NREM sleep (stages N1, N2, N3 / slow-wave sleep) - dominates the first third of the night, drives physical restoration
- REM sleep - constitutes 20-25% of total sleep; critical for emotional processing and memory consolidation
- Harrison's, p. 253
1. Cognitive and Brain Health
- Even one night of total sleep deprivation impairs logical reasoning, encoding/decoding, complex subtraction, divergent thinking, and sustained attention.
- Sleep-restricted individuals (6 hours or fewer per night) show cumulative cognitive decline over days that compounds without full recovery.
- Sleep loss causes attention deficits, short-term memory impairment, speech problems, perseveration, and inflexible thinking.
- Critically, sleep-deprived people consistently underestimate how impaired they are - their subjective sense of alertness does not track objective performance.
- "Microsleeps" (brief EEG-confirmed sleep intrusions during apparent wakefulness) cause lapses in driving and complex tasks without the person being aware.
- Kaplan & Sadock's Comprehensive Textbook of Psychiatry, p. 747-748
2. Metabolic and Endocrine Health
| Effect | Consequence |
|---|---|
| Decreased glucose tolerance | Increased risk of Type 2 Diabetes |
| Elevated cortisol | Increased stress, fat accumulation, immune suppression |
| Increased sympathetic nervous system (SNS) activation | Raised heart rate and blood pressure |
| Altered leptin/ghrelin balance | Increased hunger and obesity risk |
3. Cardiovascular Health
- Chronic sleep deprivation raises the risk of hypertension, atherosclerosis, and cardiac disease.
- Obstructive Sleep Apnea (OSA) - the most common sleep disorder - directly stresses the heart through nocturnal hypoxia, elevated intrathoracic pressure, and sympathetic surges, driving left ventricular hypertrophy, diastolic dysfunction, and heart failure progression.
- Studies show acute sleep deprivation impairs vascular endothelial function.
- Barash, Cullen & Stoelting's Clinical Anesthesia, 9e
4. Immune Function
- Sleep is tightly coupled to immune regulation. During sleep, the body releases cytokines (such as IL-1, TNF-alpha) that regulate immune responses.
- Sleep-deprived animals show increased bacteremia, indicating compromised host defense.
- In humans, poor sleep reduces vaccine efficacy, lowers natural killer (NK) cell activity, and raises susceptibility to viral infections.
- The sleep-immune relationship is bidirectional: infections and inflammation signal the brain to increase sleep (sickness behavior).
- Kaplan & Sadock's, p. 748
5. Mental Health
- People with insomnia are 10× more likely to develop depression and 17× more likely to develop anxiety compared to normal sleepers - per Stanford Medicine research (2025).
- Each additional night of insufficient sleep in college students increases the risk of: depressed mood (+21%), hopelessness (+24%), anxiety (+25%), and suicidal ideation (+28%).
- Sleep apnea raises the risk of depression and anxiety approximately threefold.
- Sleep quality has emerged as the strongest single predictor of depressive symptoms in population studies.
- Psychiatric disorders (depression, PTSD, bipolar disorder, schizophrenia) in turn fragment and distort sleep architecture, creating a reinforcing cycle.
6. Mortality and Longevity
- Both too little and too much sleep are associated with increased mortality (a U-shaped relationship, though results vary across studies).
- Long sleep duration (>9 h) is consistently linked with increased all-cause mortality in both sexes in recent meta-analyses.
- Short sleep duration (<6 h) was significantly associated with all-cause mortality, particularly in men.
- The most extreme consequence is Fatal Familial Insomnia (FFI), a rare prion disease causing near-total sleep loss and death within months to years - illustrating that sleep is biologically non-negotiable.
- Kaplan & Sadock's, p. 749
7. Economic and Safety Impact
- Harrison's, p. 253; Kaplan & Sadock's, p. 747
Sleep-Immune Interaction (Visual)
Practical Takeaways
| Do | Avoid |
|---|---|
| Aim for 7-9 hours consistently | Irregular sleep schedules (social jetlag) |
| Keep a fixed wake time | Screens/blue light within 1 hour of bedtime |
| Cool, dark, quiet sleep environment | Caffeine after 2 PM |
| Exercise (but not too close to bedtime) | Alcohol as a sleep aid (disrupts REM) |
| Short naps (10-20 min) if needed | Long naps >30 min (cause sleep inertia) |