
Nmj
neuromuscular junction structure diagram acetylcholine
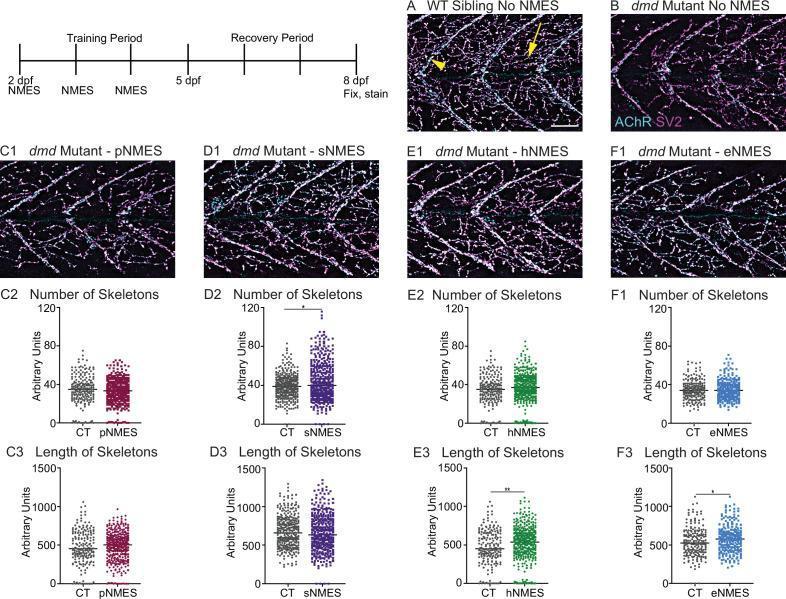
This composite educational image illustrates the effects of various neuromuscular electrical stimulation (NMES) paradigms on neuromuscular junction (NMJ) structure in a zebrafish model of Duchenne muscular dystrophy (dmd). The panel includes fluorescence microscopy images and corresponding quantitative dot plots. The NMJs are visualized using dual staining: anti-SV2 (cyan) for presynaptic terminals and alpha-bungarotoxin (magenta) for postsynaptic acetylcholine receptors (AChR). (A) Wild-type (WT) sibling showing a dense, organized network of innervation. (B) dmd mutant without treatment, displaying significant reduction and fragmentation of NMJ innervation. Panels C1-F1 show dmd mutants treated with four different NMES paradigms: power (pNMES), strength (sNMES), hypertrophy (hNMES), and endurance (eNMES). Accompanying graphs (C2-F3) quantify NMJ morphology using skeletonization analysis. Data indicate that sNMES (D2) primarily increases the number of skeletons (synaptic clusters), while hNMES (E3) and eNMES (F3) significantly increase skeleton length compared to untreated controls, suggesting that specific stimulation protocols can partially restore or improve NMJ stability and architecture in dystrophic muscle.
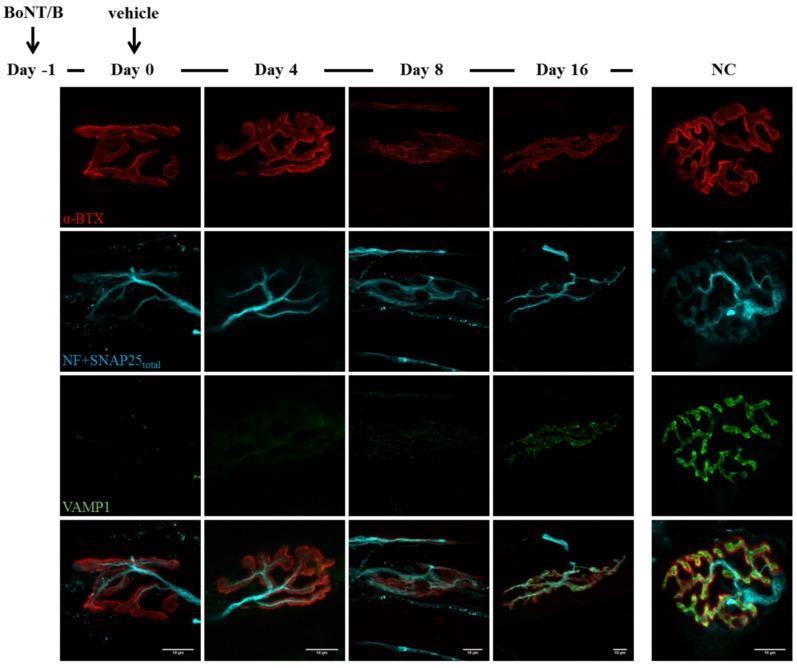
This diagnostic image illustrates a time course of immunohistochemistry staining in mouse soleus muscle following Botulinum neurotoxin serotype B (BoNT/B) injection to study neuromuscular junction (NMJ) recovery. The grid compares multiple time points (Day -1, Day 0, Day 4, Day 8, and Day 16) against a negative control (NC). Rows represent different molecular markers: alpha-bungarotoxin (alpha-BTX, red) for post-synaptic acetylcholine receptors; neurofilaments and total SNAP25 (NF+SNAP25 total, cyan) for pre-synaptic nerve terminals; and VAMP1 (green), a vesicle-associated membrane protein and the specific target of BoNT/B cleavage. At Day -1 and Day 0, VAMP1 staining is absent due to BoNT/B-mediated cleavage, while the alpha-BTX and NF+SNAP25 signals show initial terminal structure. By Day 8, the NF+SNAP25 signal appears fragmented, indicating nerve terminal disruption. Recovery is evident by Day 16, where newly synthesized VAMP1 (green) reappears at the NMJ, correlating with the re-establishment of pre-synaptic terminal morphology. The negative control shows robust, co-localized staining of all markers in a characteristic 'pretzel' shape. Scale bar = 10 µm.
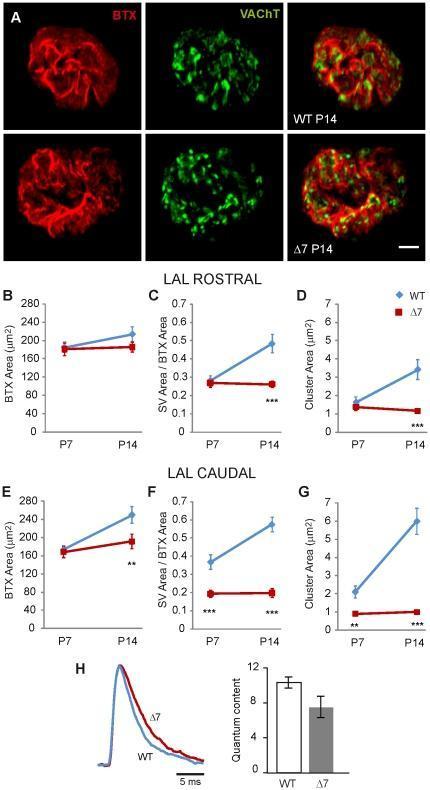
This composite educational graphic details neuromuscular junction (NMJ) alterations in Spinal Muscular Atrophy (SMA) using a SMNΔ7 mouse model. Section A presents immunofluorescence images of motor terminals at postnatal day 14 (P14) in wild-type (WT) and SMNΔ7 mice. Postsynaptic acetylcholine receptors are labeled with Bungarotoxin (BTX-Rho, red) and presynaptic synaptic vesicles (SVs) with Vesicular Acetylcholine Transporter (VAChT, green). The images reveal that while postsynaptic morphology appears similarly mature and reticulated in both groups, the SVs in SMNΔ7 terminals exhibit abnormal clustering and reduced occupancy compared to the dispersed distribution in WT. Sections B–G provide quantitative line graphs comparing the levator auris longus (LAL) muscle's rostral and caudal divisions. These plots track mean postsynaptic area, SV area normalized to BTX area, and cluster area from P7 to P14. The data show significant developmental stagnation and reduction in SV parameters in the SMNΔ7 group, particularly in the caudal division. Section H includes representative endplate potential (EPP) traces and a bar graph of quantum content, illustrating functional synaptic transmission deficits in the mutant terminals.
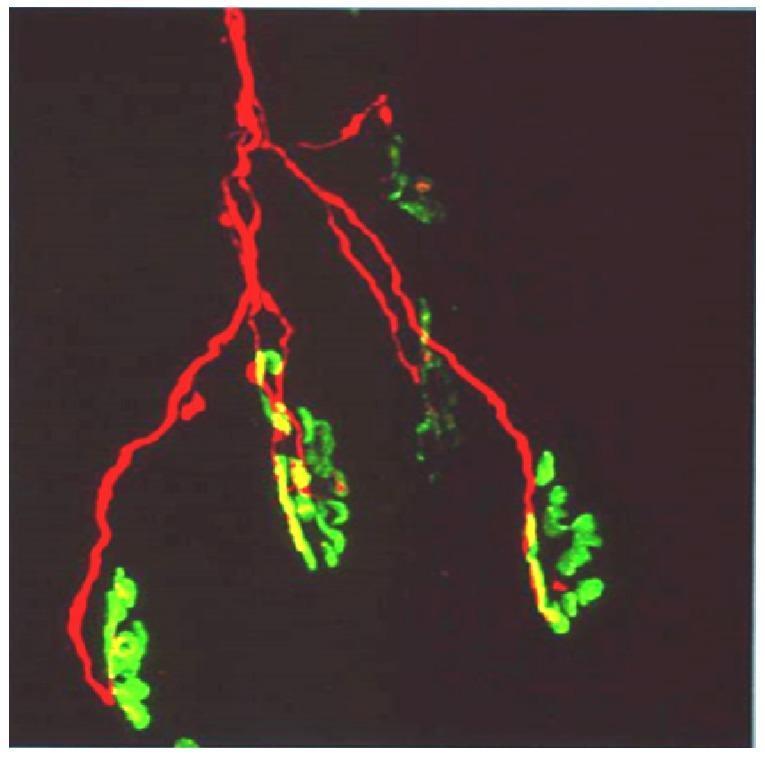
This diagnostic fluorescence microscopy image illustrates the neuromuscular junction (NMJ) architecture. The image features a single motor axon labeled with red fluorescence (TRITC-conjugated anti-neurofilament antibody), showing a characteristic distal branching pattern. These red axonal branches terminate at multiple motor end-plates, which are visualized in green (FITC-conjugated α-bungarotoxin) to reveal the high density of postsynaptic acetylcholine receptors (AChRs). The spatial relationship demonstrates a single axon innervating a cluster of six individual end-plates. Areas of colocalization between the presynaptic nerve terminal and the postsynaptic membrane appear yellow, indicating functional synaptic contact. This visual serves as an educational model for neuroanatomy and toxicology, particularly in the study of neurotoxic snake venoms (like those from the elapid family) that target presynaptic proteins or postsynaptic receptors, leading to neuromuscular paralysis and axonal degeneration.
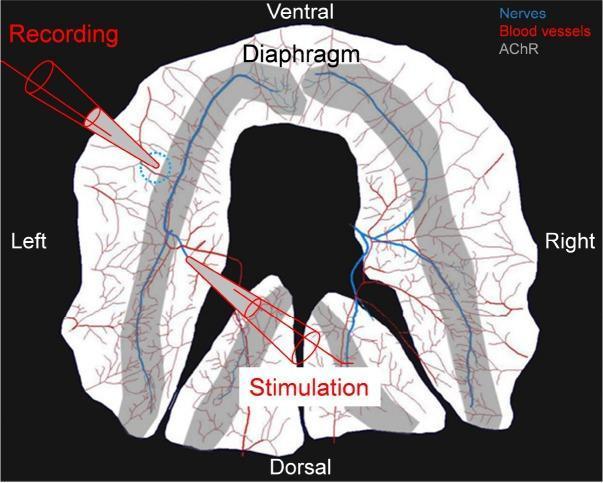
Anatomical diagram and experimental protocol for an ex vivo phrenic nerve-diaphragm muscle preparation used to record compound muscle action potentials (CMAPs). The diaphragm is depicted in a ventral-to-dorsal orientation, highlighting the left and right hemi-diaphragms. Key neurovascular structures are color-coded: nerves (blue) branch from the phrenic nerve across the muscle surface, and blood vessels (red) form an extensive microvascular network. A gray-shaded band indicates the central endplate zone, rich in acetylcholine receptors (AChR). The experimental setup illustrates the placement of a bipolar suction electrode for phrenic nerve stimulation near the dorsal entry point. A suction recording electrode is positioned in the upper left quadrant, approximately 1 mm costal to the main intramuscular nerve branch (indicated by a blue dotted circle), to capture EMG activity. This model is utilized to study neuromuscular junction reliability and motor output in neurodegenerative contexts, such as SOD1-G93A mouse models of ALS.
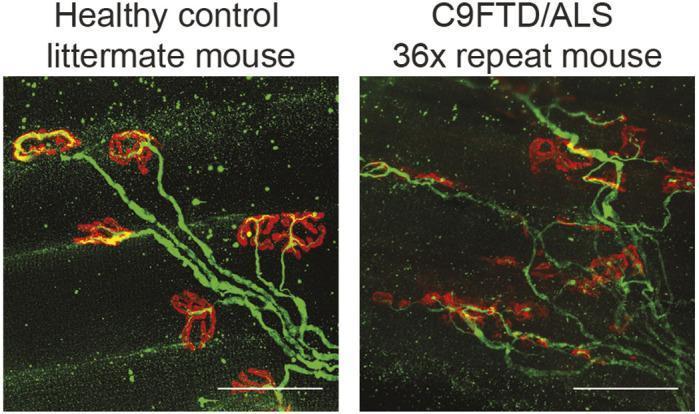
A side-by-side comparison of immunofluorescence diagnostic images showing neuromuscular junction (NMJ) pathology in a murine model of C9orf72 amyotrophic lateral sclerosis and frontotemporal dementia (ALS/FTD). The microscopy displays whole-mount staining of the extensor digitorum longus (EDL) muscle. Post-synaptic acetylcholine receptors are labeled with red α-bungarotoxin, while pre-synaptic axons and motor nerve terminals are labeled with green neurofilament antibody. The 'Healthy control' panel shows highly organized, linear axonal projections terminating in distinct, continuous, and robust 'pretzel-like' motor endplates. In contrast, the 'C9FTD/ALS 36x repeat' panel demonstrates significant neurodegeneration characterized by disorganized, fragmented axonal branching and 'dissolving' boutons with reduced or sparse red fluorescence. This visual evidence highlights the pathophysiology of denervation and synaptic instability in motor neuron disease. Scale bars represent 50 µm.
Neuromuscular Junction (NMJ)
Structure
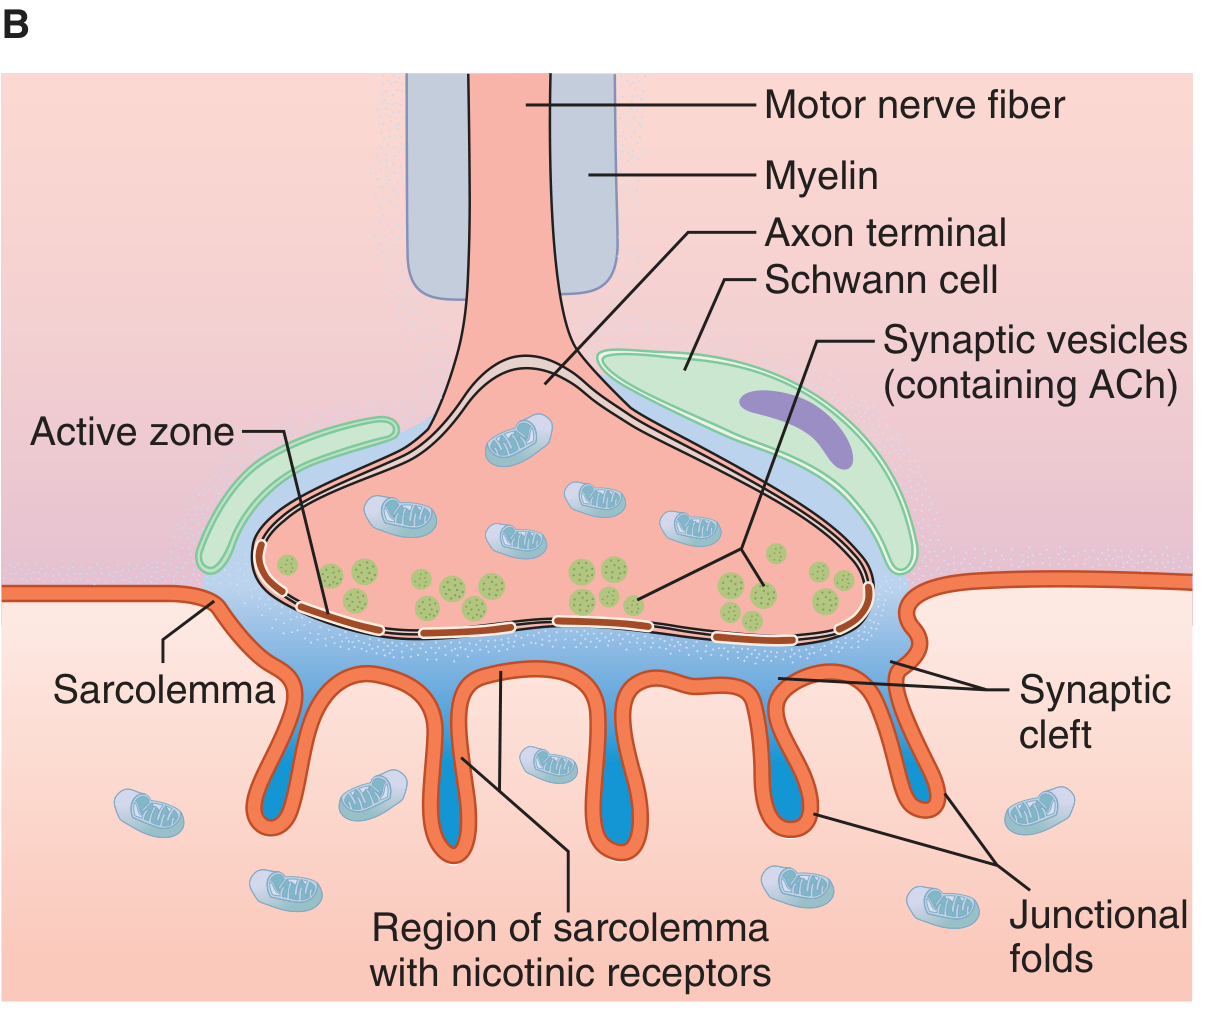
| Component | Detail |
|---|---|
| Motor nerve terminal | Loses its myelin sheath and divides into terminal boutons |
| Synaptic vesicles | Contain acetylcholine (ACh), synthesized by choline acetyltransferase from choline + acetyl-CoA |
| Active zones | Docking sites for vesicles at the presynaptic membrane; calcium channels are located here |
| Synaptic cleft | ~50 nm gap between nerve and muscle membrane |
| Motor end plate | Thickened postsynaptic muscle membrane with junctional folds |
| Nicotinic receptors (N_M) | Concentrated at the tops of the junctional folds |
| Acetylcholinesterase | Located in the synaptic cleft; rapidly hydrolyzes ACh |
- Ganong's Review of Medical Physiology, 26e, p.141
Step-by-Step Transmission
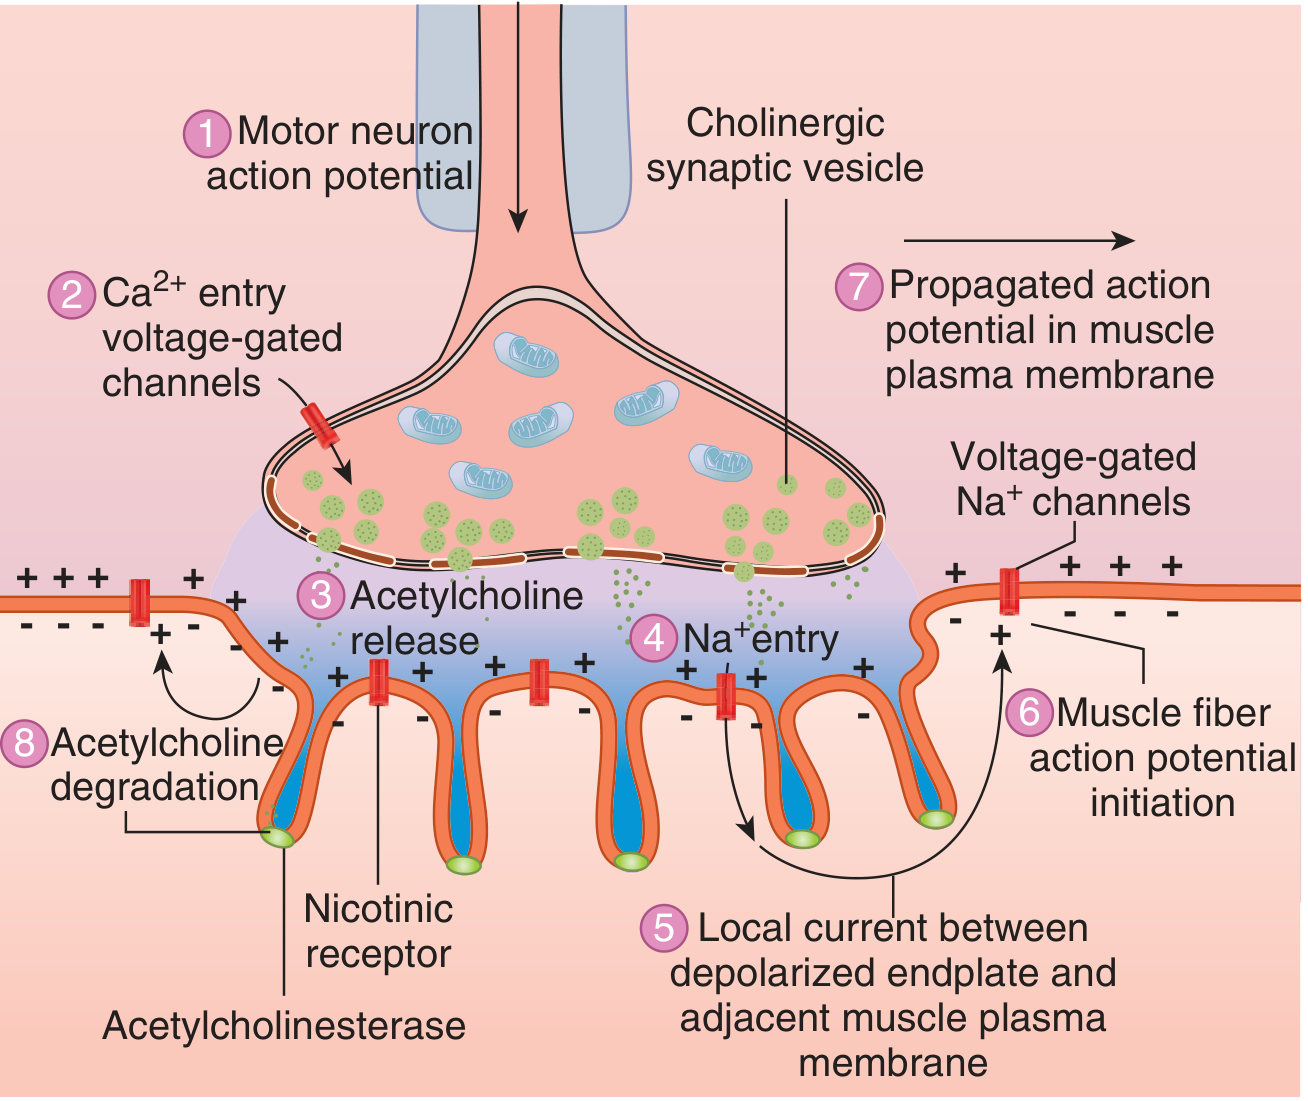
- Action potential arrives at the motor nerve terminal
- Ca²+ entry through voltage-gated P-type (and L-type) calcium channels at active zones
- ACh exocytosis - Ca²+ triggers vesicle fusion with the presynaptic membrane
- ACh binds nicotinic receptors on the end plate → Na+/K+ channel opening → Na+ entry
- End-plate potential (EPP) generated - a local depolarization of the motor end plate
- Local current depolarizes adjacent muscle membrane to threshold → muscle action potential initiated
- Propagated action potential spreads along the entire muscle fiber
- ACh degradation by acetylcholinesterase terminates the signal; choline is recycled back into the nerve terminal
- Ganong's Review of Medical Physiology, 26e, p.141
- Miller's Anesthesia, 10e, p.1160-1162
ACh Synthesis & Quantal Release
- ACh is synthesized in the nerve terminal from choline + acetyl-CoA (from mitochondria) via choline acetyltransferase
- ACh is packaged in vesicles; each vesicle = one quantum (~5,000-10,000 molecules)
- Ca²+ concentration is the key regulator: doubling extracellular Ca²+ leads to a 16-fold increase in quantal content
- Posttetanic potentiation (PTP): after high-frequency (tetanic) stimulation, accumulated Ca²+ in the terminal causes a transient increase in ACh release
Key Pharmacology & Toxicology
| Agent | Mechanism | Clinical Use/Significance |
|---|---|---|
| Succinylcholine | Depolarizing NMJ blocker (nAChR agonist) | Rapid-sequence intubation |
| Rocuronium / Vecuronium | Non-depolarizing NMJ blocker (nAChR antagonist) | Surgical muscle relaxation |
| Neostigmine / Pyridostigmine | Acetylcholinesterase inhibitor → ↑ ACh in cleft | Reversal of NMJ blockade; myasthenia gravis treatment |
| Botulinum toxin | Cleaves SNARE proteins (SNAP-25, VAMP) → blocks ACh vesicle release | Cosmetic/therapeutic paralysis |
| Aminoglycosides | Reduce presynaptic ACh release + reduce postsynaptic sensitivity | Can worsen myasthenia |
| 4-Aminopyridine | Blocks K+ channels → prolongs Ca²+ entry → ↑ ACh release | Used in Lambert-Eaton syndrome |
Clinical Diseases of the NMJ
| Disease | Mechanism |
|---|---|
| Myasthenia gravis | Autoantibodies against postsynaptic nAChRs (or MuSK) → receptor destruction |
| Lambert-Eaton myasthenic syndrome | Autoantibodies against presynaptic voltage-gated Ca²+ channels → reduced ACh release |
| Botulism | Botulinum toxin blocks presynaptic ACh release (SNARE cleavage) |
| Organophosphate poisoning | Irreversible AChE inhibition → ACh accumulation → sustained depolarization |
| Congenital myasthenic syndromes | Genetic defects in NMJ proteins (AChR subunits, rapsyn, ChAT, etc.) |