
Hypertension tell me about this and management protocol
"hypertension" AND "management guidelines"
hypertension blood pressure classification management diagram
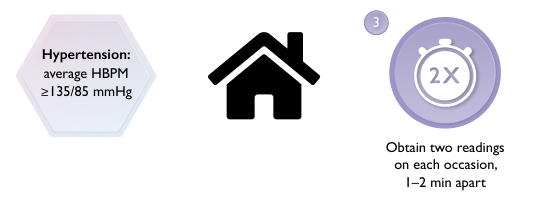
Summary : This diagram illustrates the protocol for diagnosing hypertension using home blood pressure monitoring (HBPM), specifying the threshold for hypertension and the recommended measurement procedure. flowchart: # Nodes : • "Hypertension: average HBPM ≥135/85 mmHg" (hexagon) • House icon (represents home measurement) • "3" (circle, step number) • "2X" stopwatch icon (indicates two readings) • "Obtain two readings on each occasion, 1–2 min apart" (text) # Connectors : • Implied sequential flow from hypertension definition → home measurement → step 3 (obtain two readings). # Layout : • Left-to-right arrangement: hypertension threshold (left), home icon (center), step 3 instructions (right). • Visual icons supplement text for clarity. # Analysis : • The figure communicates that hypertension is defined as an average HBPM of ≥135/85 mmHg. • It instructs users to take two blood pressure readings at home on each occasion, spaced 1–2 minutes apart, as part of the diagnostic protocol. • The use of icons and step numbering enhances clarity and guides the user through the recommended measurement process.
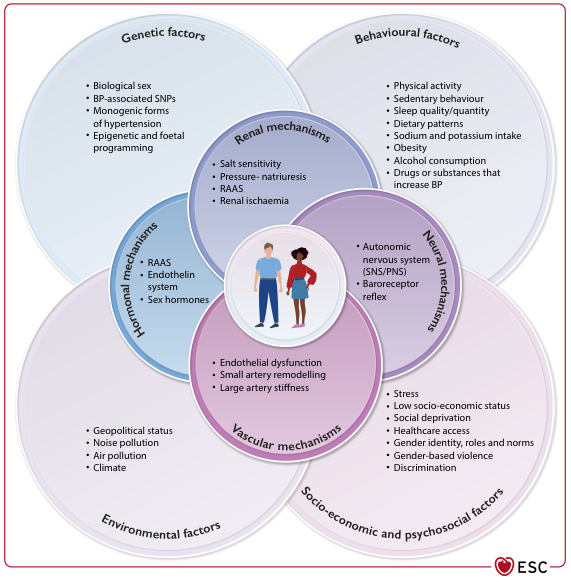
Summary : This figure presents a comprehensive overview of the multifactorial causes and mechanisms underlying blood pressure (BP) elevation and hypertension, organised as overlapping Venn diagrams. It categorises risk factors into genetic, behavioural, environmental, and socio-economic/psychosocial domains, and details the physiological mechanisms (renal, hormonal, neural, vascular) that mediate BP regulation. venn diagram / conceptual illustration: # Main Domains : • Genetic factors: Biological sex, BP-associated SNPs, monogenic forms of hypertension, epigenetic and foetal programming. • Behavioural factors: Physical activity, sedentary behaviour, sleep quality/quantity, dietary patterns, sodium and potassium intake, obesity, alcohol consumption, drugs/substances that increase BP. • Environmental factors: Geopolitical status, noise pollution, air pollution, climate. • Socio-economic and psychosocial factors: Stress, low socio-economic status, social deprivation, healthcare access, gender identity/roles/norms, gender-based violence, discrimination. # Physiological Mechanisms (Central Overlapping Circles) : ## Renal mechanisms : • Salt sensitivity • Pressure-natriuresis • RAAS (Renin-Angiotensin-Aldosterone System) • Renal ischaemia ## Hormonal mechanisms : • RAAS • Endothelin system • Sex hormones ## Neural mechanisms : • Autonomic nervous system (SNS/PNS) • Baroreceptor reflex ## Vascular mechanisms : • Endothelial dysfunction • Small artery remodelling • Large artery stiffness # Central Illustration : • At the centre, a cartoon of a man and woman symbolises the affected population. # Design Encodings : • Each domain is represented by a large, coloured circle with overlapping regions for mechanisms. • Mechanisms are shown as smaller, darker circles overlapping the main domains. • Bulleted lists within each circle detail specific factors/mechanisms. • ESC logo at bottom right. # Analysis : • The figure visually emphasises that hypertension is a complex, multifactorial condition resulting from the interplay of genetic, behavioural, environmental, and socio-economic/psychosocial factors. • Physiological mechanisms (renal, hormonal, neural, vascular) are central and overlap with all domains, indicating their integrative role in BP regulation. • The central placement of the affected individuals highlights the human impact and the need for a holistic approach to hypertension prevention and management. • No quantitative data or statistical relationships are presented; the figure is conceptual and descriptive.
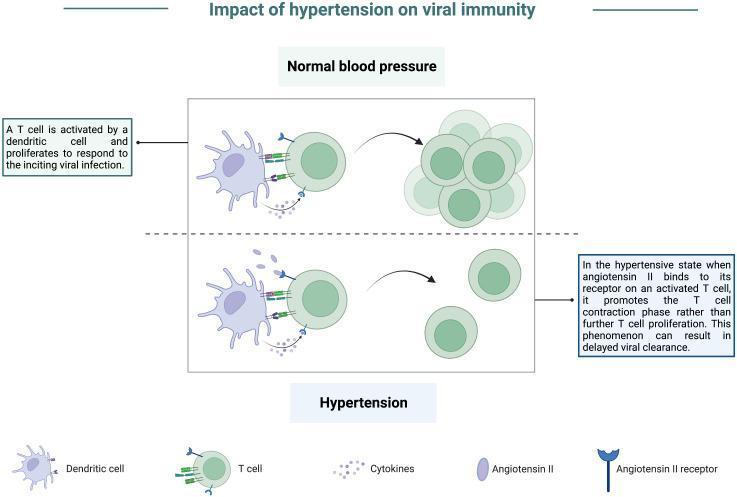
A pathophysiology diagram titled 'Impact of hypertension on viral immunity' comparing cellular immune responses under normal and hypertensive conditions. The top panel, 'Normal blood pressure,' illustrates a dendritic cell presenting antigens to a T cell via receptor-ligand interactions and cytokine release. This stimulation leads to robust T-cell activation and proliferation, resulting in a large cluster of effector T cells essential for viral clearance. The bottom panel, 'Hypertension,' depicts the same initial dendritic cell-T cell interaction but highlights the presence of elevated Angiotensin II. Angiotensin II binds to Angiotensin II receptors expressed on the activated T cell. This signaling inhibits sustained proliferation and instead promotes a T-cell contraction phase, resulting in a significantly reduced population of T cells. The diagram indicates that this hypertensive state leads to an impaired effector response and delayed viral clearance. Key components labeled include dendritic cells, T cells, cytokines, Angiotensin II, and Angiotensin II receptors.
hypertension management guidelines 2025 ACC AHA JNC blood pressure targets treatment protocol
Hypertension: Overview and Management Protocol
Definition
- 2025 AHA/ACC Definition: SBP ≥130 mmHg OR DBP ≥80 mmHg (unchanged from 2017)
- ESC/ESH 2018 Definition: SBP ≥140 mmHg OR DBP ≥90 mmHg
Blood Pressure Classification
2025 AHA/ACC Categories
| Category | Systolic (mmHg) | Diastolic (mmHg) | |
|---|---|---|---|
| Normal | < 120 | AND | < 80 |
| Elevated | 120-129 | AND | < 80 |
| Stage 1 Hypertension | 130-139 | OR | 80-89 |
| Stage 2 Hypertension | ≥ 140 | OR | ≥ 90 |
ESC/ESH Categories (European)
| Category | SBP | DBP | |
|---|---|---|---|
| Optimal | < 120 | AND | < 80 |
| Normal | 120-129 | AND/OR | 80-84 |
| High Normal | 130-139 | AND/OR | 85-89 |
| Grade 1 HTN | 140-159 | AND/OR | 90-99 |
| Grade 2 HTN | 160-179 | AND/OR | 100-109 |
| Grade 3 HTN | ≥ 180 | AND/OR | ≥ 110 |
- Fuster and Hurst's The Heart, 15th Ed.
Pathophysiology
Diagnosis
- Patient at rest for 5 minutes, no talking, sitting with back supported, feet flat, arm at heart level
- Use validated oscillometric device; correct cuff size
- Average of ≥2 readings on ≥2 separate occasions
- Confirm diagnosis with out-of-office measurements: ABPM (preferred) or HBPM ≥135/85 mmHg = hypertension
- Adults ≥40 years: annual screening
- Adults with risk factors (obesity, Black race, elevated BP): annual
- Normal BP without risk factors: every 3-5 years
Cardiovascular Risk Assessment
- Heart: LVH (ECG, echo), CAD, HF
- Brain: Stroke, TIA, cognitive impairment
- Kidneys: eGFR, proteinuria
- Eyes: Hypertensive retinopathy
- Vessels: ABI (PAD) - hypertension confers 2.5x risk in men, 3.9x in women
Management Protocol
Step 1: Lifestyle Modifications (Foundation for All Stages)
| Intervention | Expected SBP Reduction |
|---|---|
| DASH diet | 8-14 mmHg |
| Weight loss (per 10 kg) | 5-20 mmHg |
| Sodium restriction (<2.3 g/day) | 2-8 mmHg |
| Aerobic exercise (30 min, 5 days/week) | 4-9 mmHg |
| Alcohol moderation (≤2 drinks/day men, ≤1 women) | 2-4 mmHg |
| DASH + reduced sodium | up to 11 mmHg |
| Smoking cessation | Overall CV risk reduction |
Step 2: Pharmacological Treatment - 2025 AHA/ACC Algorithm
Stage 1 HTN (130-139/80-89 mmHg)
- If ASCVD risk < 7.5%: Lifestyle therapy alone for 3-6 months, then re-evaluate
- If ASCVD risk ≥ 7.5% OR established CVD/diabetes/CKD: Start 1 first-line drug + lifestyle
Stage 2 HTN (≥140/90 mmHg)
- Start 2 first-line agents of different classes simultaneously (ideally in a single-pill combination to improve adherence)
- Dose titration and sequential addition as needed
DO NOT combine ACEi + ARB + renin inhibitors (Class III: Harm)
First-Line Drug Classes
| Class | Mechanism | Key Side Effects | Compelling Indications |
|---|---|---|---|
| Thiazide/thiazide-like diuretics (HCTZ, chlorthalidone, indapamide) | Reduce renal Na+ absorption | Hypokalemia, hyponatremia, hyperuricemia, new-onset DM | HF, high CAD risk, diabetes, stroke, elderly ISH |
| ACE inhibitors (lisinopril, enalapril, ramipril) | Block angiotensin I → II conversion | Dry cough (10-15%), hyperkalemia, angioedema, fetotoxic | HF, post-MI, CKD with proteinuria, diabetes, PAD |
| ARBs (losartan, valsartan, candesartan) | Block AT1 receptor | Hyperkalemia, rarely angioedema, fetotoxic | Same as ACEi; use if ACEi cough intolerable |
| Long-acting dihydropyridine CCBs (amlodipine, nifedipine ER) | Block L-type Ca²⁺ channels → vasodilation | Peripheral edema, headache, flushing | Elderly, ISH, angina, Black patients, Raynaud's |
| Beta-blockers (metoprolol, carvedilol, bisoprolol) | Reduce HR and cardiac output | Bradycardia, bronchospasm, fatigue, mask hypoglycemia | Post-MI, HF with reduced EF, angina, AF rate control |
| Mineralocorticoid receptor antagonists (spironolactone, eplerenone) | Block aldosterone receptor | Hyperkalemia, gynecomastia (spiro) | Resistant HTN (add-on), HFrEF, primary aldosteronism |
- National Kidney Foundation Primer on Kidney Diseases, 8e; Fuster and Hurst's The Heart, 15th Ed.
Combination Therapy Strategy
- ACEi/ARB + diuretic: ACEi reduces diuretic-induced hypokalemia
- ACEi/ARB + CCB: ACEi/ARB reduces CCB-associated ankle edema
- CCB + diuretic: Additive volume and vasodilatory effects
- Avoid: ACEi + ARB; Beta-blocker + non-DHP CCB (verapamil/diltiazem) = excess bradycardia
Special Populations / Compelling Indications
| Condition | Preferred Agent(s) |
|---|---|
| Heart failure (HFrEF) | ACEi/ARB + beta-blocker + MRA + loop diuretic |
| Post-MI | Beta-blocker + ACEi/ARB |
| Diabetes + HTN | ACEi or ARB (first-line; renoprotective); all first-line classes acceptable |
| CKD + proteinuria | ACEi or ARB (first-line) |
| CKD without proteinuria | Any first-line agent |
| Stroke (secondary prevention) | Thiazide + ACEi combination |
| Isolated systolic HTN (elderly) | Thiazide diuretic or DHP-CCB |
| Angina | Beta-blocker or DHP-CCB |
| Atrial fibrillation (rate control) | Beta-blocker or non-DHP CCB |
| Primary aldosteronism | Spironolactone or eplerenone |
| Pregnancy | Labetalol (preferred) OR nifedipine ER; avoid ACEi/ARB/direct renin inhibitors (fetal harm - Class III) |
| Black patients | Thiazide diuretic + DHP-CCB (less response to ACEi/ARB monotherapy) |
Resistant Hypertension
- Exclude pseudo-resistance: poor adherence, white coat HTN, incorrect measurement
- Review and remove interfering agents (NSAIDs, OCP, sympathomimetics, steroids, liquorice)
- Add spironolactone (MRA) as 4th agent - Class I recommendation (2025 guidelines)
- Refer to hypertension specialist if uncontrolled at 6 months
Hypertensive Emergencies
- General emergency: Reduce SBP by 25% in first hour, then to <160/100-110 over next 6 hours, then to normal over 24-48 hours
- Aortic dissection: Reduce SBP to <120 mmHg in the first hour (Class I)
- Admit to ICU (Class I)
- Intravenous agents: Nicardipine, labetalol, clevidipine, hydralazine, esmolol
Avoid aggressive parenteral BP lowering in hypertensive urgency (BP elevated without acute organ damage) - parenteral therapy or intensified oral therapy causes harm (Class III)
Follow-up Protocol
- Single agent initiation: re-assess in 2-4 weeks
- Morning home BPs (before medication) help assess duration of drug action
- 3-day morning + evening BP sequence provides good control appraisal
- Address modifiable lifestyle factors at every visit
Key Points from 2025 AHA/ACC Guideline Update
- Universal BP target remains <130/80 mmHg
- PREVENT™ risk calculator replaces Pooled Cohort Equation
- For Stage 1 HTN with ASCVD risk ≥7.5%: initiate drug therapy
- Stage 2 HTN: start with 2-drug combination
- Spironolactone added as Class I recommendation for resistant HTN
- Labetalol and nifedipine ER are preferred in pregnancy
- Consider BP goal of <120 mmHg in Type 2 diabetes + HTN patients (based on BPROAD trial data)
Sources: Fuster and Hurst's The Heart 15th Ed. | NKF Primer on Kidney Diseases 8e | Brenner & Rector's The Kidney | 2025 AHA/ACC/AANP HTN Guideline (Circulation 2025;152:1-105)