
Relationship between incidence and prevalence
Prevalence and incidence are related measures of disease frequency, and the key formula connecting them is:
Prevalence ≈ Incidence × Duration
This assumes a steady-state population where prevalence is relatively stable over time.
Searching sources...
Reading File
Finding Sources
Finding Sources
Reading File
Reading File
Reading File
Loading Image
Here is a thorough explanation of the relationship between incidence and prevalence, drawn from authoritative sources.
Relationship Between Incidence and Prevalence
Core Definitions
- Incidence - the rate at which new cases of a disease arise in a population over a specified time period. It is a measure of risk and disease occurrence.
- Prevalence - the proportion of a population that has the disease at a given point in time (point prevalence) or over a period (period prevalence). It is a measure of the existing burden of disease.
The Fundamental Formula
Under steady-state conditions (stable population, incidence and duration are unchanging):
P = I × DPrevalence = Incidence × Mean Duration of disease
Derived rearrangements:
- I = P / D (incidence can be estimated from prevalence and duration)
- D = P / I (mean duration can be estimated from prevalence and incidence)
Worked example (from Park's Textbook of Preventive and Social Medicine):
- Incidence = 10 cases per 1,000 population per year
- Mean duration = 5 years
- Prevalence = 10 × 5 = 50 per 1,000 population
The "Bathtub" / "Sink" Analogy
The classic diagram below illustrates this perfectly:
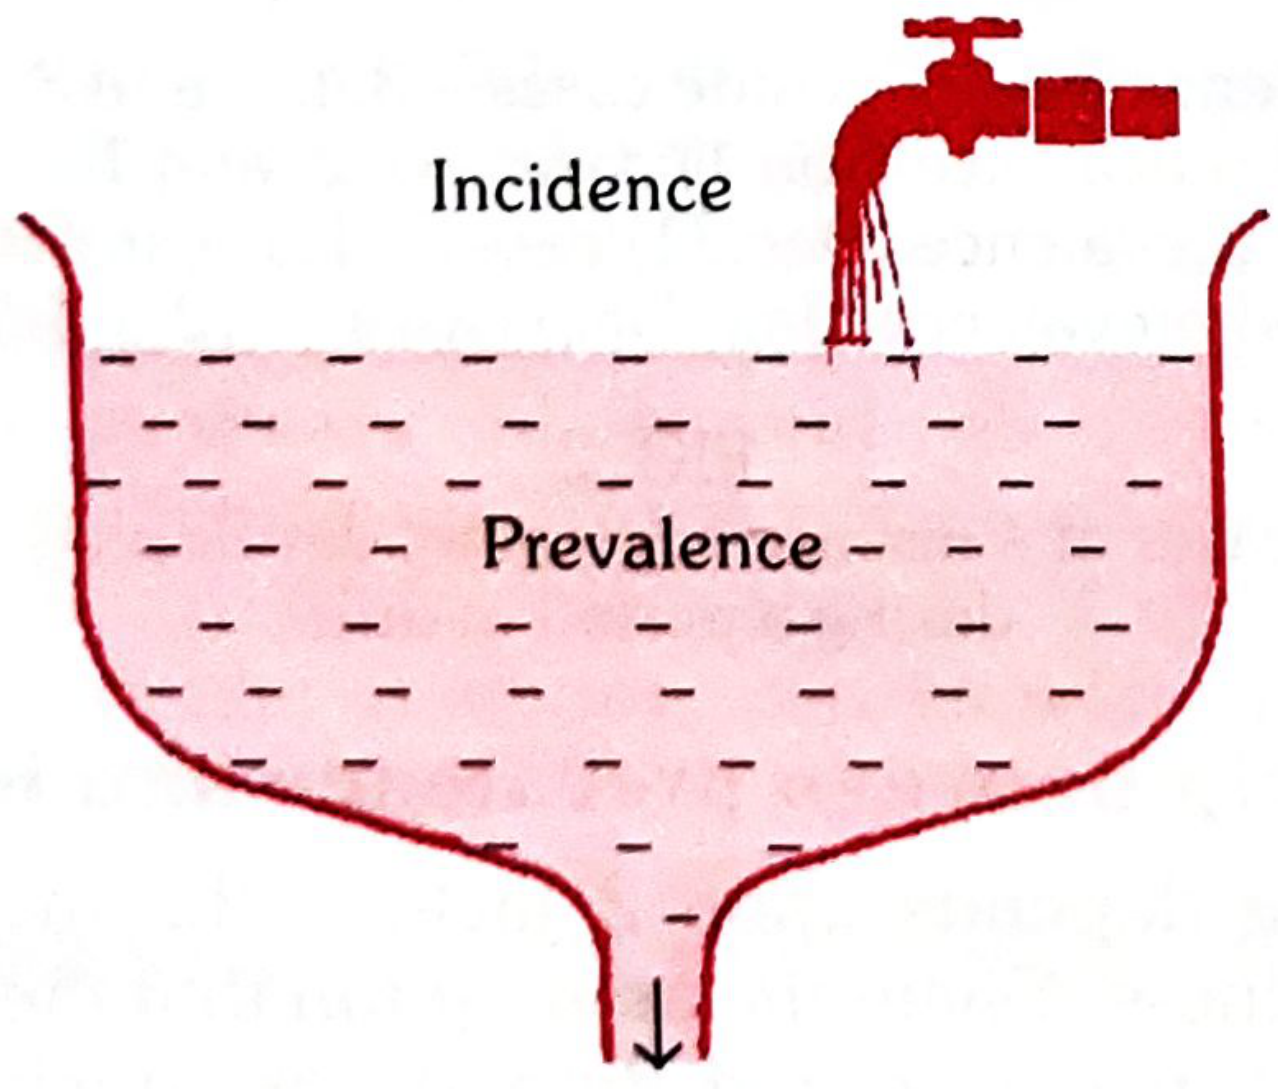
Think of prevalence as water in a sink:
- The tap (faucet) = incidence (new cases flowing in)
- The water level = prevalence (existing cases)
- The drain = cases leaving the pool (through recovery or death)
Prevalence rises when new cases enter faster than old ones leave; it falls when the drain exceeds the inflow.
Another analogy from Park's: Prevalence is like a photograph (instantaneous snapshot), while incidence is like a film (continuous record of events). A coffee house analogy makes this vivid - the number of people inside at 10 AM is prevalence; the rate at which people enter per hour is incidence.
Factors That Change Prevalence
Since P = I × D, prevalence can change through:
| Change | Effect on Prevalence |
|---|---|
| Incidence increases (more new cases) | Prevalence rises |
| Incidence decreases (e.g., vaccination) | Prevalence falls |
| Duration increases (e.g., treatment extends survival but doesn't cure) | Prevalence rises |
| Duration decreases (e.g., rapid recovery or rapid death) | Prevalence falls |
Important paradox: A treatment that prevents death but does not cure a condition will increase prevalence, even if incidence stays the same - because cases persist longer. The classic real-world example is HIV/AIDS: after effective antiretroviral therapy was introduced, prevalence of AIDS increased because infected patients lived longer, even though incidence was being controlled. This illustrates why relying solely on prevalence can be misleading when interpreting trends. - Kaplan & Sadock's Comprehensive Textbook of Psychiatry
Key Practical Implications
-
Acute, short-duration diseases (e.g., food poisoning) have very low prevalence relative to incidence - cases resolve so quickly that few exist at any moment. For rapidly fatal conditions like homicide, prevalence is essentially zero.
-
Chronic, long-duration diseases (e.g., tuberculosis, diabetes, rheumatoid arthritis, SLE) have high prevalence relative to incidence, because cases accumulate over time. As noted in Rheumatology (Elsevier 2022): "Many chronic diseases, such as systemic lupus, have a relatively low incidence but a long duration, leading to relatively high prevalence."
-
Prevalence is not ideal for studying disease aetiology. Incidence reflects causal factors (why disease begins), while duration reflects prognostic factors (why disease persists). Therefore, for aetiological hypothesis testing, incidence rates are preferred. Prevalence rates, though easier to obtain from cross-sectional surveys, conflate causation with prognosis.
-
Prevalence is preferred for planning - estimating hospital beds needed, manpower, rehabilitation services, and burden of disease in a community.
Summary Table
| Feature | Incidence | Prevalence |
|---|---|---|
| What it measures | New cases over time | Existing cases at a point in time |
| Study type best used in | Cohort studies | Cross-sectional surveys |
| Analogy | Film / tap / flow | Photograph / water level |
| Best used for | Aetiology, risk factors | Planning, burden of disease |
| Affected by | Exposure to risk factors | Incidence + duration of disease |
- Park's Textbook of Preventive and Social Medicine, p. 74
- Kaplan & Sadock's Comprehensive Textbook of Psychiatry, p. 2644
This is a shared conversation. Sign in to Orris to start your own chat.