
DASH diet
DASH diet hypertension guidelines 2025
DASH diet hypertension blood pressure
DASH diet food groups pyramid plate diagram
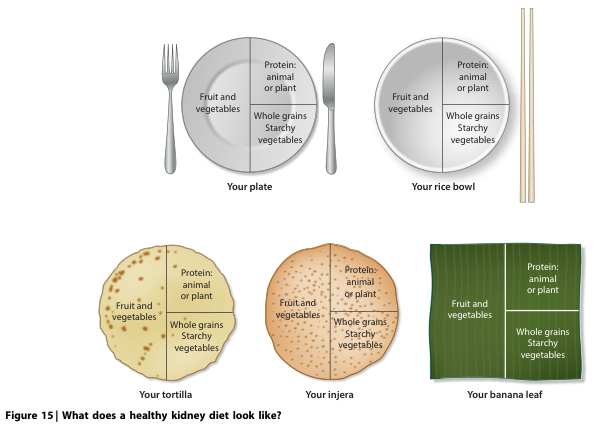
Summary : This figure illustrates what a healthy kidney diet looks like by showing recommended proportions of food groups on different types of serving vessels or bases (plate, rice bowl, tortilla, injera, banana leaf). diagram: # Serving Vessels : • Your plate (with fork and knife) • Your rice bowl (with chopsticks) • Your tortilla • Your injera • Your banana leaf # Food Group Proportions : • Each vessel/base is divided into three sections: – Fruit and vegetables (approximately half the area) – Protein: animal or plant (approximately one quarter) – Whole grains / starchy vegetables (approximately one quarter) # Section Labels : • Fruit and vegetables • Protein: animal or plant • Whole grains / starchy vegetables # Visual Encoding : • All vessels/bases are shown as circles except the banana leaf, which is rectangular. • Each section is visually separated by lines. • The utensils (fork/knife, chopsticks) are shown next to the plate and rice bowl, respectively. # Caption Text : • Figure 15 | What does a healthy kidney diet look like? Analysis : • The figure communicates that regardless of the serving vessel or cultural food base, a healthy kidney diet should consist of roughly half fruit and vegetables, with the remaining half split between protein and whole grains/starchy vegetables. This visual standardisation supports dietary guidance across diverse eating traditions.
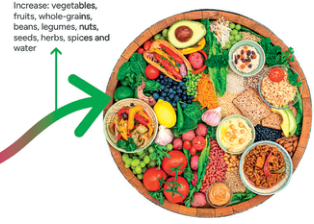
Summary : This image is an illustration of a healthy eating plate, emphasizing the increase of certain food groups for a balanced diet. illustration: Main Message : • The image shows a round plate filled with a variety of foods, primarily vegetables, fruits, whole grains, beans, legumes, nuts, seeds, and herbs. • A large green arrow points to the plate, accompanied by the text: "Increase: vegetables, fruits, whole-grains, beans, legumes, nuts, seeds, herbs, spices and water". Scene Overview : • The plate is visually divided into sections, each containing different plant-based foods such as leafy greens, tomatoes, berries, grains, nuts, and legumes. • The foods are presented in bowls and loose arrangements, with vibrant colors (greens, reds, yellows, browns) dominating the palette. • The background is white, and the plate is bordered with a wooden rim. Technical Details : • No scale bar or magnification is present. • The only on-image text is the dietary recommendation. • The illustration is clear, with high contrast and realistic food depictions. Spatial Relationships : • The arrow and text are positioned to the left of the plate, directing attention to the food selection. • Foods are evenly distributed around the plate, with no single food group dominating the visual space. Analysis : • The illustration visually reinforces the recommendation to increase intake of plant-based foods and water for a healthy diet. • The diversity of foods shown suggests variety and balance, with an emphasis on minimally processed, whole foods. • The absence of animal products or processed foods highlights a plant-forward dietary pattern.
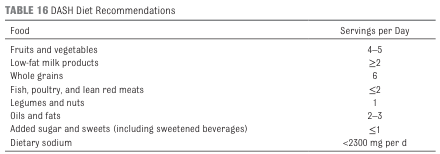
TABLE 16 DASH Diet Recommendations <table><thead><tr><th>Food</th><th>Servings per Day</th></tr></thead><tbody><tr><td>Fruits and vegetables</td><td>4–5</td></tr><tr><td>Low-fat milk products</td><td>≥2</td></tr><tr><td>Whole grains</td><td>6</td></tr><tr><td>Fish, poultry, and lean red meats</td><td>≤2</td></tr><tr><td>Legumes and nuts</td><td>1</td></tr><tr><td>Oils and fats</td><td>2–3</td></tr><tr><td>Added sugar and sweets (including sweetened beverages)</td><td>≤1</td></tr><tr><td>Dietary sodium</td><td><2300 mg per d</td></tr></tbody></table>
DASH Diet (Dietary Approaches to Stop Hypertension)
What It Is
Core Dietary Pattern
| Food Group | Daily Servings |
|---|---|
| Whole grains | 6-11 |
| Vegetables | 3-6 |
| Fruits | 4-6 |
| Low-fat dairy | 2-3 |
| Lean meats / poultry / fish | 3-6 oz |
| Nuts and legumes | 1/day to 3/week |
| Fats and oils | 2-3 |
| Sweets | 0-2 maximum |
| Sodium | < 2,300 mg/day |
- Textbook of Family Medicine 9e, p. 1111
- NHLBI DASH Eating Plan
Blood Pressure Effects
-
In the original 8-week feeding trial, DASH reduced SBP/DBP by 5.5/3.0 mmHg compared to a typical American diet.
-
In longer-term (6-month) behavior-change trials, reductions are more modest - reflecting real-world challenges with dietary adherence.
-
Adding sodium restriction amplifies the benefit.
-
A 2025 meta-analysis found significant reductions: SBP by 1.29-4.6 mmHg and DBP by 0.76-1.1 mmHg, along with improved lipid profiles (lower LDL, higher HDL). - Clinical Hypertension 2025
-
Harrison's Principles of Internal Medicine 22E (2025), Ch. 288
Clinical Indications
- Weight loss (if overweight/obese)
- Sodium reduction to < 2,300 mg/day (ideal < 1,500 mg/day)
- Adequate dietary potassium (primarily from food)
- Regular aerobic and resistance exercise
- Reduction or elimination of alcohol
- Stress management
Beyond Blood Pressure
- Reduces LDL cholesterol
- Associated with lower risk of stroke, cardiovascular mortality, and MI
- Shown to slow decline in renal function and reduce progression to dialysis
- May reduce kidney stone formation (due to high fruit/vegetable content)
- Effective for components of metabolic syndrome (PMID 39339654)
DASH vs. Mediterranean Diet
-
DASH places more emphasis on low-fat dairy
-
Mediterranean diet explicitly features fish and olive oil
-
Whether these differences are clinically significant remains under study
-
Textbook of Family Medicine 9e, p. 1111