
Michael stenosis anaesthesia management for anaesthesia residency 10 marks
mitral stenosis pressure volume loop anesthesia hemodynamics
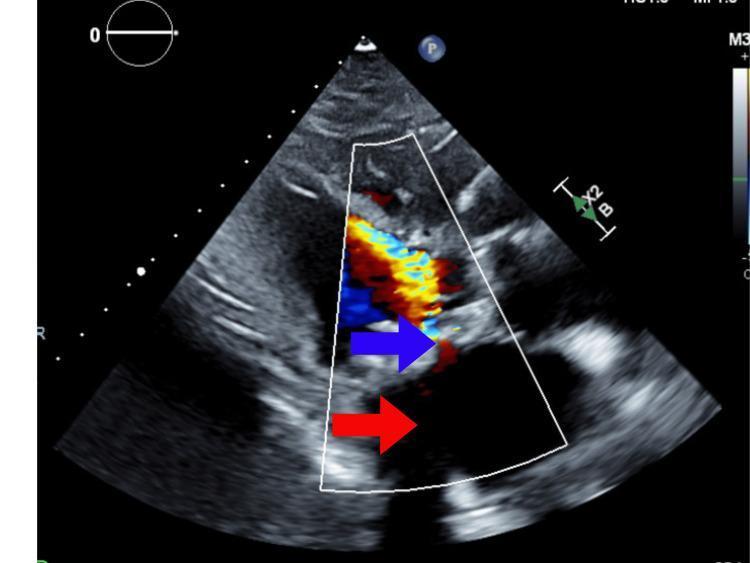
This diagnostic image is a transthoracic echocardiogram utilizing Color Flow Doppler to evaluate cardiac hemodynamics. The image primarily demonstrates severe mitral valve stenosis and its associated secondary anatomical changes. A red arrow identifies a severely dilated left atrium, indicating chronic pressure and volume overload. A blue arrow points to the stenotic mitral valve orifice. The Color Doppler signal illustrates the characteristic flow disturbances of stenosis: proximal to the mitral valve, there is a large area of red-coded flow representing blood moving toward the transducer; as blood passes through the narrowed valve, it transitions into a high-velocity, turbulent jet distal to the valve, characterized by a mosaic of blue, yellow, and green colors indicating aliasing and flow acceleration. This visual confirms the restricted valvular opening and significant obstructive gradient across the bioprosthetic mitral valve, consistent with a clinical diagnosis of prosthetic valve stenosis in a patient presenting with cardiogenic shock.
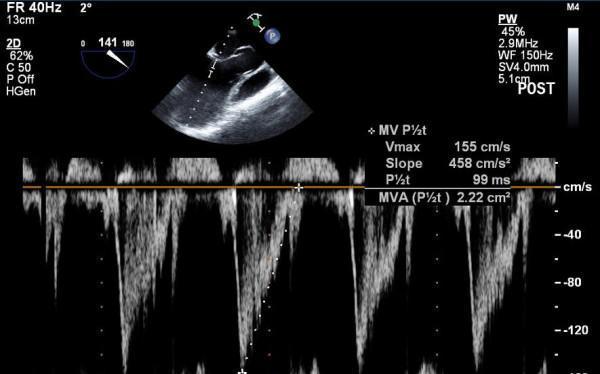
This diagnostic image shows a split-screen echocardiogram used to determine the Mitral Valve Area (MVA) via the pressure half-time (PHT) method. The upper section contains a 2D transesophageal echocardiography (TEE) view in a mid-esophageal aortic valve long-axis orientation, showing the placement of the Doppler sample volume. The lower section displays a Pulsed-Wave (PW) spectral Doppler signal of mitral inflow. The Doppler waveforms appear below the baseline, indicating flow away from the transducer, and exhibit a characteristic E-wave with a measured deceleration slope. Annotations on the right display quantitative hemodynamics: a maximum velocity (Vmax) of 155 cm/s, a deceleration slope of 458 cm/s², and a pressure half-time (P½t) of 99 ms. Based on these values, the calculated Mitral Valve Area (MVA P½t) is 2.22 cm². This imaging is critical for assessing mitral valve function and stenosis severity in a clinical or intra-operative setting.
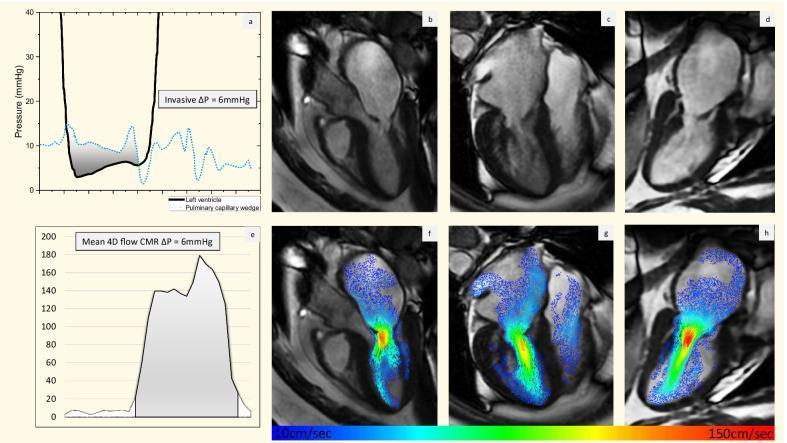
This composite figure illustrates the multimodal assessment of moderate mitral stenosis using invasive hemodynamics and 4D Flow Cardiovascular Magnetic Resonance (CMR). Panel (a) shows an invasive pressure tracing comparing pulmonary artery wedge pressure (PAWP) and left ventricular pressure (LVP), demonstrating a mean diastolic gradient of 6 mmHg. Panels (b-d) display anatomical CMR images in the left ventricular outflow tract (LVOT), 4-chamber, and vertical long axis views, revealing morphological hallmarks of mitral stenosis: thickened mitral valve leaflets, restricted leaflet opening (doming), and secondary left atrial dilatation. Panels (f-h) provide 4D flow velocity overlays (color-coded from 0 cm/sec in blue to 150 cm/sec in red) superimposed on the anatomical views. These overlays demonstrate high-velocity flow jets (red/orange) accelerating through the stenotic mitral orifice during diastole. Panel (e) shows the corresponding quantification of peak velocity derived from the 4D flow data, aligning with the invasive mean pressure drop. The figure serves as an educational comparison between gold-standard invasive manometry and non-invasive advanced cardiac imaging for valvular heart disease evaluation.
Mitral Stenosis - Anaesthesia Management (10 Marks)
Quick Overview
1. Pathophysiology (Foundation for Management)
| Consequence | Mechanism |
|---|---|
| Left atrial dilation | Chronic pressure overload, predisposes to AF |
| Pulmonary venous hypertension | LA pressure transmitted backward |
| Pulmonary arterial hypertension | Reactive PVR rise (reversible initially, then fixed) |
| RV dilation and failure | Chronic RV afterload |
| Tricuspid regurgitation | Functional, from RV dilation |
| LV underloading | Restricted inflow - LVEDV and LVEDP are LOW |
| AF (30-40%) | LA dilation - loss of atrial kick (20-30% of CO) |
| Systemic emboli | Stasis in LA appendage |
2. Preoperative Assessment
- Loud S1, opening snap, mid-diastolic rumble with presystolic accentuation
- Signs of pulmonary hypertension: loud P2, right parasternal heave
- ECG: P mitrale (bifid P wave), right axis deviation, RVH in pulmonary hypertension; AF if present
- CXR: LA enlargement (double shadow at right heart border), pulmonary venous congestion, Kerley B lines
- Echocardiography (mandatory): MVA (normal 4-6 cm²), mean gradient, LA size, pulmonary artery pressure, LV/RV function, presence of LA thrombus
- Cardiac catheterisation: if echo-clinical discrepancy or suspected CAD
| Severity | MVA (cm²) | Mean Gradient (mmHg) |
|---|---|---|
| Mild | >1.5 | <5 |
| Moderate | 1.0-1.5 | 5-10 |
| Severe | <1.0 | >10 |
- Rate control: beta-blockers or digoxin (target HR 60-80 bpm)
- Diuretics for pulmonary congestion
- Anticoagulation if AF present or prior embolic event (therapeutic INR 2-3)
- Continue antiplatelets, statins
- Patients undergoing elective non-cardiac surgery should have MS corrected first if severe
3. Haemodynamic Goals (The Core of Management)
| Parameter | Goal | Rationale |
|---|---|---|
| Heart Rate | LOW-NORMAL (60-80 bpm) | Tachycardia shortens diastole - reduces LV filling time, raises gradient dramatically |
| Rhythm | Sinus rhythm (maintain if present) | Loss of atrial kick in AF removes 20-30% of CO |
| Preload | HIGH-NORMAL (judicious) | LV is underloaded and depends on preload; but avoid overload - fine margin |
| Afterload (SVR) | NORMAL to HIGH | Vasodilation reduces preload; use vasopressors to maintain |
| Contractility | Maintain | LV function is usually preserved |
| PVR | MINIMISE | Avoid hypoxia, hypercapnia, acidosis, N₂O, light anesthesia |
"Vasodilation that occurs following both neural axial and general anesthesia can lead to peripheral venous blood pooling and inadequate volume delivery to the left ventricle. This can precipitate haemodynamic collapse." - Morgan & Mikhail's Clinical Anaesthesiology, 7e
4. Intraoperative Monitoring
- Standard ASA monitors (mandatory)
- Invasive arterial line (for major surgery - beat-to-beat BP, frequent ABGs)
- Central venous catheter: prominent 'a' wave in sinus rhythm; prominent 'cv' wave suggests secondary tricuspid regurgitation
- Pulmonary artery catheter: PCWP reflects transvalvular gradient, NOT LVEDP; useful in severe MS but risk of PA rupture in pulmonary hypertension
- Transoesophageal echocardiography (TEE): gold standard for intraoperative haemodynamic assessment; evaluates LV/RV function, filling, valve morphology, LA thrombus
- ECG: continuous monitoring - detect AF or rate changes immediately
5. Choice of Anaesthetic Technique
Regional Anaesthesia
- Spinal anaesthesia: Use with extreme caution - rapid sympathetic blockade causes vasodilation and severe hypotension; generally avoided in moderate-severe MS
- Epidural anaesthesia: Preferred regional technique - slow titration of sympathetic block is more controllable; can be used for labour analgesia and lower limb surgeries
- Vasopressors must be immediately available
General Anaesthesia
- Aim: haemodynamically stable induction, avoid tachycardia and vasodilation
- Etomidate (0.3 mg/kg): preferred - minimal haemodynamic effects, maintains SVR
- High-dose opioid technique (fentanyl/sufentanil): blunts sympathetic response, avoids tachycardia
- Ketamine: relatively avoided - causes tachycardia and increases pulmonary vascular resistance
- Propofol: use reduced doses carefully - causes vasodilation; titrate slowly
- Thiopentone: causes vasodilation - avoid in haemodynamically compromised patients
- Pre-oxygenation mandatory; gentle mask ventilation to avoid hypoxia/hypercapnia
- Opioid supplementation before laryngoscopy to blunt response
- Short-acting beta-blocker (esmolol IV) may be given prophylactically
- Opioid-based technique is ideal (morphine, fentanyl, remifentanil) - heart rate control
- Volatile agents (isoflurane, sevoflurane): use at low-moderate concentrations; may cause vasodilation at higher concentrations
- Avoid nitrous oxide: increases PVR - worsens pulmonary hypertension
- Avoid tachycardia-prone agents: pancuronium (causes tachycardia), meperidine/pethidine (atropine-like effect)
- Neuromuscular blockade: vecuronium, rocuronium, or cisatracurium preferred (minimal haemodynamic effects)
- Avoid hypoxia (raises PVR)
- Avoid hypercapnia (raises PVR)
- Moderate tidal volumes, PEEP with caution (worsens RV afterload in pulmonary hypertension)
- Target: normocapnia or mild hypocapnia (PCO₂ 35-40 mmHg)
6. Management of Specific Intraoperative Problems
Tachycardia
- Identify and treat cause (pain, light anaesthesia, hypovolaemia, fever)
- Deepen anaesthesia with opioid (fentanyl bolus)
- IV esmolol (0.5 mg/kg bolus, then 50-200 mcg/kg/min) - preferred beta-blocker
- IV metoprolol (1-5 mg increments)
- Avoid meperidine (pethidine) - causes tachycardia
Atrial Fibrillation with fast ventricular rate
- Rate control: digoxin, beta-blockers, amiodarone
- DC cardioversion if haemodynamic collapse (synchronised cardioversion at 100-200 J)
- Check anticoagulation status before cardioversion
Hypotension
- Phenylephrine (pure alpha-agonist, 50-100 mcg IV): drug of choice - increases SVR without tachycardia
- Vasopressin or norepinephrine if severe
- Avoid ephedrine - its beta-agonist activity causes tachycardia, worsening MS haemodynamics
Pulmonary Hypertension/RV Failure
- Optimise acid-base (correct acidosis)
- Hyperoxia (FiO₂ 1.0)
- Hypocapnia (mild)
- Inhaled nitric oxide (iNO): 10-40 ppm - selective pulmonary vasodilator
- Milrinone (0.375-0.75 mcg/kg/min): phosphodiesterase inhibitor - reduces PVR, inotropic support for RV
- Epinephrine for RV inotropic support
Pulmonary Oedema
- Diuretics (furosemide 20-40 mg IV)
- Positive pressure ventilation (PEEP)
- Consider nitrates with careful BP monitoring
7. Labour and Delivery (Obstetric Anaesthesia)
- Labour analgesia: Carefully titrated epidural is the technique of choice - reduces pain-induced tachycardia, controls haemodynamics
- Caesarean section: Epidural preferred over spinal (avoids sudden vasodilation); general anaesthesia when regional is contraindicated
- Invasive monitoring (arterial line, CVP) for moderate-severe MS
- Avoid ergometrine (causes coronary and pulmonary vasoconstriction)
- Syntocinon (oxytocin): give slowly as IV infusion, not bolus (causes vasodilation and tachycardia as bolus)
8. Postoperative Management
- Continue invasive monitoring in HDU/ICU for moderate-severe MS
- Rate control is paramount postoperatively - pain and catecholamine surge cause tachycardia
- Adequate analgesia (multimodal, opioids, nerve blocks) to prevent sympathetic tachycardia
- Fluid management: meticulous - avoid overload (pulmonary oedema) and underload (cardiac output compromise)
- DVT prophylaxis (high embolic risk)
- Maintain anticoagulation if in AF
- Watch for postoperative AF and treat promptly
Summary Table: Haemodynamic Goals at a Glance
| Parameter | Desired | Avoid |
|---|---|---|
| Heart rate | 60-80 bpm (slow) | Tachycardia (worst enemy) |
| Rhythm | Sinus (if present) | SVT, new AF |
| Preload | Maintain | Hypovolaemia AND hypervolaemia |
| SVR | Normal-high | Vasodilation |
| PVR | Low | Hypoxia, hypercapnia, N₂O |
| Contractility | Preserve | Myocardial depressants |