
Calculation of mean, median mode and incidence prevalence
Here's a quick overview before I pull in detailed content:
Mean = sum of all values / number of values. Median = middle value when sorted. Mode = most frequently occurring value. Incidence = new cases in a time period / population at risk. Prevalence = all existing cases / total population at a point in time.
Searching sources...
Reading File
Finding Sources
Finding Sources
Finding Sources
Finding Sources
Reading File
Reading File
Finding Sources
Reading File
Reading File
Reading File
Reading File
Finding Sources
Reading File
Reading File
Now I have excellent content from authoritative textbooks. Let me also fetch the diagram from Park's textbook for visual clarity.
Loading Image
Finding Sources
Reading File
Reading File
Reading File
I now have everything needed. Here is the complete, well-sourced answer.
Mean, Median, Mode - and Incidence & Prevalence
PART 1: MEASURES OF CENTRAL TENDENCY
Central tendency in a normal (Gaussian) distribution is characterized by three measures: mean, median, and mode. - Swanson's Family Medicine Review
1. MEAN
The mean is the sum of all values divided by the number of observations.
Formula:
Mean (x̄) = (Sum of all values) / (Number of observations) = Σx / n
Example:
Dataset: 4, 6, 7, 8, 10, 11, 14
- Sum = 60
- n = 7
- Mean = 60 / 7 = 8.57
Geometric mean = the nth root of the product of n numbers. It is used when data follow a log-normal distribution (e.g., antibody titres), as it minimizes the effect of extreme values. - Henry's Clinical Diagnosis and Management by Laboratory Methods
When to use: In a normally distributed (symmetric) dataset, the mean is the best summary statistic. - Rockwood and Green's Fractures in Adults
2. MEDIAN
The median is the value point where the number of observations above equals the number below - i.e., the middle value when data are sorted in order (also called the 50th percentile).
How to calculate:
- Arrange values in ascending order.
- If n is odd: median = the middle value.
- If n is even: median = average of the two middle values.
Example (odd):
Dataset sorted: 4, 6, 7, 8, 10, 11, 14 (n=7)
- Median = 8 (4th value)
Example (even):
Dataset sorted: 4, 6, 7, 8, 10, 11 (n=6)
- Median = (7+8)/2 = 7.5
When to use: The median is preferred when data are skewed or not normally distributed (e.g., income, hospital length of stay, ordinal pain scores). - Rockwood and Green's Fractures in Adults
3. MODE
The mode is the most frequently occurring value in a dataset.
Example:
Dataset: 4, 6, 7, 7, 8, 10, 11, 11, 11, 14
- Mode = 11 (appears 3 times)
A dataset can be:
- Unimodal - one mode
- Bimodal - two modes
- Multimodal - more than two modes
- No mode - all values occur equally
Important note: Standard deviation (SD) is NOT a measure of central tendency - it is a measure of dispersion/spread. - Swanson's Family Medicine Review
Relationship in Normal vs. Skewed Distributions
| Distribution | Mean vs. Median vs. Mode |
|---|---|
| Normal (Gaussian) | Mean = Median = Mode |
| Positively skewed (right) | Mode < Median < Mean |
| Negatively skewed (left) | Mean < Median < Mode |
In a normal distribution: 68.26% of values fall within ±1 SD from the mean; 95.44% within ±2 SD; 99.72% within ±3 SD. - Swanson's Family Medicine Review
PART 2: INCIDENCE AND PREVALENCE
These are the two fundamental measures of disease frequency in epidemiology. - Park's Textbook of Preventive and Social Medicine
1. INCIDENCE RATE
Definition: The number of NEW cases occurring in a defined population during a specified period of time.
Formula:
Incidence Rate = (Number of new cases of a disease during a given time period / Population at risk during that period) × 1000
Example:
- 500 new cases of illness in a population of 30,000 in one year
- Incidence = (500 / 30,000) × 1000 = 16.7 per 1,000 per year
Note: Incidence rate must always include the unit of time (e.g., "per 1,000 per year"). Writing just "16.7 per 1,000" is incomplete. - Park's Textbook of Preventive and Social Medicine
Key features of incidence:
- Counts only new (incident) cases
- Measured over a defined time period
- Denominator = population at risk (disease-free at start)
- Generally used for acute conditions
- Not influenced by disease duration
Incidence Rate (person-time denominator):
Incidence Rate = New cases / Total person-time at risk
This is used in cohort studies where different individuals are followed for different lengths of time.
Special incidence rates:
- Attack rate = (New cases during epidemic / Total population at risk) × 100 - used during outbreaks
- Secondary attack rate = number of exposed persons developing disease within one incubation period after exposure to a primary case
2. PREVALENCE
Definition: "The total number of all individuals who have an attribute or disease at a particular time (or during a particular period) divided by the population at risk of having the attribute or disease at this point in time." - Park's Textbook of Preventive and Social Medicine
Prevalence includes all current cases - both old and new.
(a) Point Prevalence
Point Prevalence = (All current cases at a given point in time / Estimated population at the same point in time) × 100
This is what is meant when "prevalence" is used without further qualification.
(b) Period Prevalence
Period Prevalence = (All existing cases during a defined time interval / Estimated mid-interval population at risk) × 100
Includes cases that started before the period but extended into it, plus new cases arising during the period.
Incidence vs. Prevalence - Visual Illustration
The diagram below from Park's Textbook illustrates the difference clearly. The two vertical lines represent Jan 1 and Dec 31 of a year. Each horizontal bar is a case (open circle = start of illness):
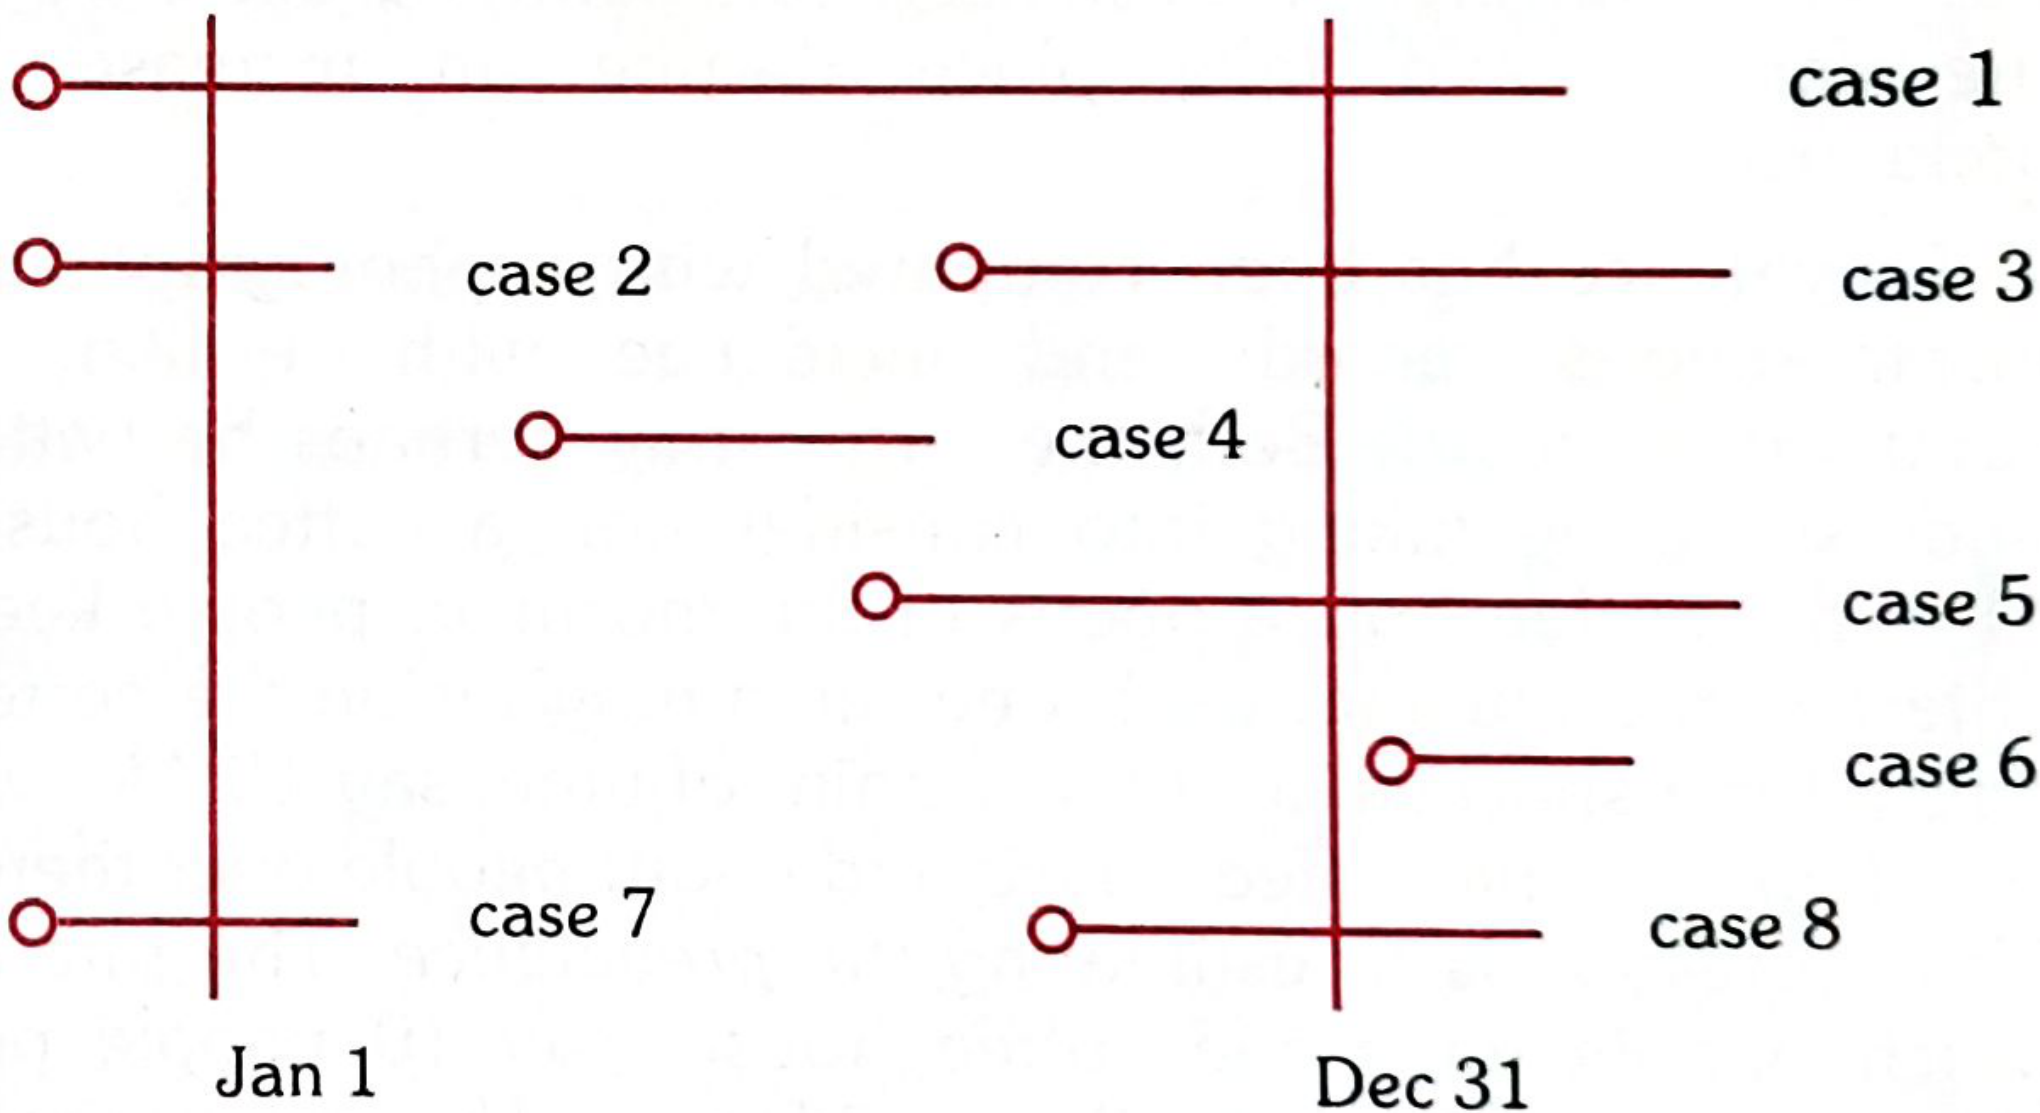
From this diagram:
- Incidence (new cases beginning during the year) = Cases 3, 4, 5, and 8
- Point prevalence (Jan 1) = Cases 1, 2, and 7 (existed on that exact date)
- Point prevalence (Dec 31) = Cases 1, 3, 5, and 8
- Period prevalence (Jan-Dec) = Cases 1, 2, 3, 4, 5, 7, and 8 (all that existed at any time during the year)
3. RELATIONSHIP BETWEEN INCIDENCE AND PREVALENCE
Prevalence depends on two factors: incidence and duration of illness. For a stable population:
P = I × D (Prevalence = Incidence × Mean Duration)
Example:
- Incidence = 10 cases per 1,000 population per year
- Mean duration of disease = 5 years
- Prevalence = 10 × 5 = 50 per 1,000 population
Conversely: Incidence = P / D and Duration = P / I
Key implications of P = I × D: - Park's Textbook of Preventive and Social Medicine
| Situation | Effect on Prevalence |
|---|---|
| High incidence + long duration (e.g., TB, lupus) | High prevalence relative to incidence |
| Acute, short-duration disease (e.g., food poisoning) | Prevalence ≈ incidence (very low prevalence) |
| Rapidly fatal disease | Negligible prevalence |
| Better treatment shortens duration | Prevalence falls (even if incidence unchanged) |
| Treatment prevents death but not cure | Prevalence paradoxically rises |
As Rheumatology (Elsevier, 2022) notes, diseases like systemic lupus have relatively low incidence but long duration - so prevalence is much higher than incidence. This is also why prevalent cases may be a healthier subset ("survivor bias" or depletion of susceptibles).
Quick Comparison Table
| Feature | Incidence | Prevalence |
|---|---|---|
| Cases counted | New cases only | All existing cases (old + new) |
| Time element | Rate over a defined period | Snapshot at a point or period |
| Denominator | Population at risk (disease-free) | Total population |
| Expressed as | Rate per 1,000 per year | Ratio / % |
| Best used for | Aetiology, causation, acute disease | Disease burden, chronic disease planning |
| Analogy | A film (continuous record) | A photograph (instantaneous record) |
Sources: Park's Textbook of Preventive and Social Medicine; Rockwood and Green's Fractures in Adults (10th ed.); Henry's Clinical Diagnosis and Management by Laboratory Methods; Swanson's Family Medicine Review; Rheumatology (Elsevier, 2022)
This is a shared conversation. Sign in to Orris to start your own chat.