
Cardiac cycle
Reading File
Now let me search the medical library for cardiac cycle content.
Finding Sources
Finding Sources
Excellent results. Let me read the best physiology sources - Guyton & Hall, Costanzo, and grab key images.
Reading File
Reading File
Reading File
Now let me fetch the key diagram images and get more detail from Guyton & Hall on the Wiggers diagram and phases.
Reading File
Reading File
Loading Image
Let me also fetch the Costanzo Wiggers diagram and get more detail from the Costanzo phases.
Loading Image
Reading File
I now have excellent, comprehensive content from multiple authoritative textbooks. Let me compile the full answer.
The Cardiac Cycle
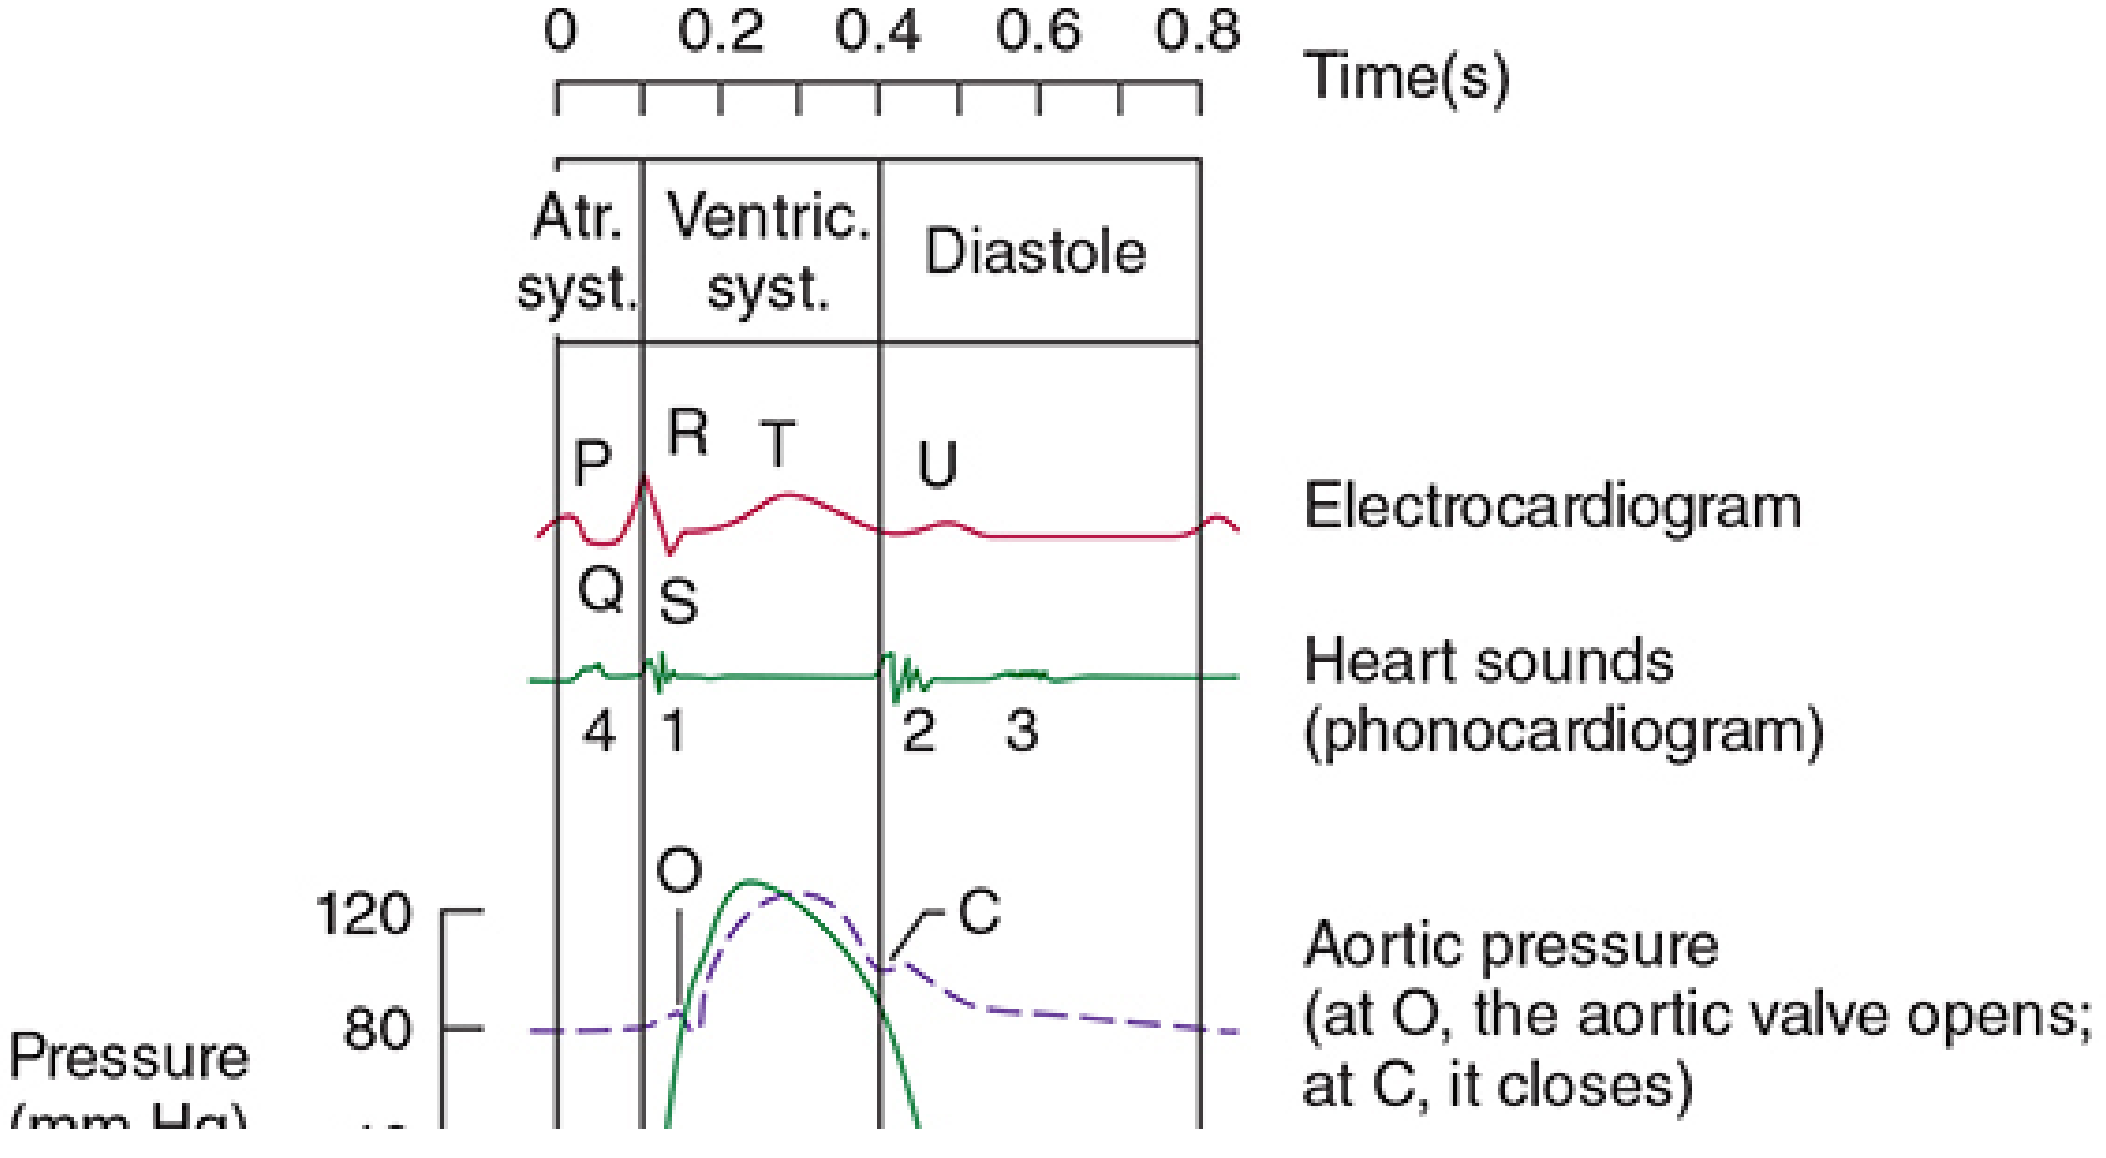
The cardiac cycle encompasses all the electrical and mechanical events that occur from the beginning of one heartbeat to the beginning of the next. At a resting heart rate of 72 beats/min, one complete cycle lasts approximately 0.833 seconds. - Guyton and Hall Textbook of Medical Physiology
Wiggers Diagram
The diagram below (from Morgan & Mikhail's Clinical Anesthesiology) correlates the ECG, heart sounds, aortic pressure, ventricular pressure, and volume over one full cycle:
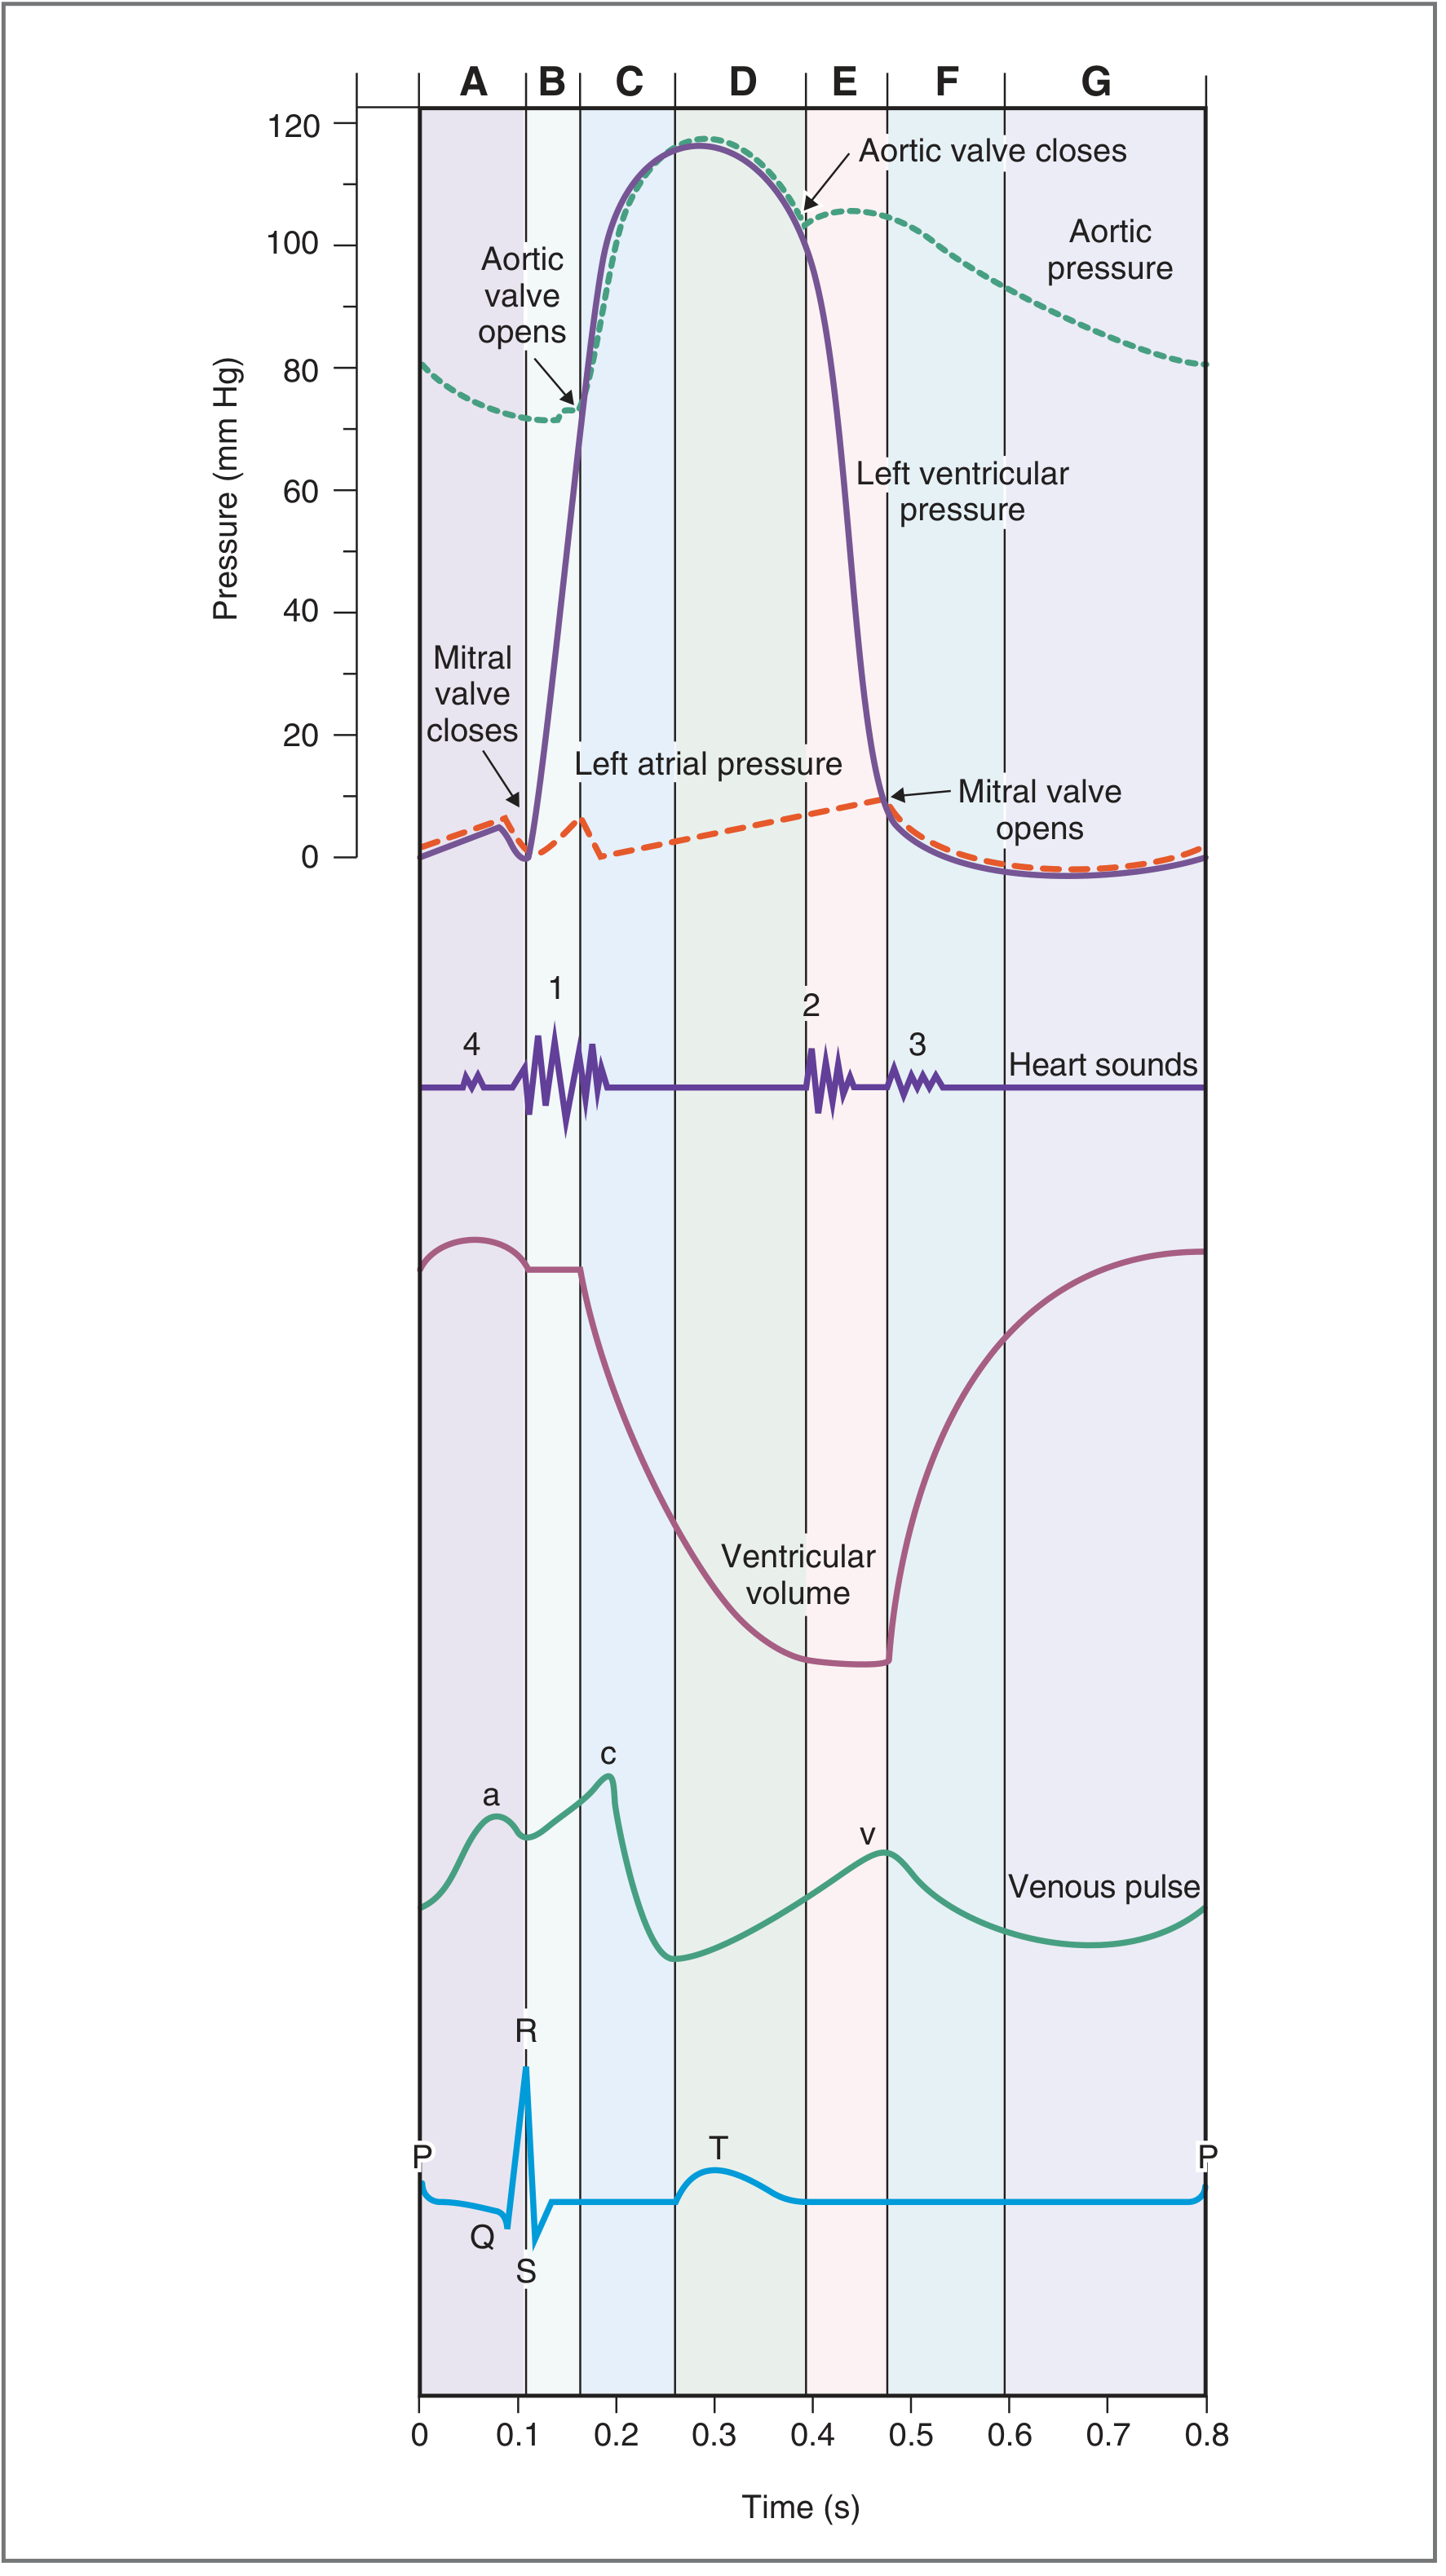
The comprehensive Wiggers diagram below from Costanzo Physiology shows all 7 phases with pressure, volume, venous pulse, and ECG:
Initiation
Each cycle is initiated by a spontaneous action potential from the sinoatrial (SA) node in the superior lateral wall of the right atrium. The impulse travels through both atria and, after a delay of >0.1 second at the AV node, into the ventricles. This delay is critical - it lets the atria contract first, acting as "primer pumps" before the stronger ventricular contraction begins. - Guyton and Hall
The Seven Phases (Costanzo)
Phase A - Atrial Systole
- ECG: P wave (atrial depolarization)
- Events: Atria contract, actively ejecting blood through the open mitral valve into the relaxed left ventricle. This provides the final 20-30% of ventricular filling (ventricular filling occurs passively for the first ~70-80% during diastole before atrial contraction)
- Valve status: Mitral valve open; aortic valve closed
- Venous pulse: a wave (rise in atrial pressure transmitted back to veins)
- Heart sound: S4 (not normally audible; heard in ventricular hypertrophy where compliance is reduced)
Phase B - Isovolumetric Ventricular Contraction (IVC)
- ECG: QRS complex (ventricular depolarization)
- Events: Ventricles begin contracting; LV pressure rises sharply. As soon as LV pressure exceeds LA pressure, the mitral valve closes. All valves are now closed, so ventricular volume stays constant despite rising pressure
- Valve status: Both mitral and aortic valves closed
- Heart sound: S1 ("lub") - closure of AV valves (mitral closes slightly before tricuspid, so S1 may be physiologically split)
- Key point: This is the phase of highest energy consumption relative to work output
Phase C - Rapid Ventricular Ejection
- ECG: ST segment
- Events: Ventricular pressure exceeds aortic pressure - the aortic valve opens. Most of the stroke volume (~70%) is ejected rapidly. Ventricular volume falls steeply; aortic pressure rises to its peak (~120 mmHg systolic). Atrial filling from the pulmonary veins begins
- Valve status: Aortic valve open; mitral valve closed
- Heart sound: None
Phase D - Reduced Ventricular Ejection
- ECG: T wave (ventricular repolarization begins)
- Events: Ventricle begins to repolarize and relax; ejection continues at a slower rate. Ventricular pressure falls but remains above aortic pressure so the aortic valve stays open. Blood "runs off" into the arteries faster than it arrives from the ventricle, so aortic pressure begins to fall. Ventricular volume reaches its minimum (= End-Systolic Volume, ESV ~50 mL)
- Valve status: Aortic valve still open; mitral valve closed
Phase E - Isovolumetric Ventricular Relaxation (IVR)
- ECG: End of T wave
- Events: LV pressure falls below aortic pressure - the aortic valve closes. All valves are now closed again; ventricular volume stays constant despite falling pressure. Atrial pressure has built up and is waiting
- Valve status: Both valves closed
- Heart sound: S2 ("dub") - closure of semilunar valves. Aortic valve closes slightly before pulmonic valve. Physiological splitting of S2 occurs during inspiration (increased venous return to RV prolongs right ventricular ejection, delaying pulmonic valve closure)
- Incisura (dicrotic notch): Small notch on the aortic pressure tracing caused by brief backflow of blood into the LV just before aortic valve closure
Phase F - Rapid Ventricular Filling
- ECG: Baseline (between T and next P wave)
- Events: LV pressure falls below LA pressure - the mitral valve opens. Blood that has accumulated in the left atrium rushes rapidly into the relaxed ventricle. Ventricular volume rises steeply
- Valve status: Mitral valve open; aortic valve closed
- Venous pulse: v wave (rise in atrial pressure from venous return) followed by y descent as the mitral valve opens and atrial pressure falls
- Heart sound: S3 - produced by rapid ventricular filling causing the ventricular wall to vibrate. Pathological in adults >40 years (indicates heart failure); physiological in children and young adults
Phase G - Reduced Ventricular Filling (Diastasis)
- ECG: Baseline
- Events: Filling rate slows as the ventricular pressure equilibrates with atrial pressure. Ventricular volume approaches End-Diastolic Volume (EDV ~120 mL). This phase transitions into the next atrial systole
- Valve status: Mitral valve open; aortic valve closed
Summary Table
| Phase | ECG | Mitral Valve | Aortic Valve | Heart Sound |
|---|---|---|---|---|
| A - Atrial Systole | P wave | Open | Closed | S4 |
| B - Isovolumetric Contraction | QRS | Closes (S1) | Closed | S1 |
| C - Rapid Ejection | ST segment | Closed | Opens | - |
| D - Reduced Ejection | T wave | Closed | Open | - |
| E - Isovolumetric Relaxation | End of T | Closed | Closes (S2) | S2 |
| F - Rapid Filling | Baseline | Opens | Closed | S3 |
| G - Diastasis | Baseline | Open | Closed | - |
Key Values at Normal Heart Rate (72 bpm)
| Parameter | Value |
|---|---|
| Cycle duration | ~0.833 sec |
| Systole duration | ~0.3 sec |
| Diastole duration | ~0.5 sec |
| End-Diastolic Volume (EDV) | ~120-130 mL |
| End-Systolic Volume (ESV) | ~50-60 mL |
| Stroke Volume (SV = EDV - ESV) | ~70 mL |
| Ejection Fraction (EF = SV/EDV) | ~60-65% |
Atrial (Jugular Venous) Pressure Waves
Three waves appear on atrial/central venous pressure tracings synchronized to the cardiac cycle:
- a wave - atrial systole (contraction)
- c wave - ventricular contraction; AV valve bulges back into the atrium
- v wave - venous return builds up in the atrium while the AV valve is closed
- x descent - atrium pulled downward by ventricular contraction (between c and v waves)
- y descent - atrial pressure falls as the AV valve opens
Incompetence of an AV valve abolishes the x descent on that side and produces a prominent cv wave. - Morgan & Mikhail's Clinical Anesthesiology
Effect of Heart Rate on Cycle Duration
When heart rate increases, diastole is shortened disproportionately more than systole. At 72 bpm, systole is ~40% of the cycle. At very high rates (~216 bpm), systole can be ~65% of the cycle. This means at very fast rates, the heart does not have adequate time for ventricular filling, which can reduce cardiac output. - Guyton and Hall
Sources: Costanzo Physiology 7th Edition | Guyton and Hall Textbook of Medical Physiology | Morgan & Mikhail's Clinical Anesthesiology 7e
Conduction of heart
Finding Sources
Finding Sources
Reading File
Reading File
Finding Sources
Reading File
Reading File
Finding Sources
Finding Sources
Loading Image
Finding Sources
Reading File
Finding Sources
Finding Sources
Reading File
Finding Sources
Loading Image
Reading File
Your credits are exhausted. You can purchase a top-up or subscribe to a plan to continue using Orris. If you're already subscribed, your daily credits will reset tomorrow.
Lateral wall of nose
Your credits are exhausted. You can purchase a top-up or subscribe to a plan to continue using Orris. If you're already subscribed, your daily credits will reset tomorrow.
This is a shared conversation. Sign in to Orris to start your own chat.