
utility of flow cytometry in diagnosis of leukemia
"flow cytometry" AND leukemia AND immunophenotyping
flow cytometry leukemia immunophenotyping scatter plot
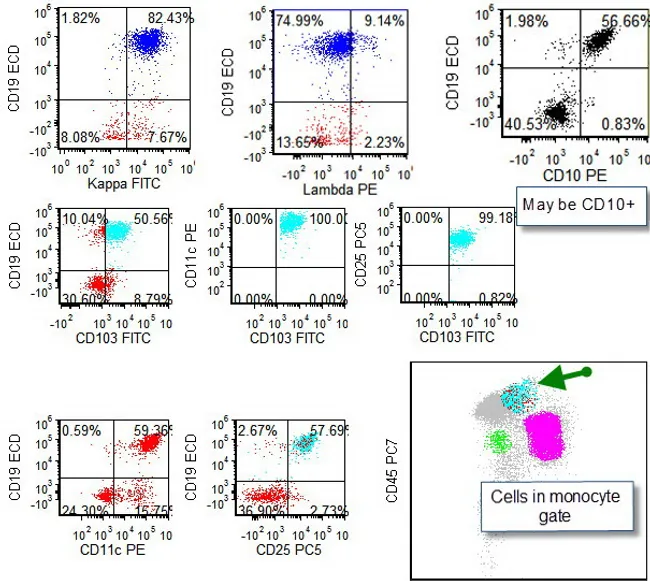
Flow cytometry immunophenotyping of peripheral blood mononuclear cells demonstrating classic hairy cell leukemia phenotype. The panels shown include forward scatter (FSC) and side scatter (SSC) gating with cells occupying the monocyte region outside the lymphocyte gate. The immunophenotype reveals bright CD45 expression with coexpression of B-cell markers including CD19, CD20 (bright), CD22 and CD79a, along with the characteristic hairy cell markers CD11c, CD25, CD103, and CD123. CD79b and CD5 are typically negative; CD10 may be variably expressed in about 10-25% of classic HCL cases as seen here. The combination of CD11c+, CD103+, CD25+, and CD123+ with strong CD19/CD20 and FMC-7 supports a diagnosis of hairy cell leukemia and helps distinguish it from CLL, MCL, and other B-cell neoplasms. The image emphasizes a pattern where neoplastic hairy cells appear outside the lymphocyte gate and within the monocyte gate panels, reflecting the characteristic light-scatter profile (high forward scatter and slightly elevated side scatter). Clinically, this immunophenotype informs treatment planning with purine analogs (cladribine, pentostatin) and supports mutation testing (BRAF V600E) for diagnostic confirmation. This dataset is suitable for education, differential diagnosis teaching, and MRD monitoring by flow cytometry. The image serves as an educational reference for hematology trainees and clinicians in practice.
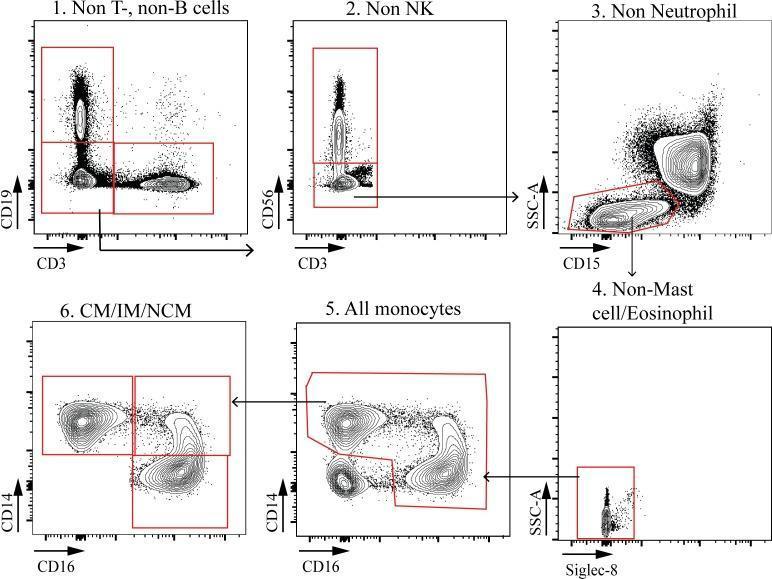
This diagnostic image series presents a polychromatic flow cytometry gating strategy for the identification and classification of peripheral blood monocyte subsets in pediatric patients. The workflow consists of six sequential contour and dot plots designed to systematically exclude non-monocyte lineages. Initial gates (Plots 1-4) utilize negative selection to eliminate T cells (CD3+), B cells (CD19+), Natural Killer cells (CD56+), and neutrophils (CD15+ high SSC-A). The use of Side Scatter (SSC-A) versus Siglec-8 in Plot 4 further excludes eosinophils and mast cells based on internal complexity and specific surface markers. Plot 5 identifies the 'All monocytes' population using CD14 and CD16 markers. Plot 6 provides the final subclassification into three distinct functional subsets: classical monocytes (CM; CD14++CD16-), intermediate monocytes (IM; CD14++CD16+), and non-classical monocytes (NCM; CD14+CD16++). This sequence demonstrates the rigorous methodology required for immunophenotyping circulating myeloid cells, highlighting the combination of morphological properties (SSC-A) and specific clusters of differentiation (CD) for precise cell population isolation.
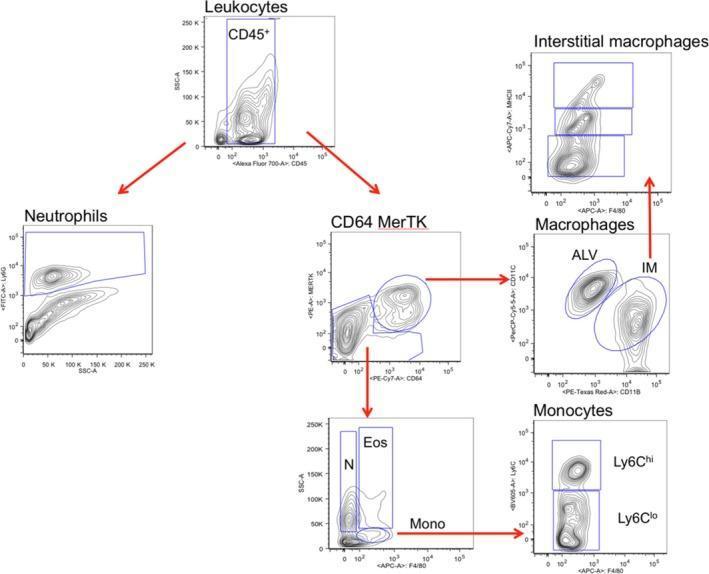
Flow cytometry gating strategy for the identification of leukocyte subpopulations in mouse lung tissue. The hierarchical analysis begins with CD45+ leukocytes gated on side scatter (SSC-A) versus CD45. This population branches into two paths: a neutrophil gate (left) defined by Ly6G expression, and a myeloid gate (right) further analyzed for CD64 and MerTK. The CD64+MerTK+ subset defines macrophages, which are subdivided into Alveolar Macrophages (ALV, CD11b-) and Interstitial Macrophages (IM, CD11b+) using a CD11c versus CD11b plot. IM are further categorized by MHCII expression levels (high, intermediate, low). The CD64-MerTK- branch is differentiated via F4/80 and SSC-A into neutrophils (N, F4/80 low), eosinophils (Eos, F4/80 intermediate), and monocytes (Mono, F4/80 high). Monocytes are finally subdivided into Ly6Chi and Ly6Clo populations. This multi-parametric approach demonstrates the precise immunophenotyping used to distinguish resident and recruited immune cells in pulmonary ischemia models.
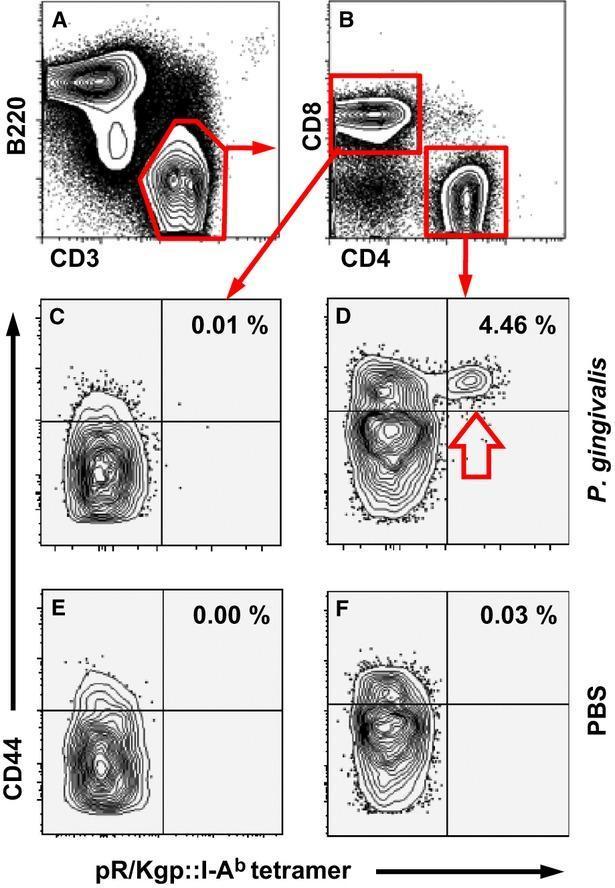
Educational flow cytometry (FACS) contour plots illustrating the immunophenotyping and gating strategy for antigen-specific T cell identification in a murine model of Porphyromonas gingivalis infection. Plot A demonstrates the initial gating of lymphocytes into B cells (B220+) and T cells (CD3+). Plot B shows the sub-gating of CD3+ T cells into CD8+ and CD4+ populations. Panels C through F utilize quad gates to analyze the expression of CD44 versus pR/Kgp::I-Ab tetramer staining to identify antigen-experienced, specific cells. Plots C and D represent mice inoculated with P. gingivalis, while E and F represent PBS-treated controls. A significant expansion of pR/Kgp-specific CD4+ T cells (4.46%) is visible in plot D (indicated by a red arrow), compared to negligible frequencies in the CD8+ control (C) and the PBS sham-treated groups (E, F). This visual data serves as a diagnostic pathway for analyzing clonal expansion of CD4+ T cells in response to specific bacterial antigens.
Flow Cytometry in the Diagnosis of Leukemia
1. Principle of Flow Cytometry
- Forward scatter (FSC) - correlates with cell size
- Side scatter (SSC) - correlates with internal granularity
- Fluorescence channels - quantify specific antigen expression
2. Blast Identification and Confirmation
| Marker | Significance |
|---|---|
| CD34 | Stem/progenitor cell marker |
| CD117 (c-Kit) | Early myeloid progenitor |
| TdT (terminal deoxynucleotidyl transferase) | Pre-B and pre-T lymphoid blasts; sensitive but not entirely specific for ALL |
| CD133, CD99 | Additional immaturity markers |
| HLA-DR | Present on AML blasts (absent in APL) |
A caveat: abnormal promyelocytes in acute promyelocytic leukemia (APL) and immature monocytes in AML with monocytic differentiation are often excluded from the standard blast gate. Basophils, plasmacytoid dendritic cells, and hypogranular neutrophils can also occupy the blast gate and must not be misidentified as blasts. - Henry's Clinical Diagnosis and Management by Laboratory Methods
3. Lineage Assignment: AML vs. ALL
"The major role for flow cytometry in acute leukemia is classification. The determination of lineage in particular is a decision of major therapeutic importance." - Henry's Clinical Diagnosis and Management
Myeloid Lineage Markers (AML)
| Marker | Notes |
|---|---|
| MPO (myeloperoxidase) | Most lineage-specific myeloid marker (cytoplasmic) |
| CD13, CD33 | Pan-myeloid; not lineage-specific alone |
| CD117 | Early myeloid |
| CD11b, CD15, CD16 | Granulocytic maturation |
| CD14, CD64 | Monocytic differentiation |
| CD41, CD61 | Megakaryocytic lineage (required to diagnose AML-M7) |
| CD235a (glycophorin A) | Erythroid lineage |
"Acute megakaryoblastic leukemia can often be diagnosed only by expression of CD41 and/or CD61." - Harrison's Principles of Internal Medicine, 22E
Lymphoid Lineage Markers
- CD19, CD22 (dim), CD10, CD79a, TdT, CD34
- Surface immunoglobulin typically absent
- Low-level CD13/CD33 may be seen (does not indicate myeloid differentiation)
- CD2, CD3 (cytoplasmic), CD5, CD7, CD1a, TdT
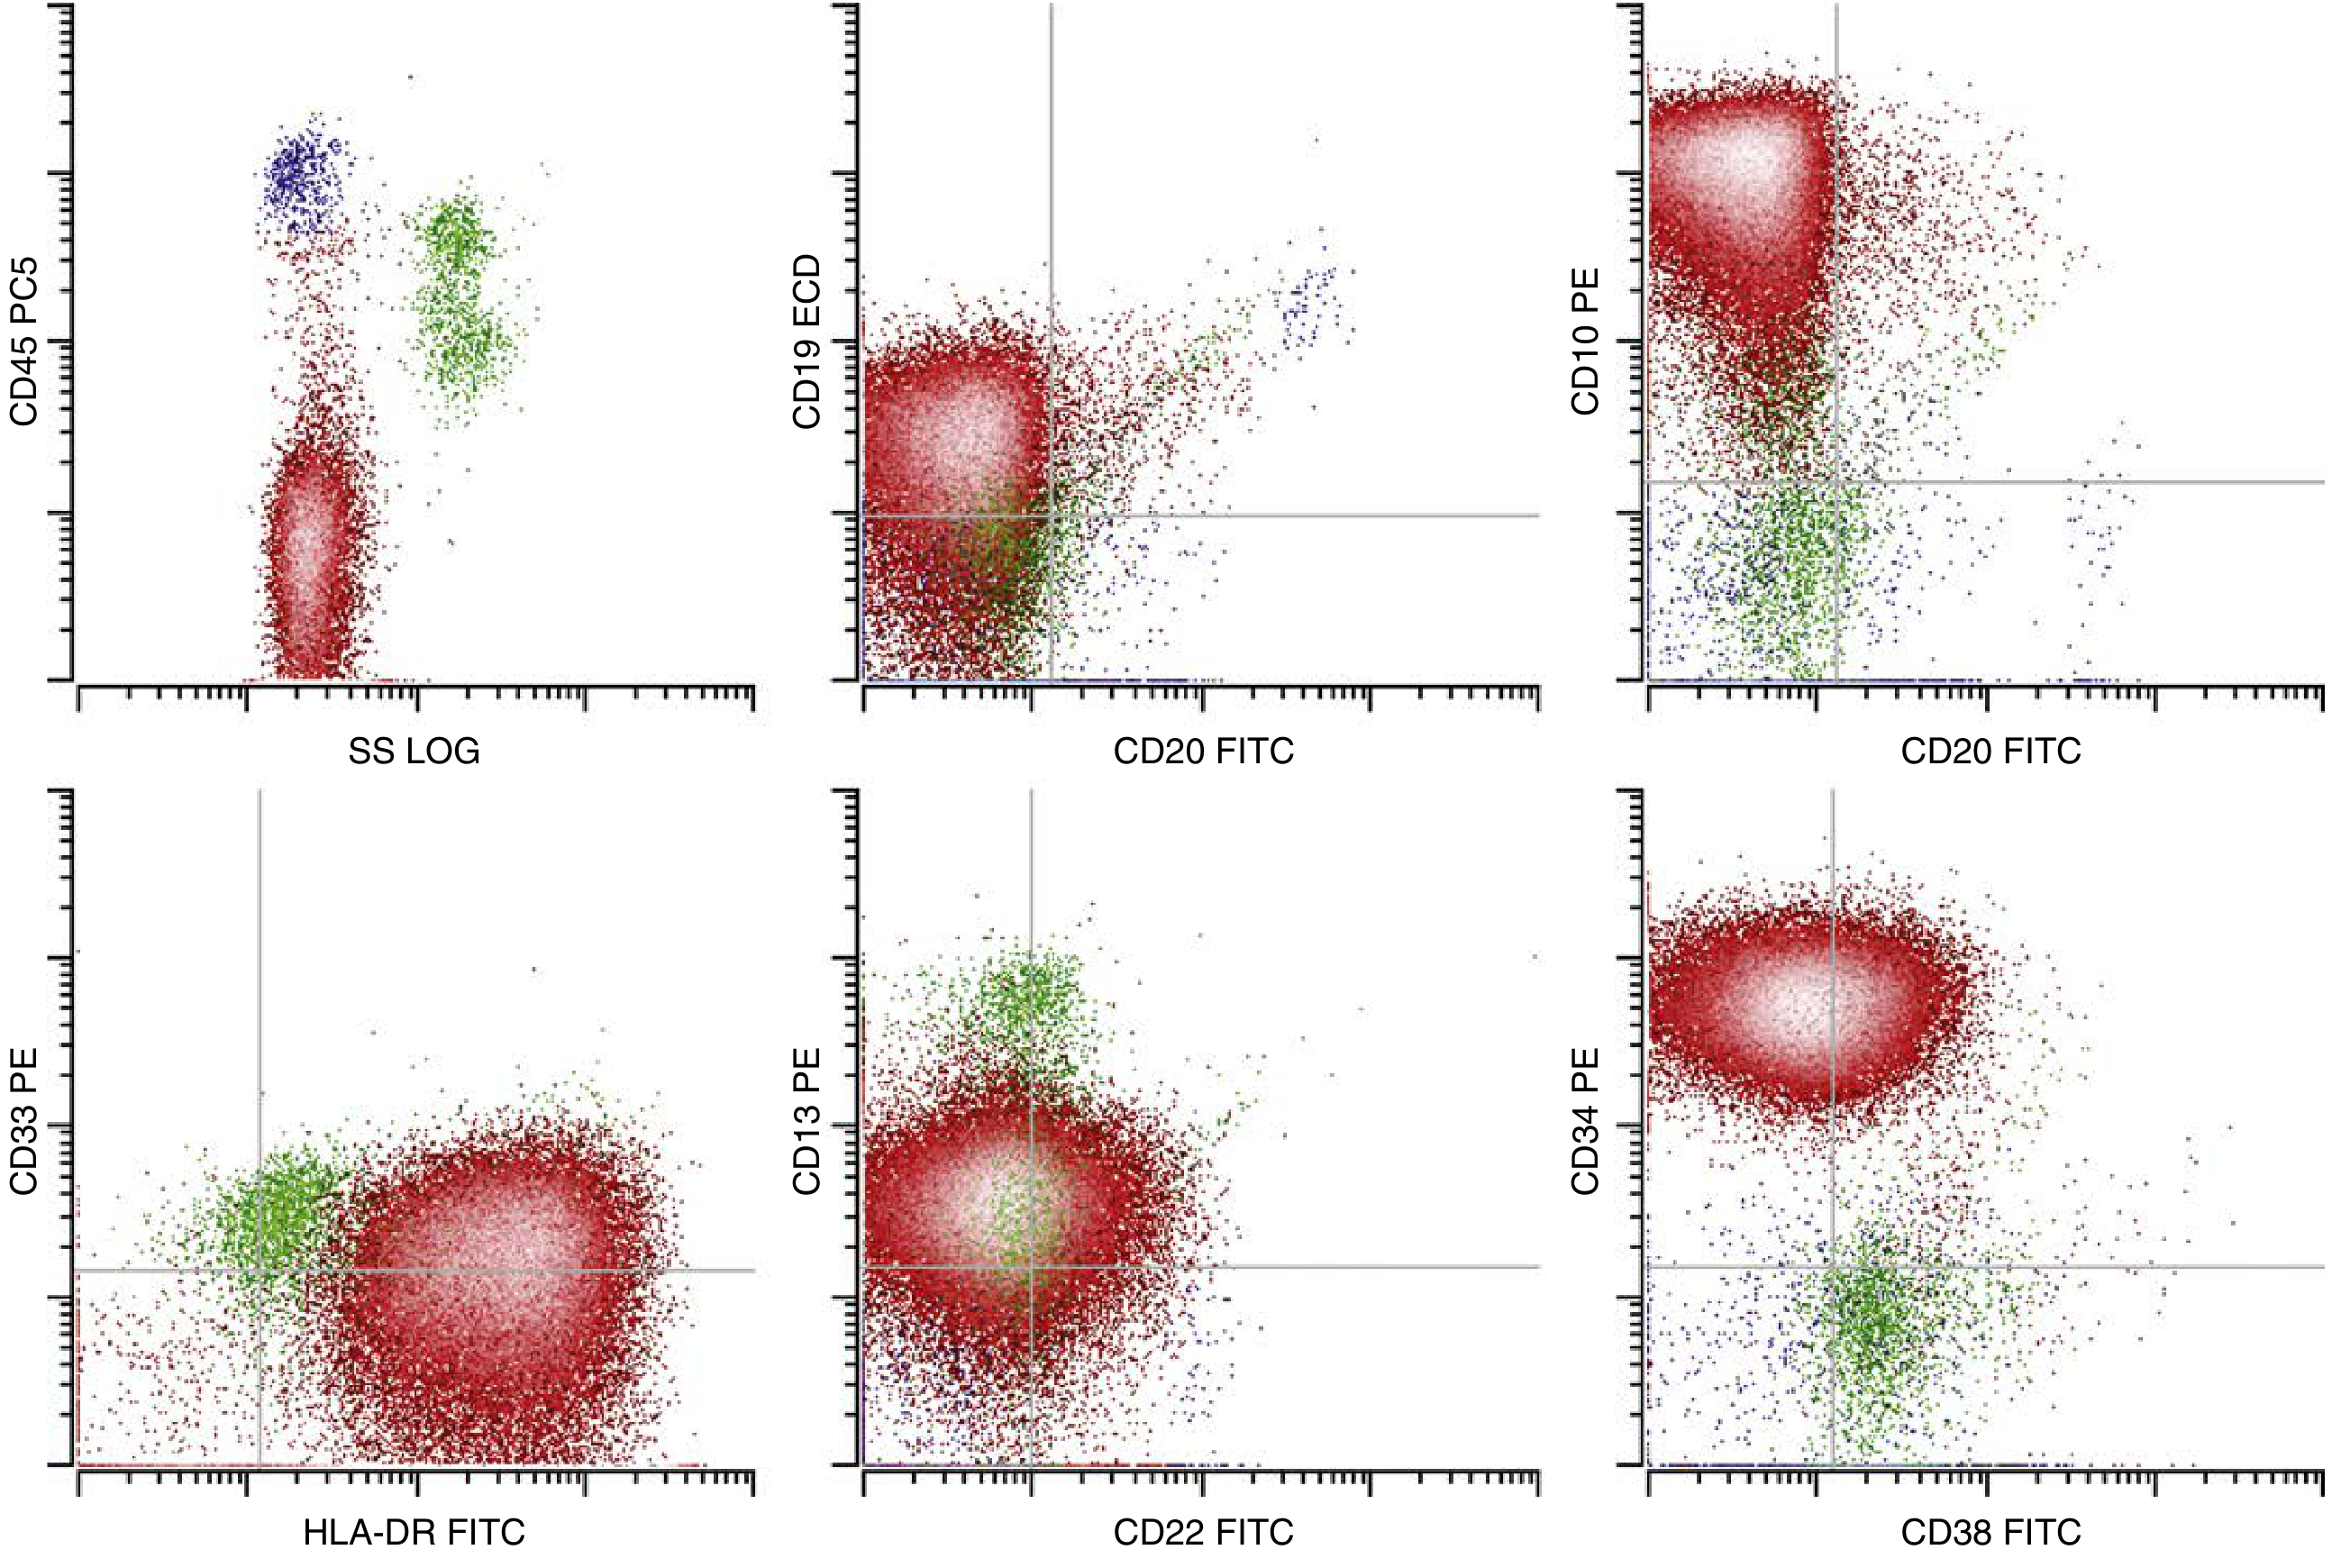
Representative FC Plot - B-ALL:
4. Mixed Phenotype Acute Leukemia (MPAL)
- Biphenotypic leukemia: a single blast population co-expressing myeloid and lymphoid antigens
- Bilineal leukemia: two distinct blast populations, each with different lineage
5. Specific Leukemia Subtypes
Chronic Lymphocytic Leukemia (CLL)
- CD5+, CD19+, CD23+, CD20 (dim), surface Ig (dim), CD10-, CD103-, FMC-7-
Hairy Cell Leukemia (HCL)
Acute Promyelocytic Leukemia (APL)
6. Distinguishing Leukemia from Reactive Conditions
- Hematogones (normal immature B-cell precursors): by multiparameter analysis showing normal maturational antigen progression in hematogones vs. aberrant/frozen immunophenotype in B-ALL
- Reactive monocytosis vs. CMML
- Monoclonal B-cell lymphocytosis (MBL) vs. CLL
7. Minimal/Measurable Residual Disease (MRD) Monitoring
"Minimal/measurable residual disease (MRD) is defined as residual disease present at a level below the limit of morphologic detection. Flow cytometry and molecular methods are both more specific and sensitive for identifying leukemic cells than is morphology." - Henry's Clinical Diagnosis and Management
- ALL: MRD-negative patients have ~70% disease-free survival vs. <40% for MRD-positive patients (Harrison's, 22E)
- AML: Multiple studies confirm MRD correlates with relapse risk
8. Clonality Assessment in Lymphoid Neoplasms
- B-cell neoplasms: Light chain restriction (κ-only or λ-only surface immunoglobulin), which indicates monoclonal B-cell proliferation
- T-cell neoplasms: Restricted expression of Vβ families of the T-cell receptor
- NK-cell neoplasms: Restricted killer-inhibitory receptor (KIR) expression
9. Practical Specimen Considerations
| Sample Type | Use Case |
|---|---|
| Peripheral blood | Initial screening; blood involvement (e.g., CLL, acute leukemia with circulating blasts) |
| Bone marrow aspirate | Primary diagnostic sample for acute leukemias and MRD |
| Body fluids (CSF, pleural) | Involvement assessment |
| Lymph node/tissue disaggregation | Lymphoma diagnosis |
10. Advantages and Limitations
- Rapid (results in hours vs. days for some molecular tests)
- Simultaneously measures 8-30+ parameters per cell
- Quantitative and highly sensitive for MRD
- Works on small sample volumes
- Detects aberrant antigen co-expression not visible by morphology
- Requires fresh viable cells
- Operator-dependent interpretation
- Cannot detect cytogenetic or molecular abnormalities (requires FISH, PCR, NGS)
- Immunophenotypic shifts at relapse can complicate MRD interpretation
- Some rare leukemias lack definitive FC signatures
Summary Table: FC Applications in Leukemia
| Application | What FC Does | Clinical Impact |
|---|---|---|
| Blast identification | CD45/SSC gating + immaturity markers | Confirms acute leukemia |
| Lineage assignment | Myeloid vs. lymphoid panel | Determines AML vs. ALL treatment |
| Subtype classification | Specific differentiation antigens | Guides subtype-specific therapy (e.g., ATRA for APL) |
| MPAL detection | Cytoplasmic + surface multi-lineage markers | Identifies rare, aggressive entity |
| MRD monitoring | LAIP tracking post-therapy | Strongest prognostic factor; guides SCT decisions |
| Mature lymphoid neoplasms | Light chain restriction, CD5/CD23 patterns | CLL, HCL, lymphoma diagnosis |
| Clonality assessment | Ig light chain, TCR Vβ restriction | Distinguishes reactive from neoplastic |
- Henry's Clinical Diagnosis and Management by Laboratory Methods - primary source, Chapter 35
- Robbins & Kumar Basic Pathology - immunophenotyping in acute leukemia
- Harrison's Principles of Internal Medicine, 22E - MRD and AML classification
- Recent systematic review: Ross et al. 2025 - limited FC panel in resource-constrained settings (PMID 40122748)