Different types of MI WITH IMAGES AND EXPLAIN
Reading File
Finding Sources
Finding Sources
Finding Sources
Reading File
Reading File
Finding Sources
Finding Sources
Reading File
Reading File
Reading File
Loading Image
Loading Image
Loading Image
Reading File
Loading Image
Finding Sources
I now have more than enough information to write a thorough, well-illustrated answer. Let me now compose it.
Types of Myocardial Infarction (MI)
Myocardial infarction is classified by two overlapping systems: the clinical/etiologic classification (Types 1-5) from the Universal Definition of MI, and the anatomopathological classification based on depth (transmural vs. subendocardial) and ECG pattern (STEMI vs. NSTEMI, Q-wave vs. non-Q-wave).
Part 1: Clinical Classification (Universal Definition - Types 1-5)
(Source: Tietz Textbook of Laboratory Medicine, 7th Ed., Box 48.3; Harrison's Principles of Internal Medicine 22E, 2025)
Type 1 - Spontaneous MI (Atherothrombotic)
The most common type. Caused by atherosclerotic plaque rupture, ulceration, fissuring, erosion, or dissection, leading to intraluminal thrombus in one or more coronary arteries. This reduces myocardial blood flow or causes distal platelet emboli, resulting in myocyte necrosis.
- The patient usually has underlying severe coronary artery disease (CAD), though occasionally nonobstructive or no CAD is found.
- This is the classic "heart attack" most people envision.
Type 2 - MI Secondary to Ischemic Imbalance (Non-Atherothrombotic)
Myocardial injury with necrosis where a condition other than CAD causes an imbalance between myocardial oxygen supply and demand. Causes include:
- Coronary endothelial dysfunction
- Coronary artery spasm (vasospastic/Prinzmetal's angina)
- Coronary embolism
- Tachyarrhythmia or bradyarrhythmia
- Anemia, respiratory failure
- Hypotension or severe hypertension with/without LV hypertrophy
Type 3 - MI Resulting in Death Before Biomarkers Available
Cardiac death with symptoms suggestive of ischemia and presumed new ischemic ECG changes or new LBBB, but death occurring before blood samples could be obtained or before cardiac biomarkers could rise.
Type 4a - MI Related to Percutaneous Coronary Intervention (PCI)
MI occurring within 48 hours of a PCI procedure. Defined by:
- Elevation of cardiac troponin (cTn) >5× the 99th percentile URL in patients with normal baseline
- OR a rise >20% if baseline cTn is elevated and stable/falling
- Plus at least one of: new ischemic ECG changes, new pathologic Q waves, imaging evidence of new loss of viable myocardium, or angiographic procedural complication
Type 4b - MI Related to Stent Thrombosis
Confirmed by angiography or autopsy in the setting of stent thrombosis.
Type 4c - MI Related to Restenosis
Type 5 - MI Related to Coronary Artery Bypass Grafting (CABG)
Defined by cTn elevation >10× the 99th percentile URL within 48 hours post-CABG (vs. 5× for Type 4a), plus at least one of: new pathologic Q waves, imaging evidence of new loss of viable myocardium, or angiographic occlusion of graft or native artery.
(Harrison's Principles of Internal Medicine 22E, p. 2161-2162)
Part 2: Anatomopathological Classification
Based on Depth of Necrosis
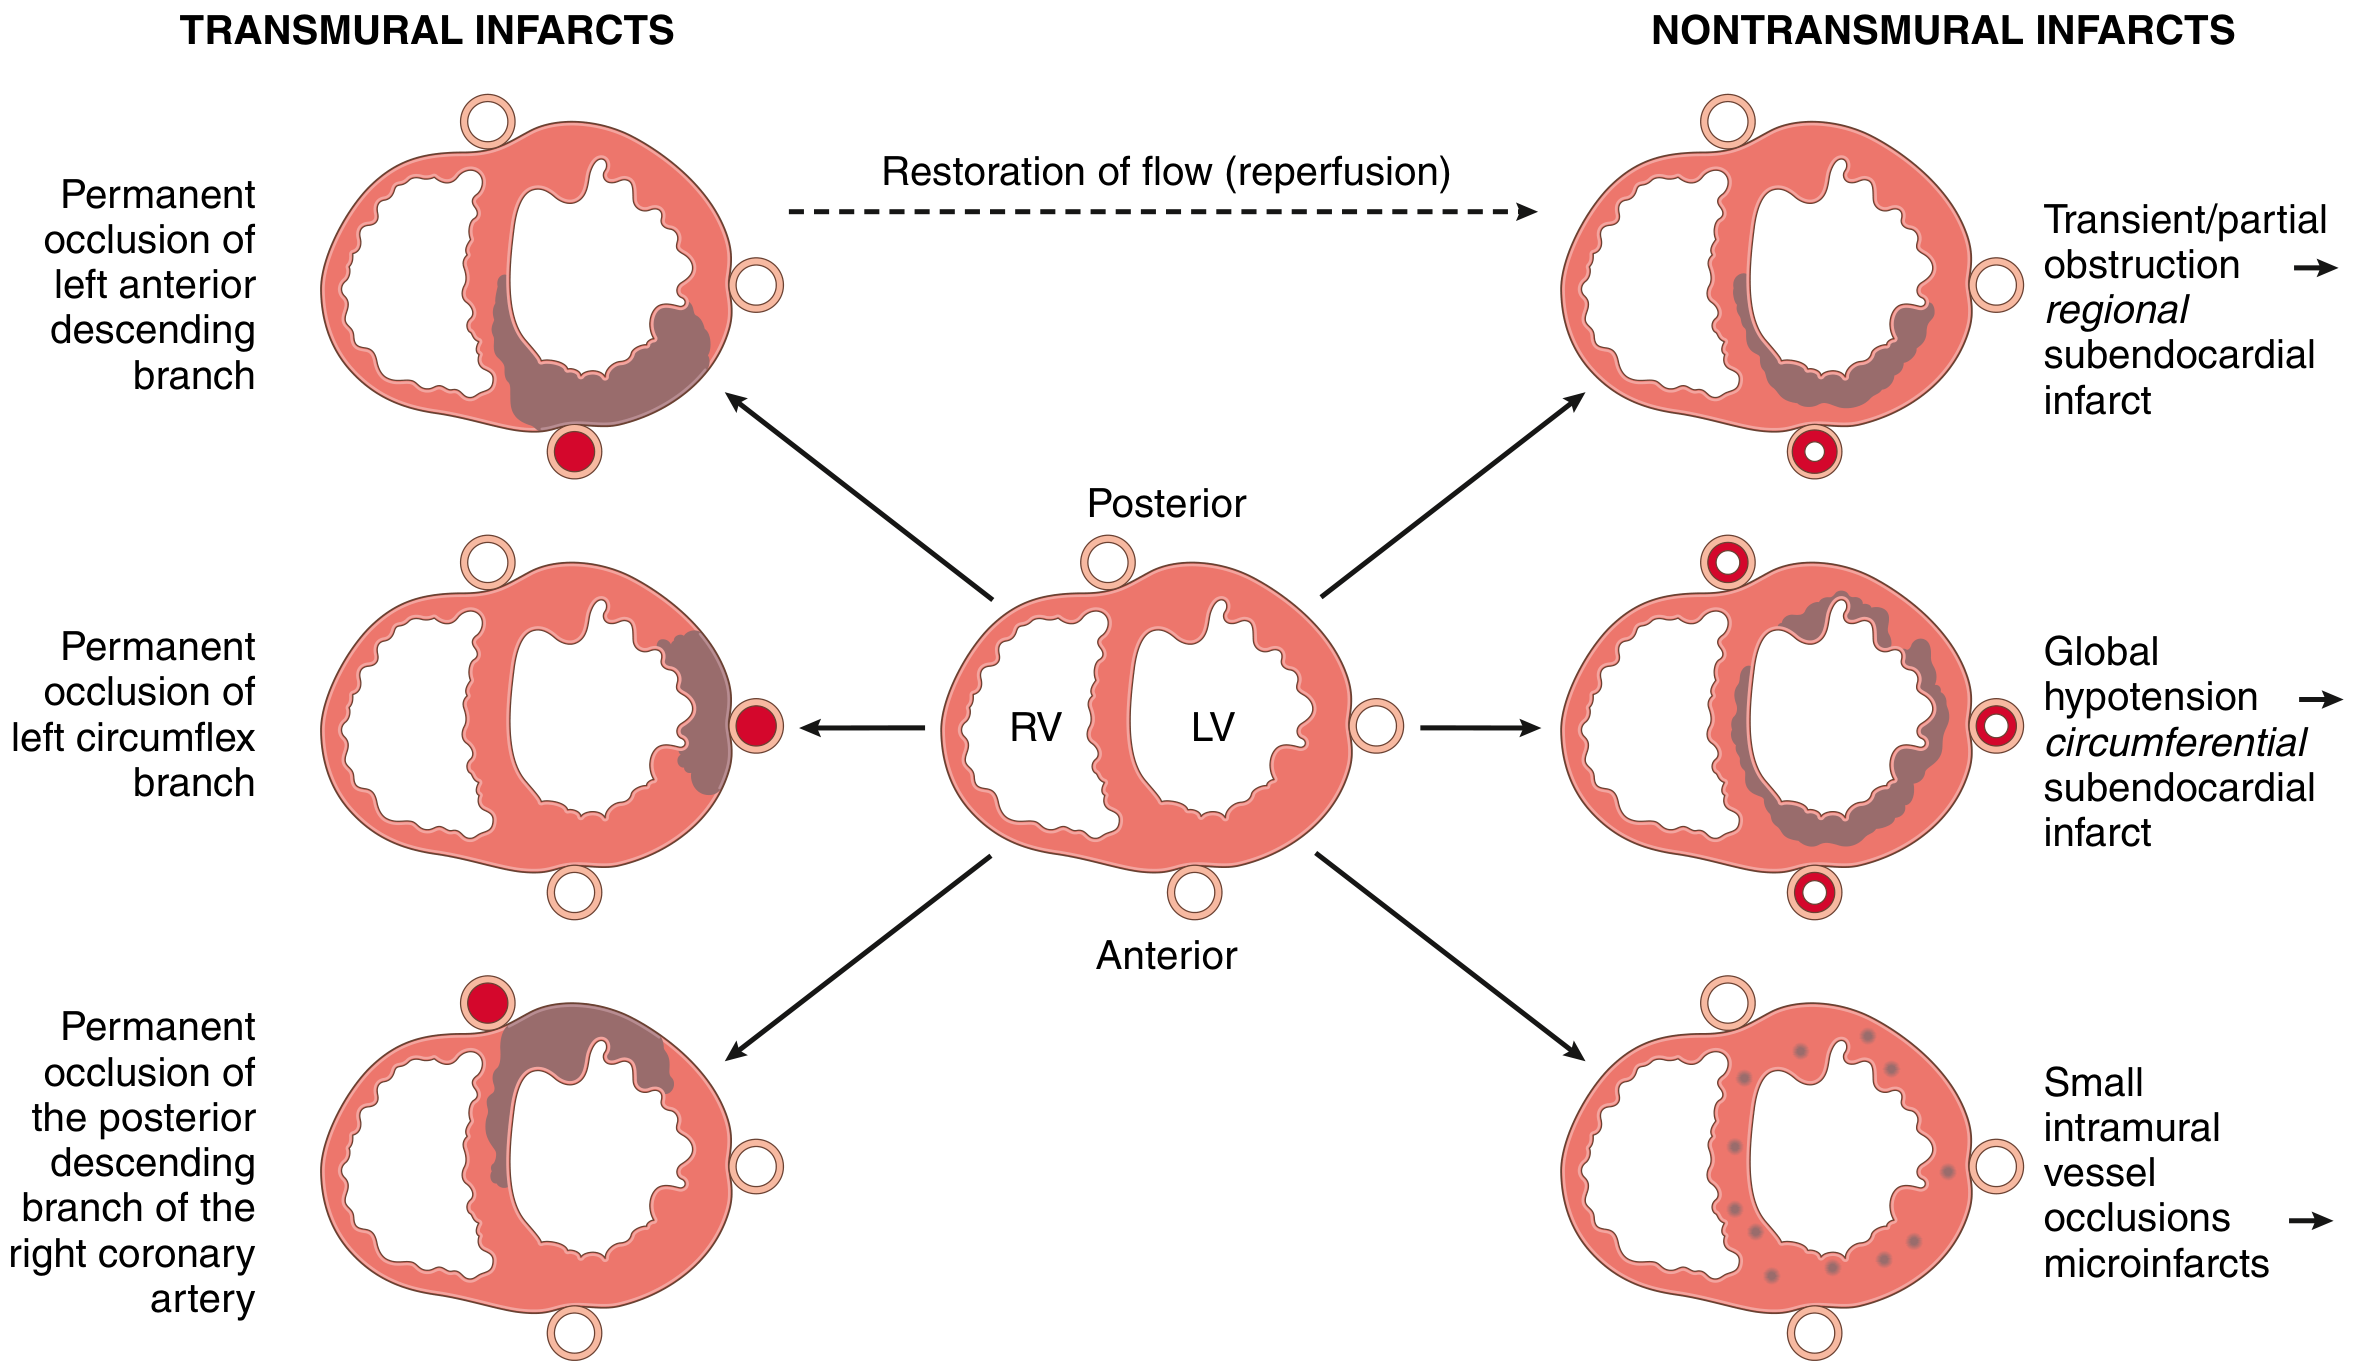
Fig. 9.9 (Robbins & Kumar Basic Pathology) - Left: Transmural infarcts from major coronary occlusion. Right: Nontransmural infarcts from partial occlusion, global hypotension, or small vessel occlusion.
1. Transmural MI
- Definition: Necrosis involves the full thickness of the ventricular wall (>50% of wall thickness)
- Cause: Permanent epicardial vessel occlusion from atherosclerosis + acute thrombosis (Type 1 MI mechanism)
- Nearly all involve at least part of the LV and/or interventricular septum
- 15-30% involving the posterior wall also extend to the RV
- ECG: Typically produces ST elevation (STEMI) and develops pathological Q waves
- Classic pattern: Q-wave MI
2. Subendocardial (Nontransmural) MI
- Definition: Necrosis limited to the inner third of the myocardium (endocardium + intramural myocardium), without reaching the epicardium
- Cause: Plaque disruption followed by thrombus that is lysed before necrosis becomes transmural; or global hypoperfusion (the subendocardium is most vulnerable to hypoxia because it has the highest wall stress and the lowest perfusion pressure)
- Subtypes:
- Regional subendocardial - from partial/transient coronary obstruction
- Circumferential subendocardial - from global hypotension superimposed on fixed 3-vessel disease
- ECG: Usually no ST elevation, no Q waves - but this is not absolute (see below)
3. Microscopic Infarcts (Microinfarcts)
- Occur with small-vessel occlusions - vasculitis, emboli (from valve vegetations or mural thrombi), vasospasm from catecholamines (cocaine, pheochromocytoma)
- May show no diagnostic ECG changes
- (Robbins & Kumar Basic Pathology, p. 355-356)
Part 3: ECG-Based Classification
STEMI (ST-Elevation MI)
- ST-segment elevation in 2+ contiguous leads indicates acute transmural ischemia
- Signifies complete, persistent occlusion requiring emergent reperfusion (PCI or thrombolytics)
- Usually evolves into Q-wave MI if not reperfused
NSTEMI (Non-ST-Elevation MI)
- No ST elevation on presenting ECG
- Biomarkers (troponin) ARE elevated - distinguishes it from unstable angina (UA), which has no biomarker rise
- Usually subendocardial in depth
- May show ST depression, T-wave inversions, or even normal ECG
Q-wave MI vs. Non-Q-wave MI
"Abnormal Q waves were once considered markers of transmural myocardial infarction, whereas subendocardial infarcts were thought not to produce Q waves. However, transmural infarcts may occur without Q waves, and subendocardial (non-transmural) infarcts may be associated with Q waves."(Harrison's Principles of Internal Medicine 22E)
This is why the older "Q-wave = transmural / non-Q-wave = subendocardial" terminology is no longer recommended clinically. Evolving/chronic infarcts are better described simply as "Q-wave" or "non-Q-wave."
Part 4: By Location (Regional Anatomy)
The specific coronary artery occluded determines which wall of the LV is infarcted:
| Territory | Artery Occluded | Wall Affected |
|---|---|---|
| Anterior MI | LAD (left anterior descending) | Anterior wall, apex, anterior septum |
| Lateral MI | LCx (left circumflex) | Lateral wall |
| Inferior MI | RCA (right coronary artery) | Inferior/posterior wall |
| Right ventricular MI | Proximal RCA | RV free wall (complicates inferior MI) |
| Posterior MI | RCA or LCx | True posterior wall |
Part 5: Gross Pathology & Temporal Sequence
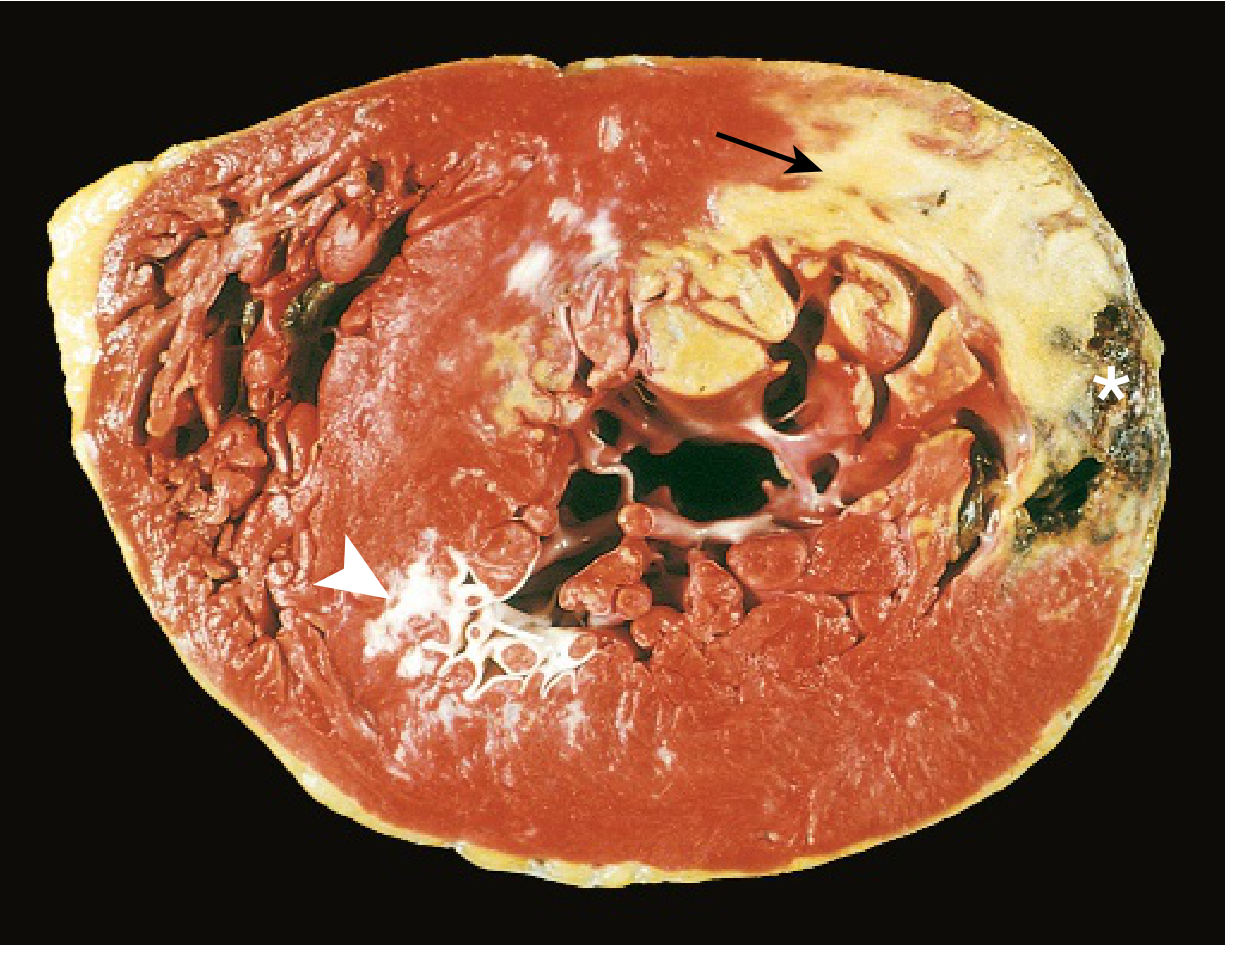
Acute posterolateral MI: The pale/unstained area (arrow) = acute necrosis (TTC staining defect due to enzyme leakage); white area (arrowhead) = old scar from remote infarction; asterisk = myocardial hemorrhage at rupture site. (Robbins & Kumar Basic Pathology, Fig. 9.10)
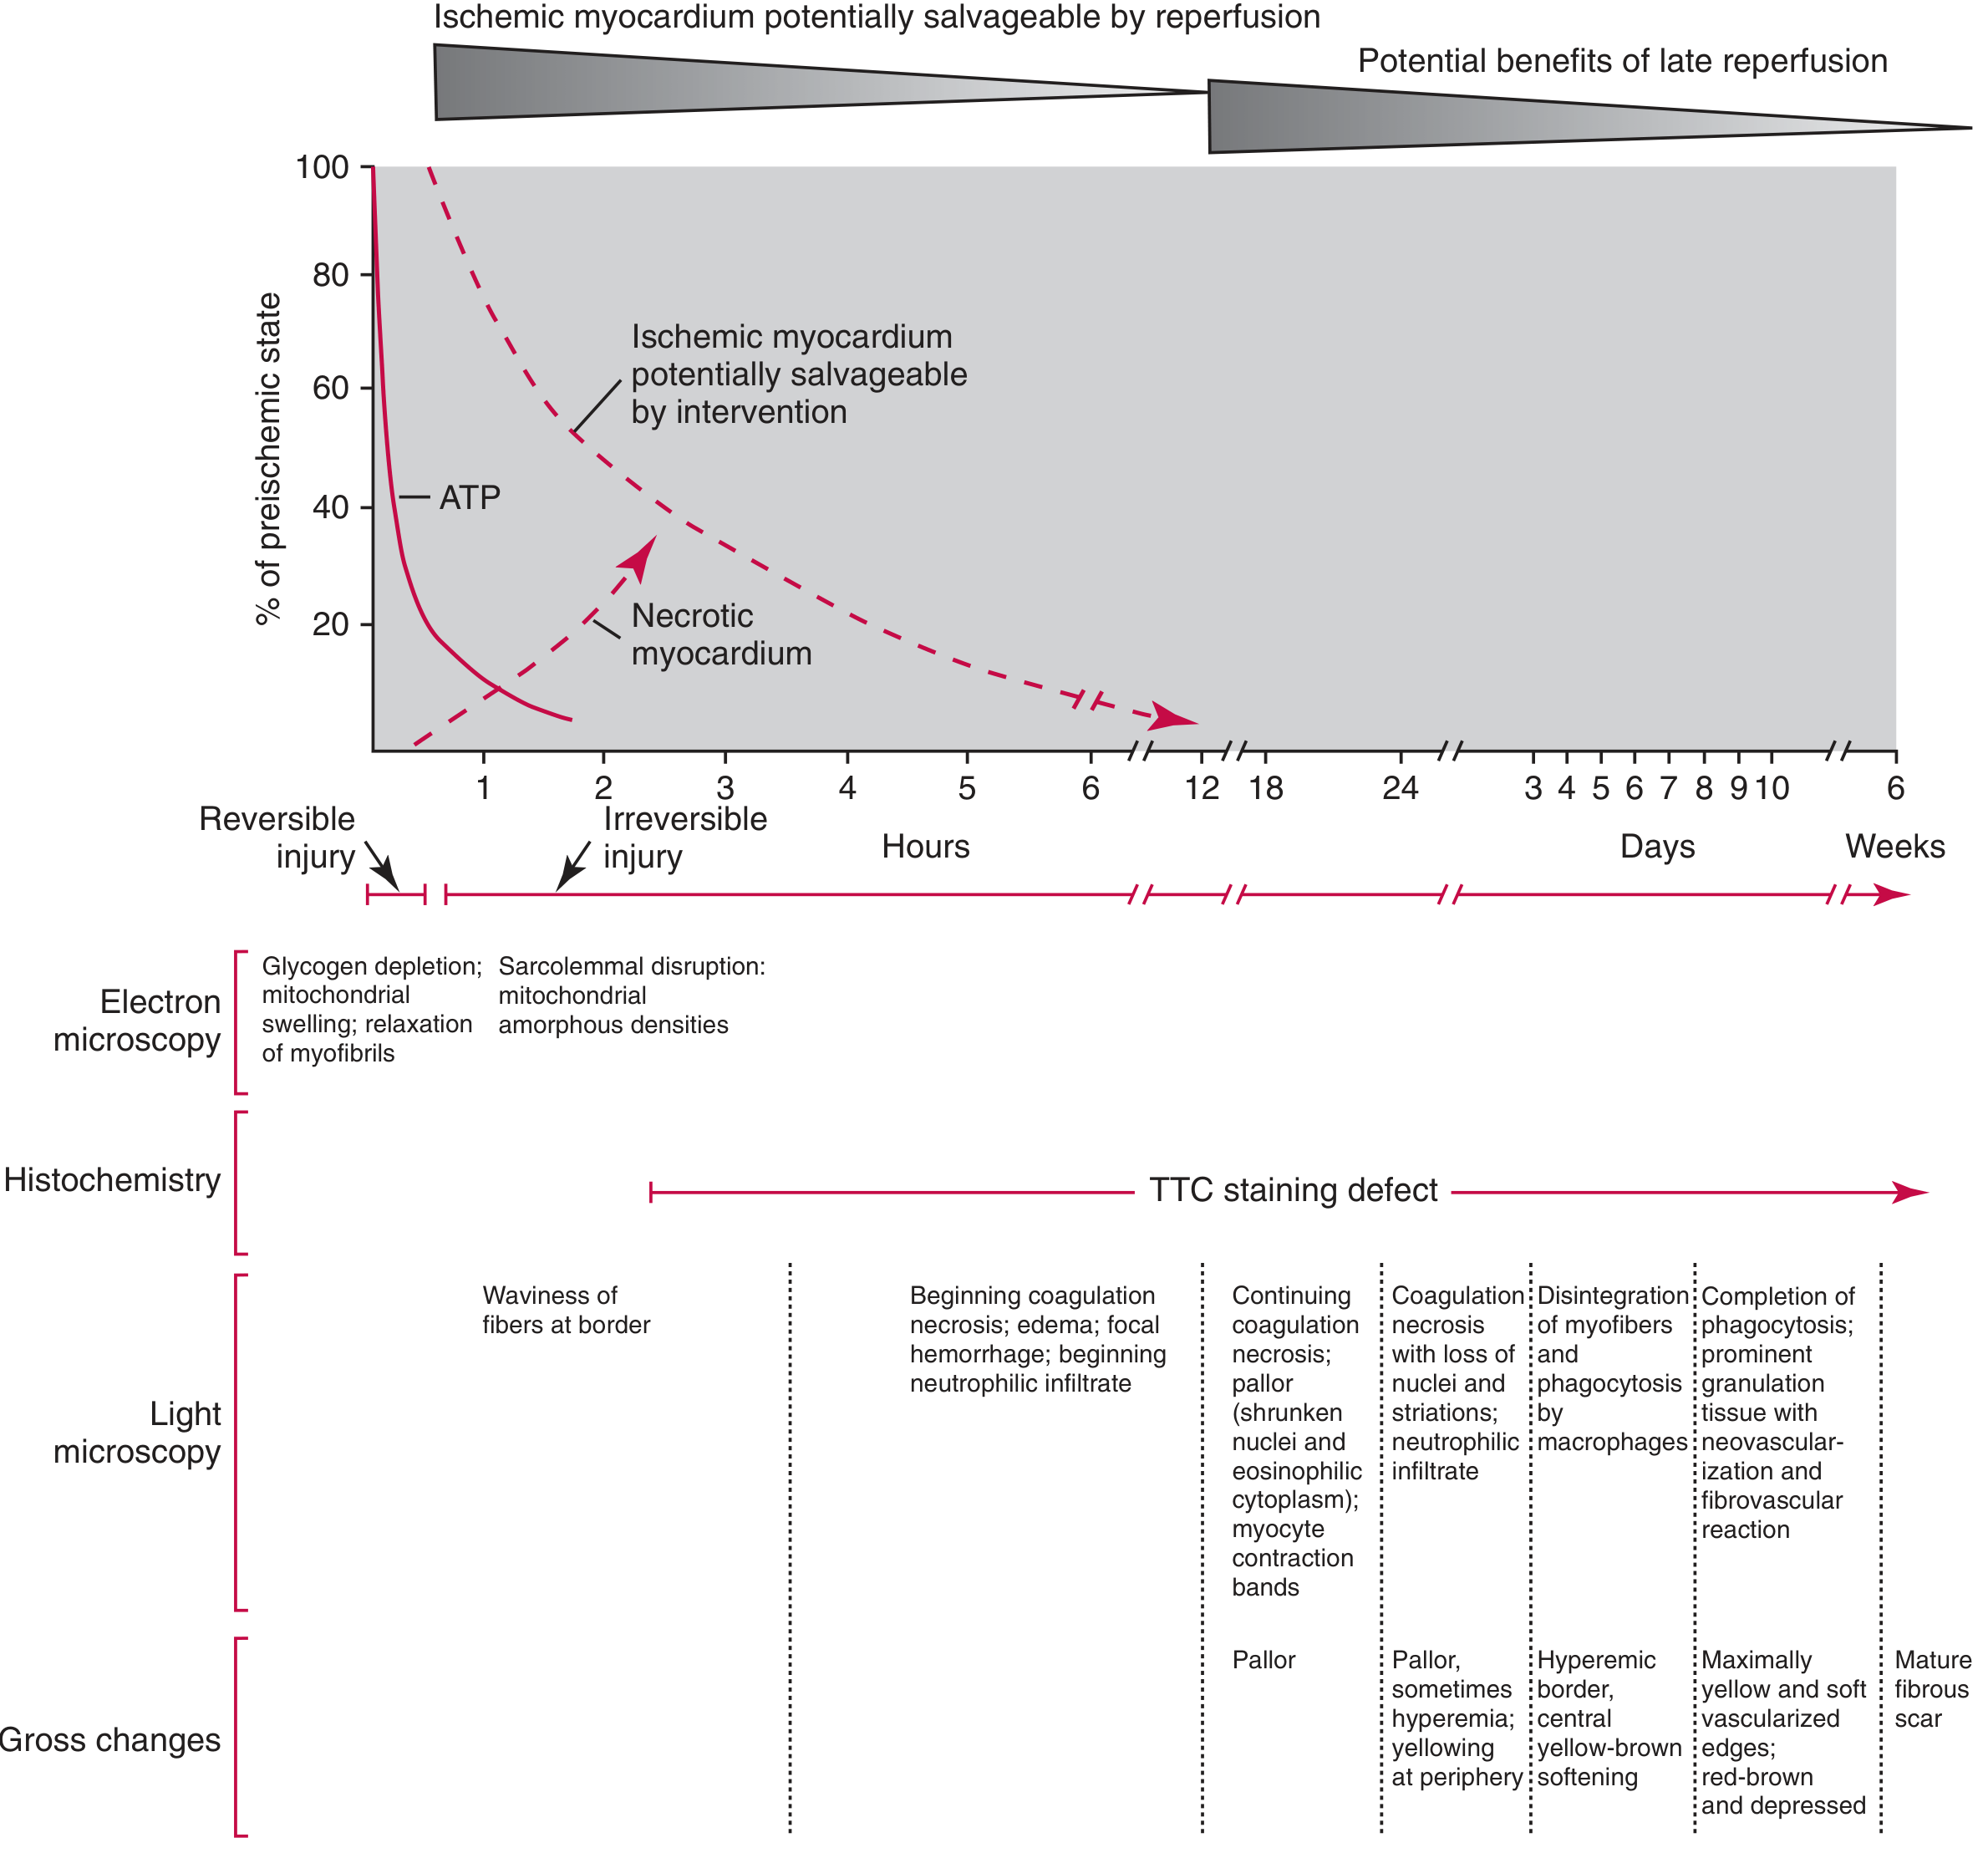
Fig. 48.5 (Tietz Textbook of Laboratory Medicine) - Temporal sequence of MI: ATP depletion begins within 20 min; irreversible injury by ~2 hours; TTC staining defect is detectable from ~3 hours onward; progression through coagulative necrosis, neutrophilic infiltration, macrophage phagocytosis, granulation tissue, and ultimately mature fibrous scar by ~6 weeks.
| Time | Gross Appearance | Light Microscopy | Clinical Significance |
|---|---|---|---|
| 0-4 hrs | None | None to waviness of fibers | Not visible on gross |
| 4-12 hrs | Occasional dark mottling | Coagulation necrosis, edema, hemorrhage | TTC staining can identify |
| 12-24 hrs | Dark mottling | Ongoing necrosis, pyknosis, contraction bands, early neutrophils | |
| 1-3 days | Yellow-tan center | Coagulation necrosis, dense neutrophils | Risk of rupture |
| 3-7 days | Hyperemic border | Macrophage infiltration, phagocytosis | Softening = highest rupture risk |
| 1-3 weeks | Yellow-soft, red-brown depressed edges | Granulation tissue, neovascularization | |
| >6 weeks | White glistening scar | Dense fibrous scar | Completed |
Part 6: Wellens Syndrome (Special ECG Variant)
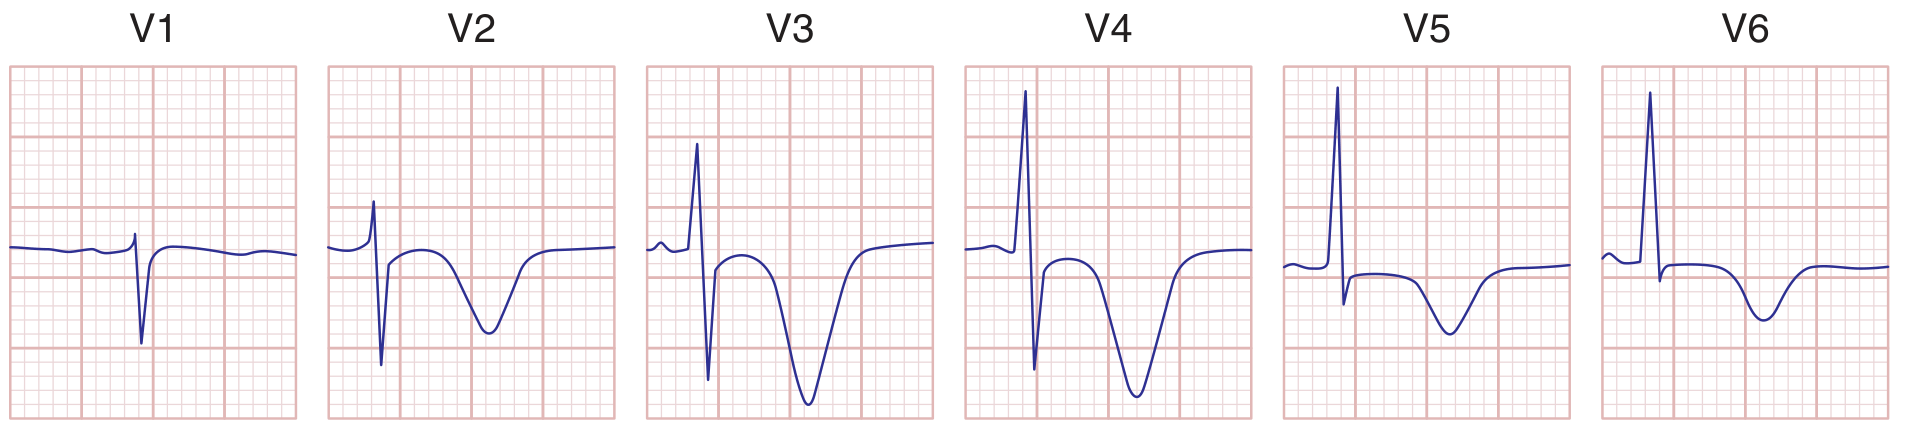
Fig. 247-12 (Harrison's 22E) - Wellens T-wave sign: Deep T-wave inversions in precordial leads (V1-V4) indicate severe ischemia with high-grade LAD stenosis, with or without frank infarction. This represents a threatened anterior MI pattern.
Quick Summary Table
| Classification System | Types |
|---|---|
| Universal Definition (Etiology) | Type 1 (atherothrombotic), Type 2 (supply-demand mismatch), Type 3 (death before biomarkers), Type 4a (PCI-related), Type 4b (stent thrombosis), Type 5 (CABG-related) |
| Depth (Pathological) | Transmural (full-thickness), Subendocardial (inner 1/3), Microscopic (microinfarcts) |
| ECG | STEMI vs. NSTEMI; Q-wave vs. non-Q-wave |
| Location | Anterior, Inferior, Lateral, Posterior, Right ventricular |
Key clinical pearls:
- STEMI ≈ transmural ≈ Q-wave MI (statistically, but not always)
- NSTEMI ≈ subendocardial ≈ non-Q-wave MI (again, not a perfect correlation)
- Type 2 MI is increasingly recognized in hospitalized patients with anemia, sepsis, or tachyarrhythmia - management differs from Type 1 (anticoagulation/PCI may not be appropriate)
- The subendocardium is always the most vulnerable zone because it has the highest wall tension, lowest perfusion pressure, and longest diffusion distance from epicardial vessels
Sources: Robbins & Kumar Basic Pathology; Harrison's Principles of Internal Medicine 22E (2025); Tietz Textbook of Laboratory Medicine, 7th Ed.

Interpreting
analyse_media
Reading File
Finding Sources
I can see the ECG clearly in the image. Let me do a detailed systematic interpretation now.
ECG Interpretation
Patient Details (from printout)
- Patient: Mrjuna Khatun
- Date: 19/06/2026, 17:10-48
- Hospital: Chanchal Sub-Division & S.S. Hospital, Chanchal, Malda (Govt. of West Bengal)
- Machine: ClarityMed ECG-100C
Machine-Measured Parameters
| Parameter | Value | Normal |
|---|---|---|
| Heart Rate | 66 bpm | 60-100 bpm ✓ |
| P (ms) | 78 | <120 ms ✓ |
| PR interval | 136 ms | 120-200 ms ✓ |
| QRS (ms) | 72 | <120 ms ✓ |
| QT | 435 ms | |
| QTc | 449 ms | <440-450 ms (borderline) |
| QT/RR | 48 | |
| Axis - P | 42° | Normal ✓ |
| Axis - QRS | 69° | Normal ✓ |
| Axis - T | 32° | Normal ✓ |
Systematic Interpretation
1. Rate & Rhythm
- Rate: 66 bpm - Normal sinus rate
- Rhythm: Regular rhythm, sinus P waves present (positive in I, II, aVF; negative in aVR)
- Impression: Normal sinus rhythm
2. Axis
- P axis: 42° - Normal
- QRS axis: 69° - Normal (0° to +90°)
- T axis: 32° - Normal
3. Intervals
- PR interval: 136 ms - Normal (no heart block, no pre-excitation)
- QRS duration: 72 ms - Normal (no bundle branch block)
- QTc: 449 ms - Borderline prolonged (upper limit of normal for females is 440-460 ms; this is at the borderline)
4. P Waves
- Normal morphology and axis - no evidence of atrial enlargement
5. QRS Complexes
- QRS duration normal (72 ms) - no BBB
- Normal QRS axis (69°)
- Looking at the precordial leads: there appears to be poor R-wave progression in V1-V3, with small R waves in early precordial leads
6. ST Segments & T Waves
Examining the tracing carefully:
Limb leads:
- Leads I, II, III, aVF, aVL: ST segments appear isoelectric (no clear elevation or depression)
- T waves appear upright in I, II, aVF
Precordial leads (V1-V6):
- V1-V4: There appear to be T-wave changes - the T waves in V1-V3 appear flattened or inverted, which is a notable finding
- V5-V6: T waves appear relatively upright
7. Q Waves
- No pathological Q waves (>25% of R wave height or >40 ms wide) are clearly visible in this tracing
Key Findings & Impression
| Finding | Detail |
|---|---|
| Rhythm | Normal Sinus Rhythm |
| Rate | 66 bpm - Normal |
| Axis | Normal (QRS 69°) |
| Conduction | Normal - no BBB, no AV block |
| QTc | 449 ms - Borderline prolonged |
| ST segments | No obvious ST elevation or depression |
| T waves | Flattened/inverted T waves in V1-V3 - notable finding |
| Q waves | No pathological Q waves seen |
Clinical Interpretation
This ECG is largely within normal limits with two points of note:
-
Borderline QTc prolongation (449 ms): This is at the upper limit of normal for a female patient. Causes to consider include electrolyte imbalance (hypokalemia, hypomagnesemia), medications, and rarely congenital long QT syndrome. It warrants checking electrolytes.
-
T-wave flattening in anterior leads (V1-V3): This is a non-specific finding but can indicate:
- Non-specific T-wave changes (most common, benign)
- Early or resolving anterior ischemia
- Right ventricular strain
- Electrolyte disturbance
There is NO evidence of:
- Acute STEMI (no ST elevation)
- Acute NSTEMI pattern (no ST depression)
- Pathological Q waves (no completed MI pattern)
- Bundle branch block
- Complete AV block
Recommendation
This ECG does not show acute MI. However, given the anterior T-wave changes and borderline QTc:
- Correlate with the patient's symptoms (chest pain, dyspnea, palpitations?)
- Check serum electrolytes (K⁺, Mg²⁺, Ca²⁺)
- Check medications (any QT-prolonging drugs?)
- If symptomatic, serial ECGs and troponin are warranted to rule out NSTEMI
⚠️ This is an AI-assisted interpretation for educational purposes. Final clinical decisions must be made by the treating physician with full clinical context.
This is a shared conversation. Sign in to Orris to start your own chat.