
Explain Sacromere model mechanism
- A sarcomere spans from Z-disc to Z-disc and contains overlapping thick (myosin) and thin (actin) filaments.
- Contraction follows the sliding filament theory: myosin heads bind actin, undergo a power stroke, and pull thin filaments toward the center, shortening the sarcomere without the filaments themselves changing length.
- This cycle is driven by ATP hydrolysis and regulated by calcium binding to troponin, which moves tropomyosin to expose actin binding sites.
sarcomere structure sliding filament mechanism diagram
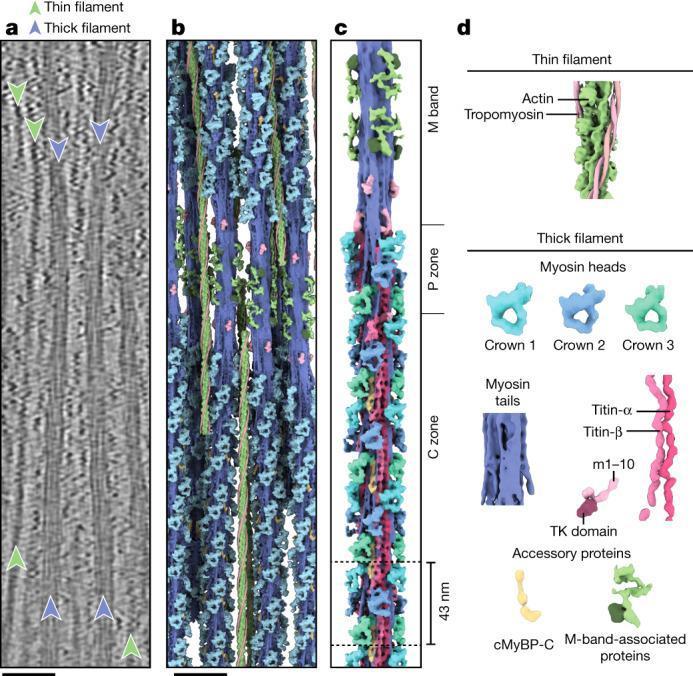
This educational medical illustration demonstrates the high-resolution structure of a relaxed cardiac sarcomere thick filament, utilizing data from cryo-electron tomography (cryo-ET). The image is divided into four panels: (a) A grayscale tomographic slice showing the parallel longitudinal arrangement of thick and thin filaments; (b) A 3D reconstructed tomogram mapping the filaments in situ; (c) A detailed structural model of a single thick filament spanning from the M band, through the P zone, to the C zone, highlighting the 43 nm helical repeat; (d) A color-coded legend of the sarcomere's molecular components. Key proteins identified include actin and tropomyosin (thin filament), myosin heads (organized into Crowns 1, 2, and 3), myosin tails, titin-α, titin-β, the titin kinase (TK) domain, cMyBP-C, and various M-band-associated proteins. This content is vital for understanding muscle physiology and the molecular basis of cardiomyopathies, providing a structural framework for how these proteins interact to regulate cardiac contraction.
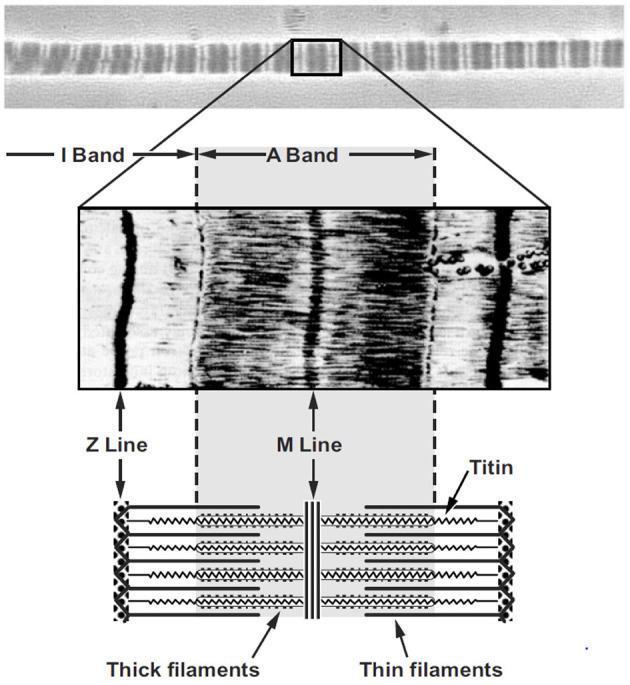
This composite educational graphic illustrates the microanatomy of skeletal muscle fibers across three levels of magnification. The top panel features a high-resolution micrograph of a single myofibril, displaying characteristic dark A-bands and light I-bands in a repeating transverse striation pattern. The middle panel provides a magnified view of a single sarcomere unit, identifying key vertical landmarks: the Z-line (defining sarcomere boundaries), the central M-line, and the horizontal alignment of contractile proteins. The bottom panel is a labeled schematic diagram correlating the visual findings with molecular structures. It depicts the thick filaments (myosin) at the center anchored by the M-line, and thin filaments (actin) extending from the Z-lines. The spring-like protein titin is shown tethering the thick filaments to the Z-line. This multi-modal representation serves to teach the relationship between visible light/electron microscopy patterns and the underlying sliding filament theory of muscle contraction, relevant to physiology and histology.
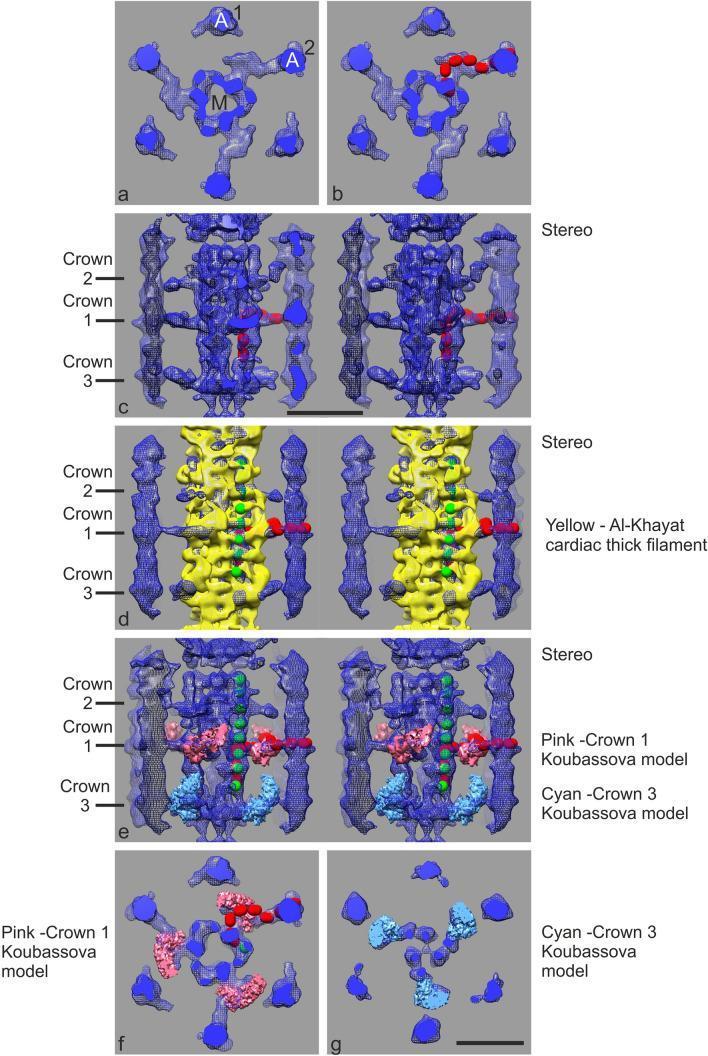
A multi-panel scientific visualization showing subtomogram averages and molecular docking models of the cardiac muscle sarcomere's C-zone, specifically focusing on the interactions between myosin thick filaments and actin thin filaments. Panel (a) provides a cross-sectional view of a central myosin filament (M) surrounded by six actin filaments (A1, A2), illustrating the threefold symmetry of the thick filament backbone. Panels (b-g) integrate structural models to characterize MyBP-C (myosin-binding protein C) and myosin head arrangements. Longitudinal stereo views (c-e) demonstrate the axial distribution of myosin crossbridge 'crowns' (Crowns 1, 2, and 3) along the 430 Å repeat, with Crown 1 coinciding with the MyBP-C stripe. The models incorporate Ig-domain spheres (red) to trace the path of MyBP-C from the myosin backbone to actin, alongside docked crystal structures of cardiac thick filaments (yellow) and myosin motor domains (pink/cyan). This diagram serves as a high-resolution anatomical and physiological illustration for understanding cardiac muscle contraction at the molecular level, highlighting the spatial relationship between titin, MyBP-C, and the actomyosin complex.
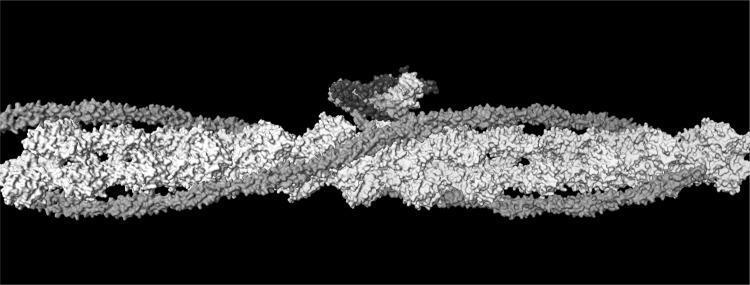
This molecular model illustrates the structural organization of a muscle thin filament, a key component of the sarcomere's contractile apparatus. The image depicts a double-stranded helix of F-actin (white), characterized by repeating globular G-actin subunits. Wound along the longitudinal grooves of the actin filament are two strands of tropomyosin (grey/red). At regular intervals, the regulatory troponin complex is visible as a multi-subunit globular mass bound to the actin-tropomyosin assembly. According to the structural data by Pirani et al. (2006), the troponin complex is subdivided into three specific subunits: Troponin C (TnC), Troponin I (TnI), and Troponin T (TnT), which are represented here by varying shades of grey/color. The left side of the model represents the barbed end (Z-band end) of the actin filament. This illustration is essential for understanding the steric blocking mechanism of muscle contraction, where Ca2+ binding to troponin triggers a conformational shift in tropomyosin to expose myosin-binding sites on actin.
The Sarcomere: Structure and Mechanism of Contraction
1. Hierarchy of Muscle Organization
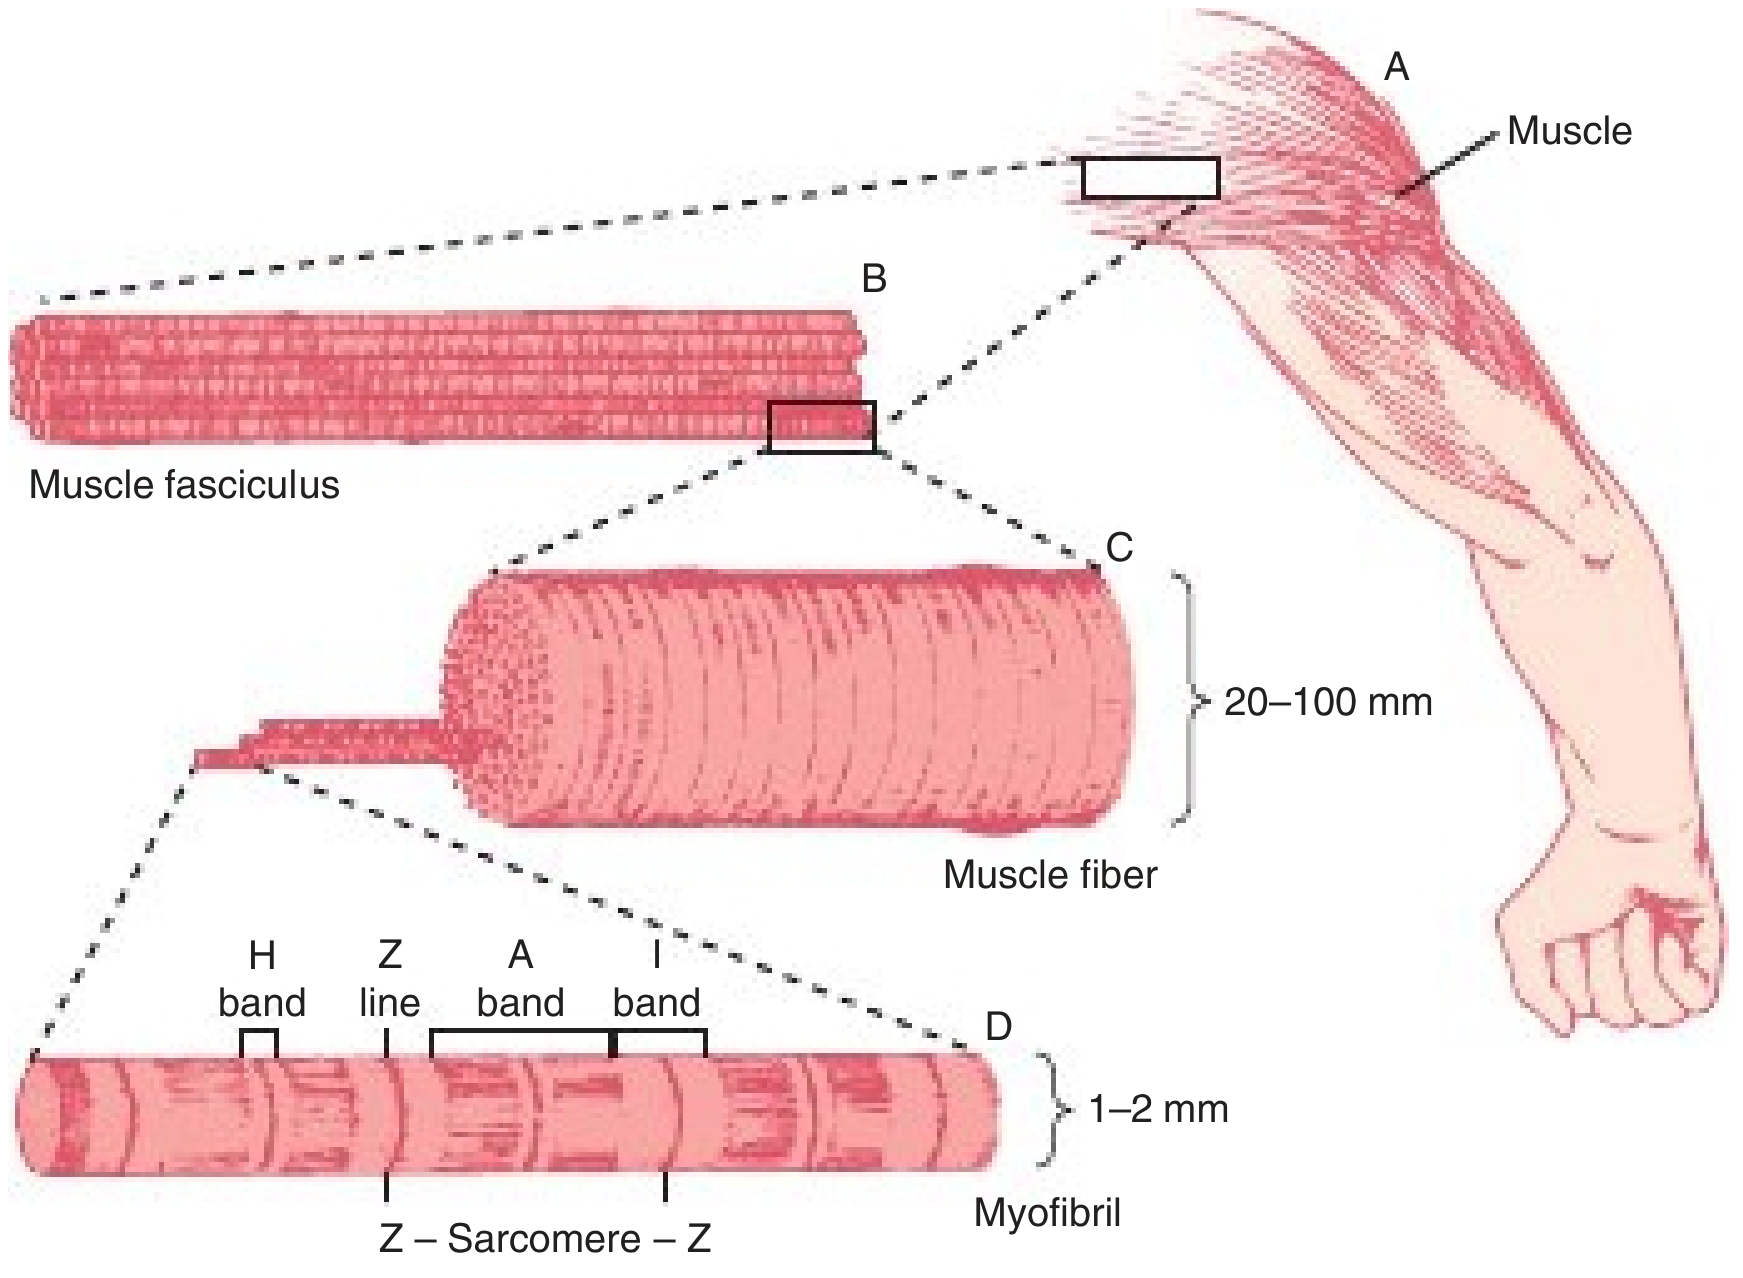
2. Structure of the Sarcomere
Banding Pattern
| Band/Zone | Contents | Appearance |
|---|---|---|
| A band | Thick + thin filaments (overlap zone) | Dark |
| I band | Thin filaments only | Light |
| H band | Thick filaments only (center of A band) | Less dense |
| M line | Center of sarcomere; anchors thick filaments | Dense line |
| Z disc | Anchors thin filaments; sarcomere boundary | Dense line |
Thick Filament (Myosin)
Thin Filament (Actin + Regulatory Proteins)
- F-actin: Two helical strands of fibrous actin, each with ~200 G-actin monomers
- Tropomyosin: Two coiled strands lying in the groove of the F-actin helix
- Troponin complex: A regulatory complex attached to tropomyosin at regular intervals, composed of:
- Troponin C (TnC) - Ca²⁺ binding subunit
- Troponin I (TnI) - inhibitory subunit
- Troponin T (TnT) - tropomyosin-binding subunit
3. Accessory (Structural) Proteins
| Protein | Size | Function |
|---|---|---|
| Titin | 2,500 kDa | Spans half the sarcomere from Z line to M line; two spring-like regions center the thick filament and prevent excessive stretching |
| α-Actinin | 190 kDa | Bundles thin filaments into parallel arrays and anchors them at the Z line |
| Desmin | 53 kDa | Intermediate filament forming a lattice at Z lines; cross-links neighboring myofibrils |
| Myomesin / M-protein | 185/165 kDa | Holds thick filaments in register at the M line |
| MyBP-C | 140-150 kDa | Stabilizes thick filaments; interacts with titin |
| Dystrophin | 427 kDa | Links extracellular laminin to intracellular actin filaments via the sarcolemma |
- Histology: A Text and Atlas, p. 812
4. The Sliding Filament Model
When a muscle contracts, the sarcomere shortens but the individual myofilaments do NOT change length.
- I band shortens (thin filaments slide inward)
- H band narrows (thin filaments encroach into the H zone)
- A band remains constant (thick filament length unchanged)
- Z discs move closer together
5. Excitation-Contraction Coupling
- Motor nerve fires → action potential at the neuromuscular junction
- Action potential propagates along sarcolemma and down T-tubules (transverse tubules)
- Dihydropyridine receptors (DHPRs) on T-tubules sense the voltage change and mechanically activate ryanodine receptors (RyR1) on the sarcoplasmic reticulum (SR)
- Ca²⁺ floods the sarcoplasm: resting [Ca²⁺] < 10⁻⁷ M rises to 10⁻⁷ - 10⁻⁶ M
- Ca²⁺ binds Troponin C - up to 4 Ca²⁺ per TnC molecule; binding is cooperative (each Ca²⁺ increases affinity for the next)
- Conformational change in troponin → tropomyosin shifts out of the actin groove → myosin-binding sites on actin are exposed
- Costanzo Physiology, 7th Ed., p. 44-45
6. The Actomyosin Cross-Bridge Cycle
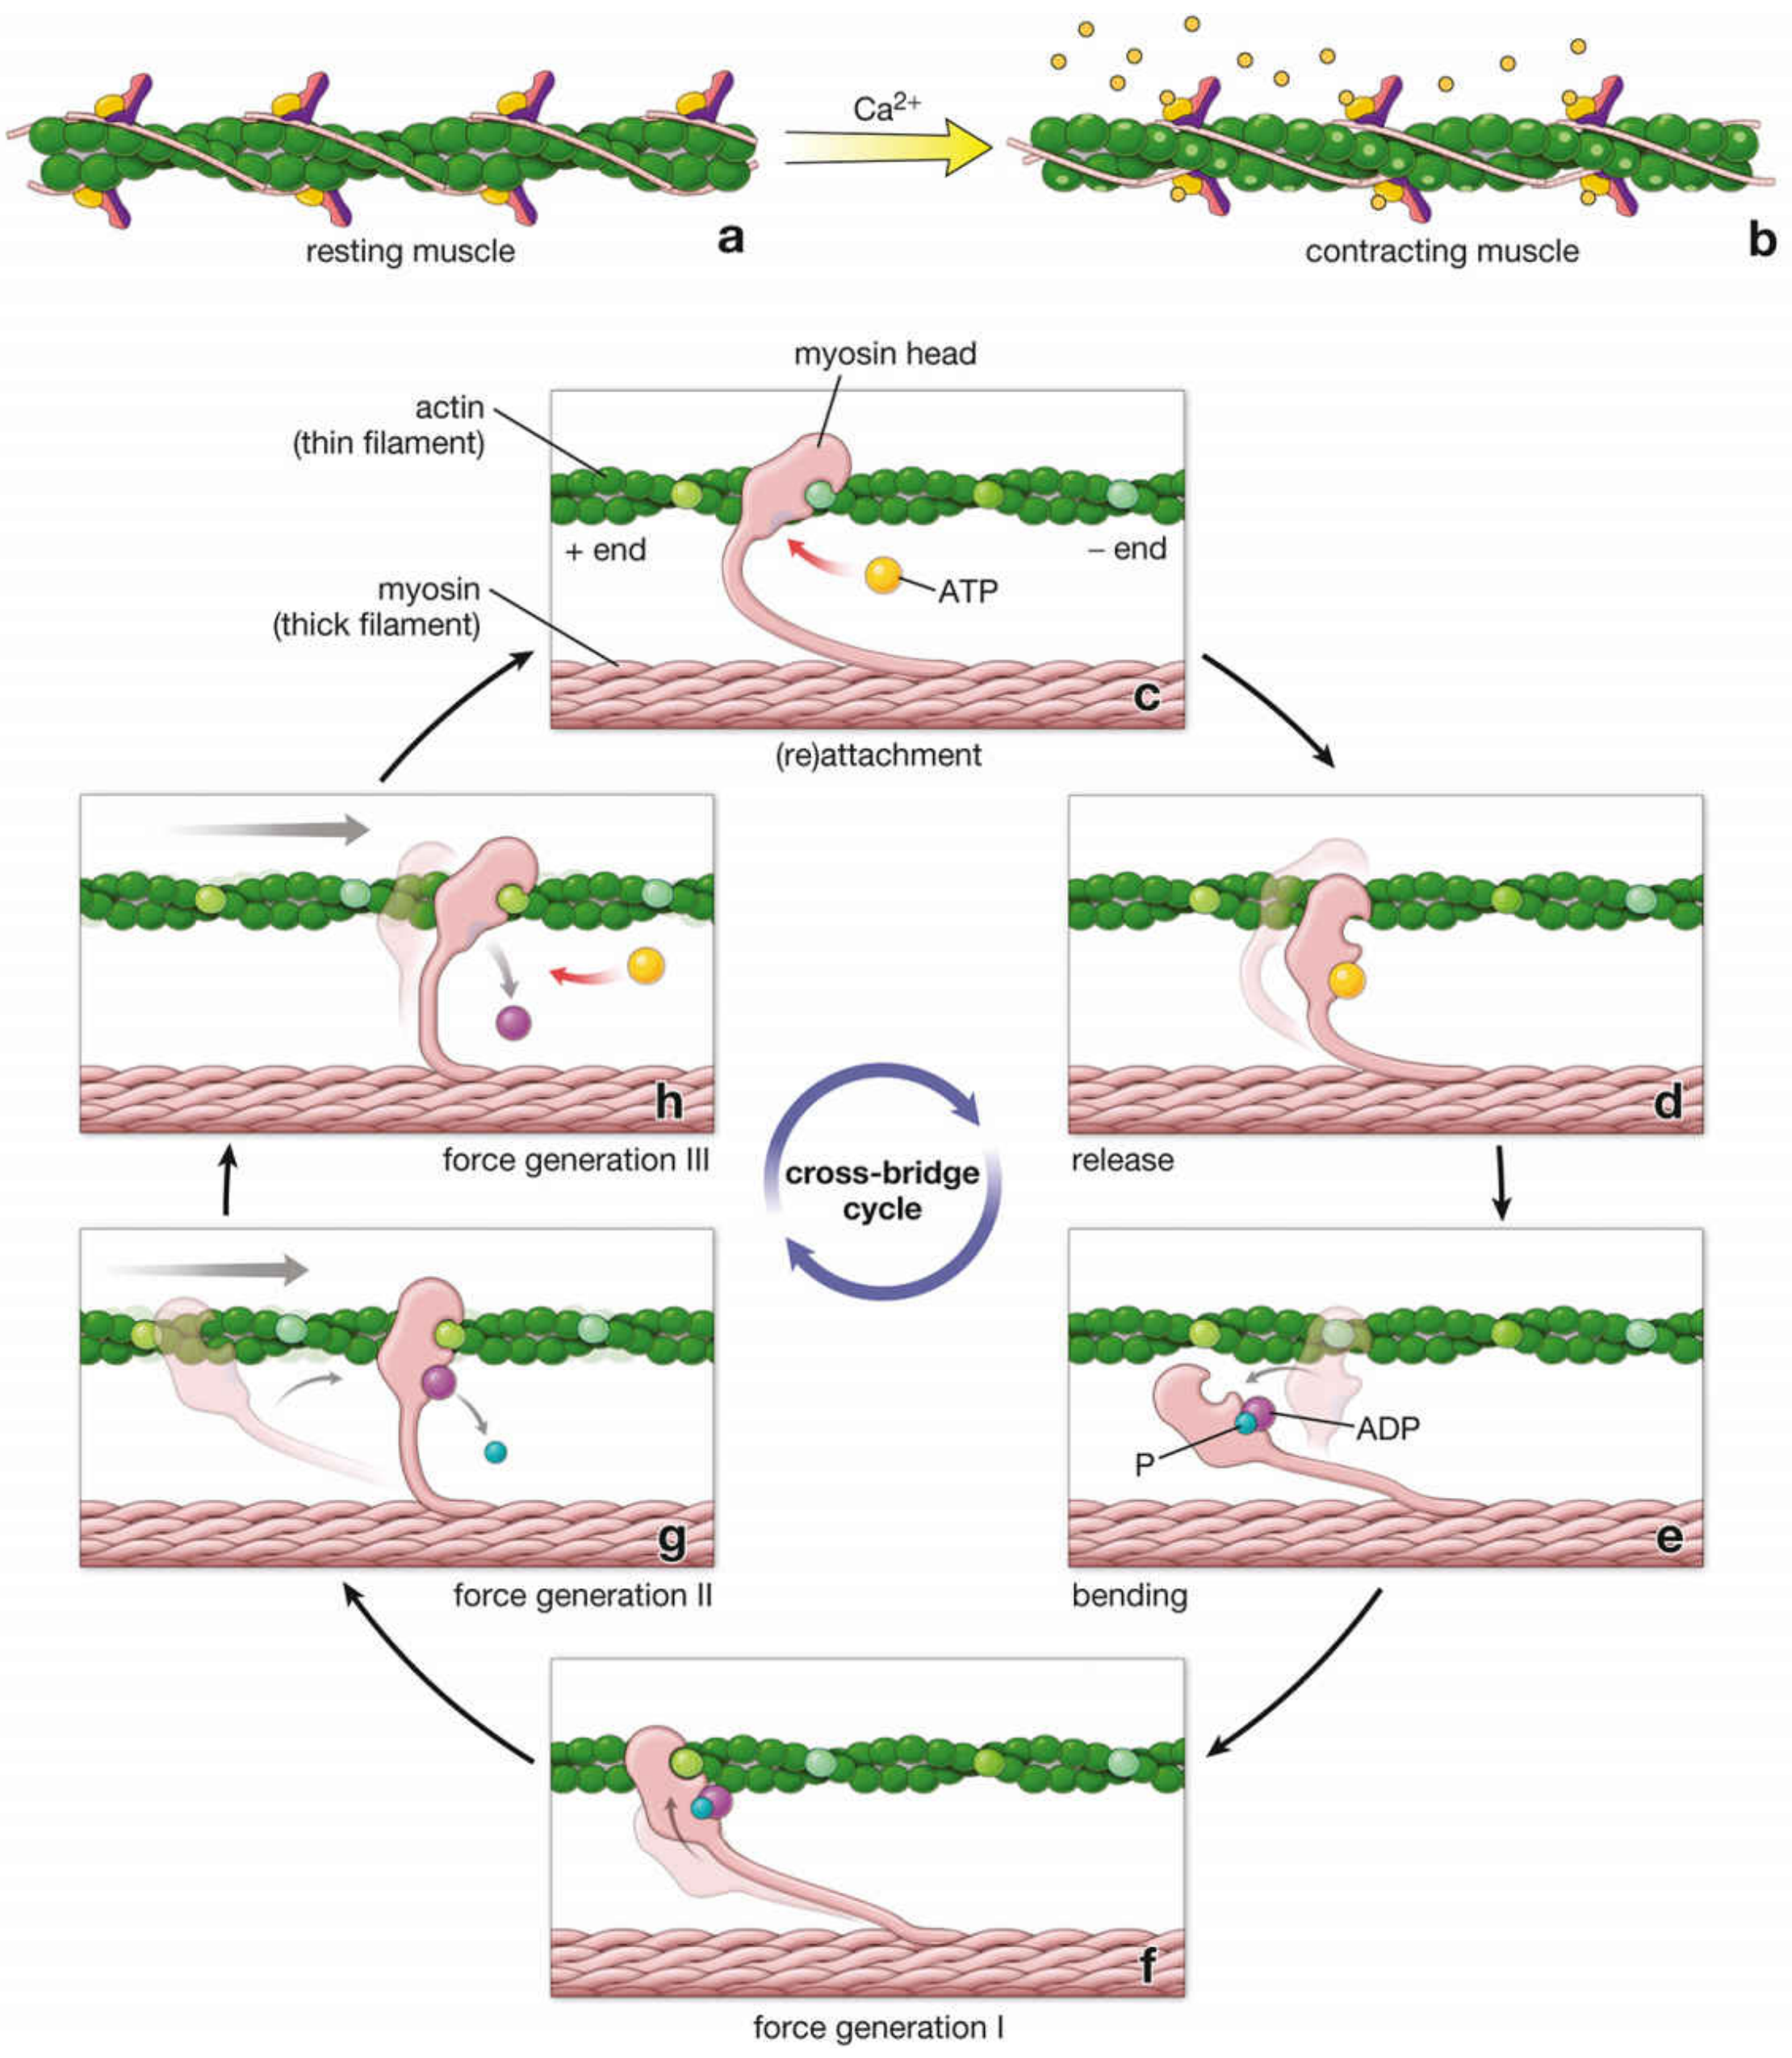
Step-by-Step Cycle
Each cross-bridge cycle "walks" the myosin head 10 nm along the filament. Hundreds of myosin heads cycle near-simultaneously, producing the gross shortening we see as muscle contraction. - Costanzo Physiology, p. 45
7. Relaxation
- SR Ca²⁺-ATPase (SERCA) actively pumps Ca²⁺ back into the SR (ATP-dependent)
- Cytosolic [Ca²⁺] falls below 10⁻⁷ M
- Ca²⁺ dissociates from Troponin C
- Tropomyosin returns to the blocking position over actin
- Cross-bridge cycling stops → muscle relaxes
8. Key Relationships - Summary Table
| Parameter | Resting | Contracted |
|---|---|---|
| Sarcomere length | ~2.2-2.3 µm | ~1.5 µm |
| I band | Wide | Narrow |
| H band | Wide | Narrow/absent |
| A band | Unchanged | Unchanged |
| Z disc spacing | Wide | Narrow |
| [Ca²⁺] cytosol | < 10⁻⁷ M | 10⁻⁷ - 10⁻⁶ M |
- Harper's Illustrated Biochemistry, 32nd Ed. - pp. 631-633
- Histology: A Text and Atlas, 9th Ed. - pp. 812-818
- Costanzo Physiology, 7th Ed. - pp. 44-46
- Principles of Neural Science, 6th Ed. (Kandel) - pp. 793-796
Explain in physiology
sarcomere length tension relationship muscle physiology graph
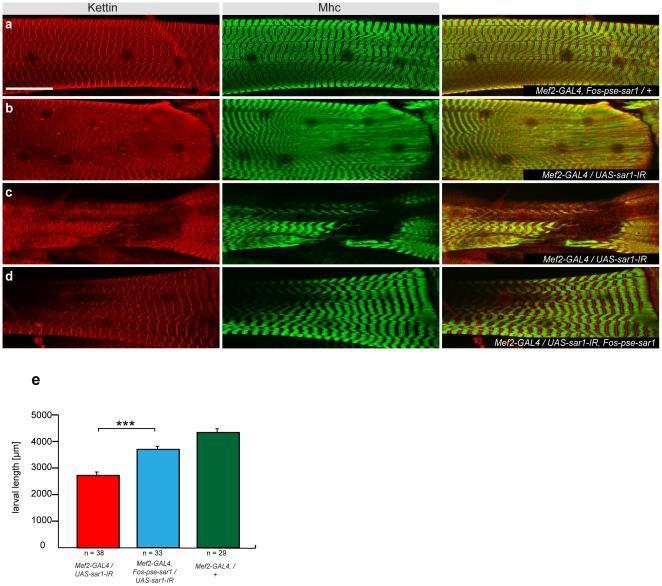
This composite educational image illustrates phenotypic rescue of sarcomere organization in a larval muscle model. Panels (a-d) present immunofluorescence microscopy images of muscle fibers. Sarcomeric structures are visualized using anti-Kettin (red) for Z-lines and anti-Mhc (green) for M-lines. Panel (a) shows the wild-type control with highly organized, repetitive banding patterns. Panels (b) and (c) demonstrate the sar1 knock-down phenotype (Mef2-GAL4/UAS-sar1-IR), characterized by a 'fading-Z' appearance, loss of distinct striations, and disrupted sarcomere integrity. Panel (d) shows the results of genetic rescue using the FlyFos-pse-sar1 transgene, which restores the regular, striated banding pattern resembling the wild type. A scale bar representing 50 µm is included. Panel (e) is a bar graph quantifying larval length (µm) across three groups: sar1 knock-down (red), rescued (blue), and wild type (green). The graph confirms that sar1 depletion significantly impairs growth (approx. 2700 µm), while the rescue transgene significantly improves larval length (approx. 3800 µm), supported by a statistical significance of p<0.0001 (***).
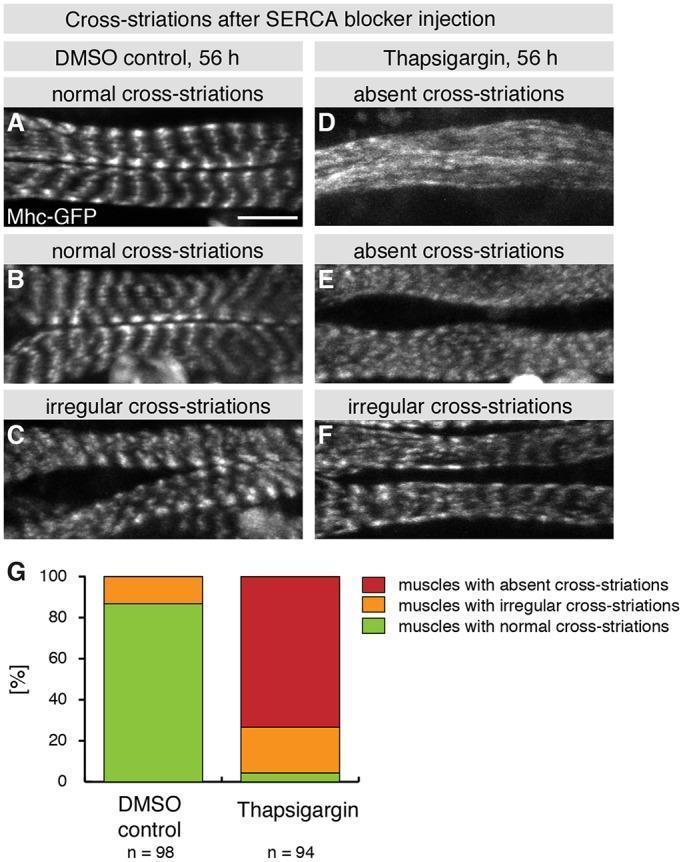
This composite educational graphic details the role of muscle contractions in myofibril sarcomerogenesis using a Drosophila model. The visual combines fluorescence microscopy and quantitative data analysis. Panels A-F show Mhc-GFP (Myosin Heavy Chain-Green Fluorescent Protein) expression in muscles 56 hours after puparium formation (APF). Panels A-C represent the DMSO control group, showing highly organized, periodic banding patterns typical of 'normal cross-striations' and some 'irregular cross-striations.' Panels D-F show muscles injected with Thapsigargin (a SERCA inhibitor), demonstrating a marked disruption of sarcomere assembly, labeled as 'absent cross-striations' or 'irregular cross-striations' characterized by a loss of distinct lateral alignment and periodicity. Panel G is a stacked bar graph quantifying these phenotypes: the control group (n=98) exhibits approximately 87% normal striations, while the Thapsigargin group (n=94) shows roughly 73% absent striations. The figure demonstrates the clinical and biological importance of calcium-induced mechanical tension and contractions in the maturation of striated muscle architecture.
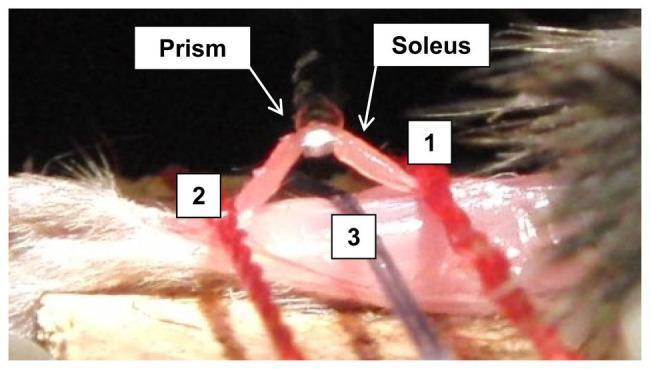
This clinical specimen photograph demonstrates an experimental setup for in vivo biomechanical testing and sarcomere imaging of a mouse soleus muscle. The image features a thin, reddish, elongated isolated soleus muscle bundle positioned over a 0.5-mm optical prism. The prism, integrated with a force microscope system, acts as a central support and light source interface to visualize muscle microstructure. The muscle bundle is anchored by red surgical sutures at three strategic locations to maintain tension and stability: labels '1' and '2' indicate sutures flanking the prism that secure the muscle bundle, while label '3' denotes a suture at the midpoint anchoring the limb to the testing platform. This setup is designed to quantify sarcomere length and passive muscle tension during lifting steps, facilitating the study of musculoskeletal changes post-stroke. The visual emphasizes the relationship between the anatomical structure (soleus), the diagnostic tool (prism), and the stabilizing elements (sutures) required for high-precision physiological measurement.
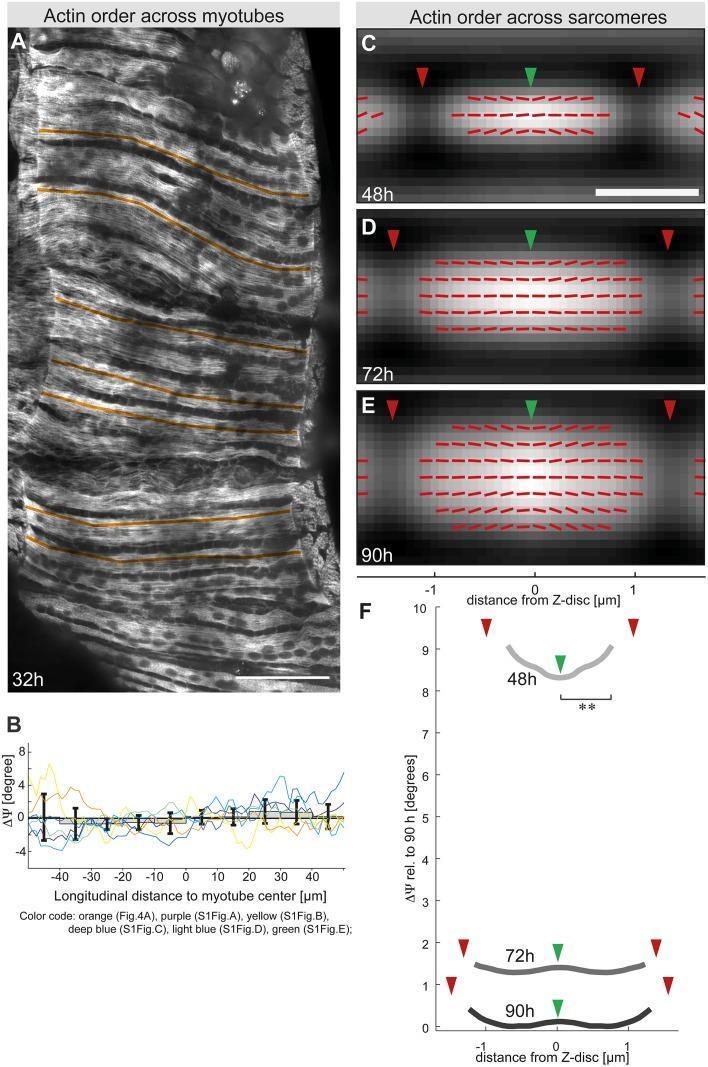
This figure presents a study of myofibrillogenesis and sarcomere maturation using polarization-resolved fluorescence microscopy. Panel A shows a clinical-style micrograph of flight muscle at 32 hours After Puparium Formation (APF) stained for actin (rhodamine-Alexa488), illustrating the transition from a loose actin meshwork to immature myofibrils. Overlaid orange lines indicate scanning paths for measuring molecular order. Panel B provides the corresponding longitudinal profile of molecular actin order across the myotube. Panels C, D, and E are grey maps showing the actin intensity of averaged sarcomeres at 48h, 72h, and 90h APF. These panels use green arrowheads to mark Z-discs and red arrowheads for M-lines, with overlaid red sticks representing the local actin orientation angle (ρ), amplified for visibility. Panel F summarizes these findings in a graph showing molecular actin order profiles along the sarcomere length at different developmental stages, highlighting the progressive increase in structural organization and molecular order at the Z-disc and M-line as the sarcomere matures.
Sarcomere Model - Physiological Explanation
1. Resting Membrane Potential of Skeletal Muscle
- High intracellular K⁺ (~155 mmol/L) vs. low extracellular K⁺ (~4 mmol/L)
- Low intracellular Na⁺ (~12 mmol/L) vs. high extracellular Na⁺ (~145 mmol/L)
2. Excitation-Contraction Coupling (E-C Coupling)
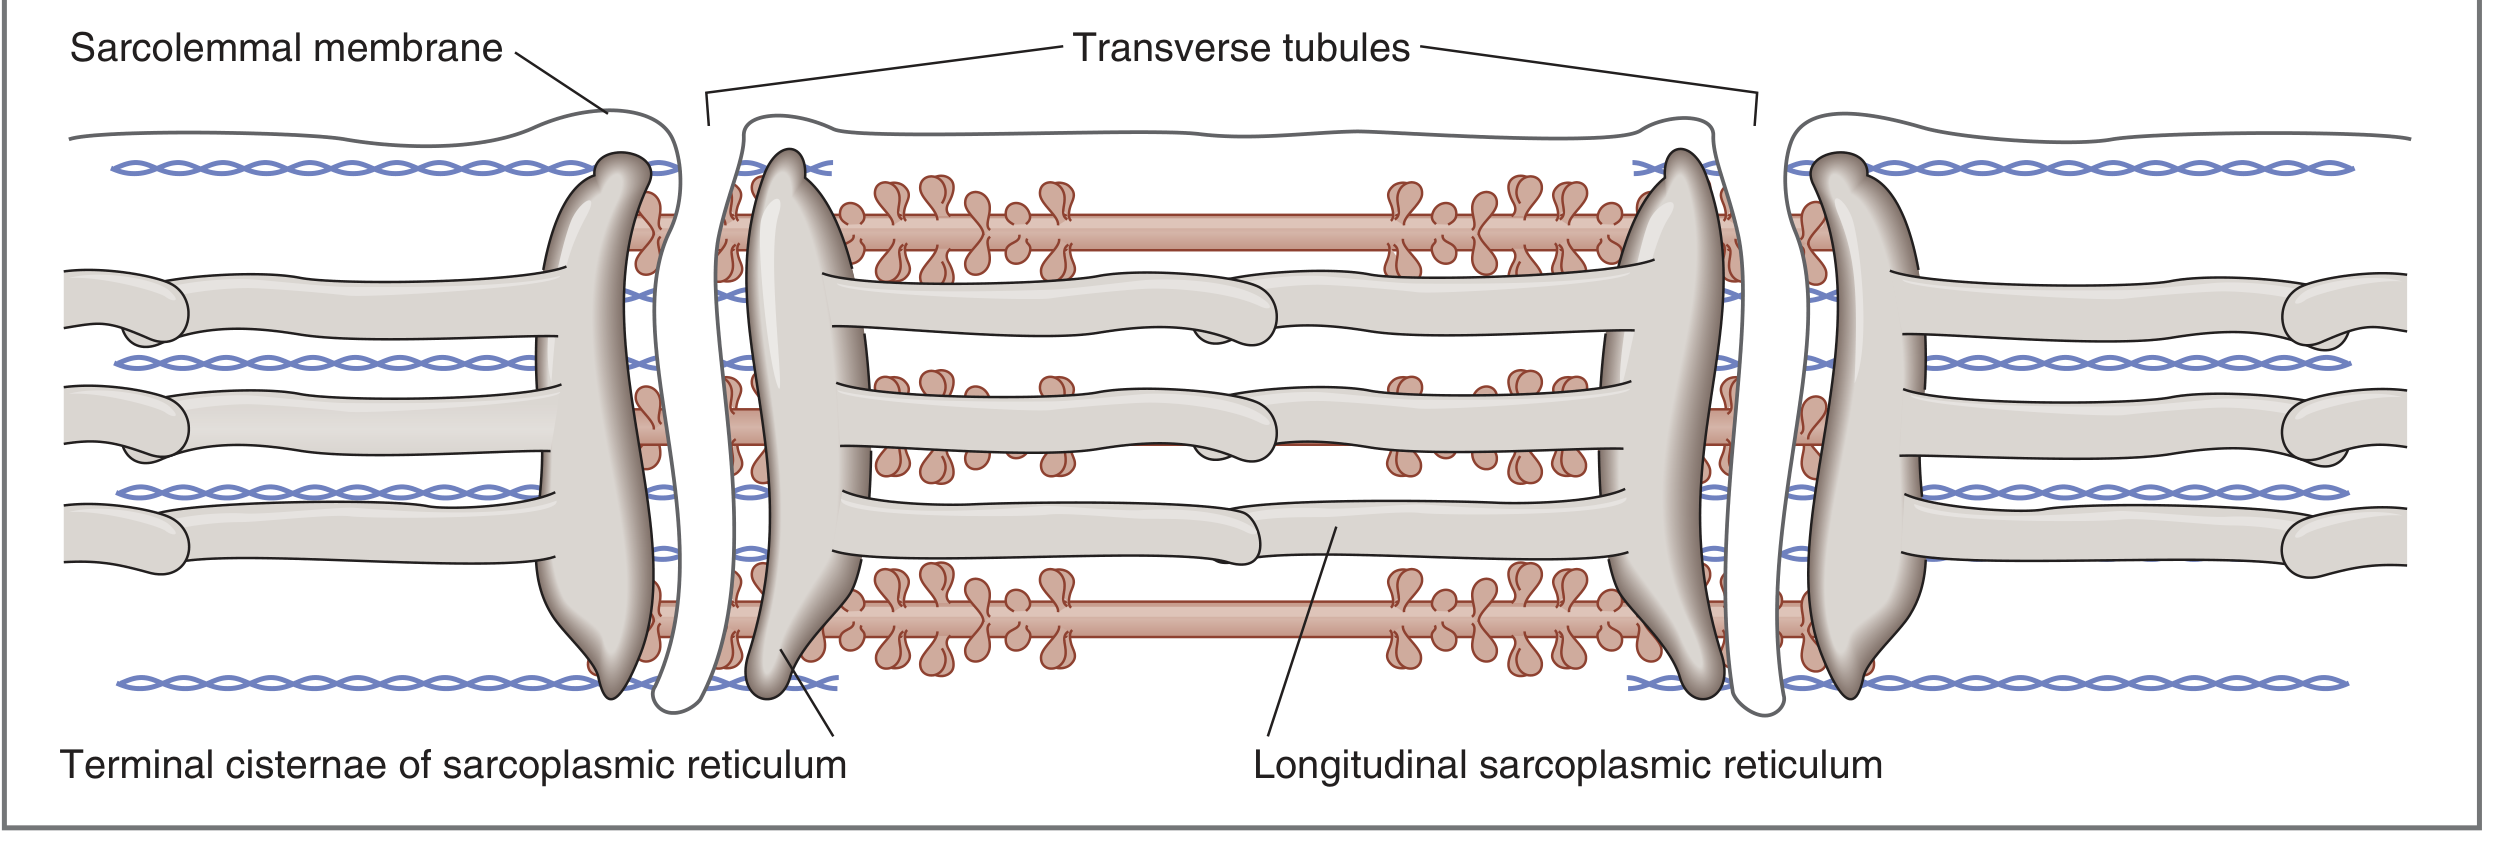
The T-Tubule / SR System
Steps of E-C Coupling
| Step | Event |
|---|---|
| 1 | Action potential propagates along sarcolemma and into T-tubules via local currents |
| 2 | Depolarization of T-tubules causes conformational change in dihydropyridine receptors (DHPR) - L-type voltage sensors |
| 3 | DHPR mechanically activates ryanodine receptors (RyR1) on adjacent terminal cisternae of the SR |
| 4 | Ca²⁺ floods from SR into sarcoplasm: resting [Ca²⁺] < 10⁻⁷ M rises to 10⁻⁷ - 10⁻⁶ M |
| 5 | Ca²⁺ binds Troponin C (up to 4 Ca²⁺/molecule, cooperatively) |
| 6 | Troponin complex changes shape → tropomyosin shifts off actin binding sites → myosin heads can now bind |
| 7 | Cross-bridge cycling begins → sarcomere shortens → tension develops |
Key note: In skeletal muscle, Ca²⁺ influx from outside the cell through DHPRs is NOT required - the DHPR acts purely as a voltage sensor and mechanically gates RyR1. This is different from cardiac muscle, where Ca²⁺ influx triggers additional Ca²⁺ release (CICR).
- Costanzo Physiology, 7th Ed., p. 43-46
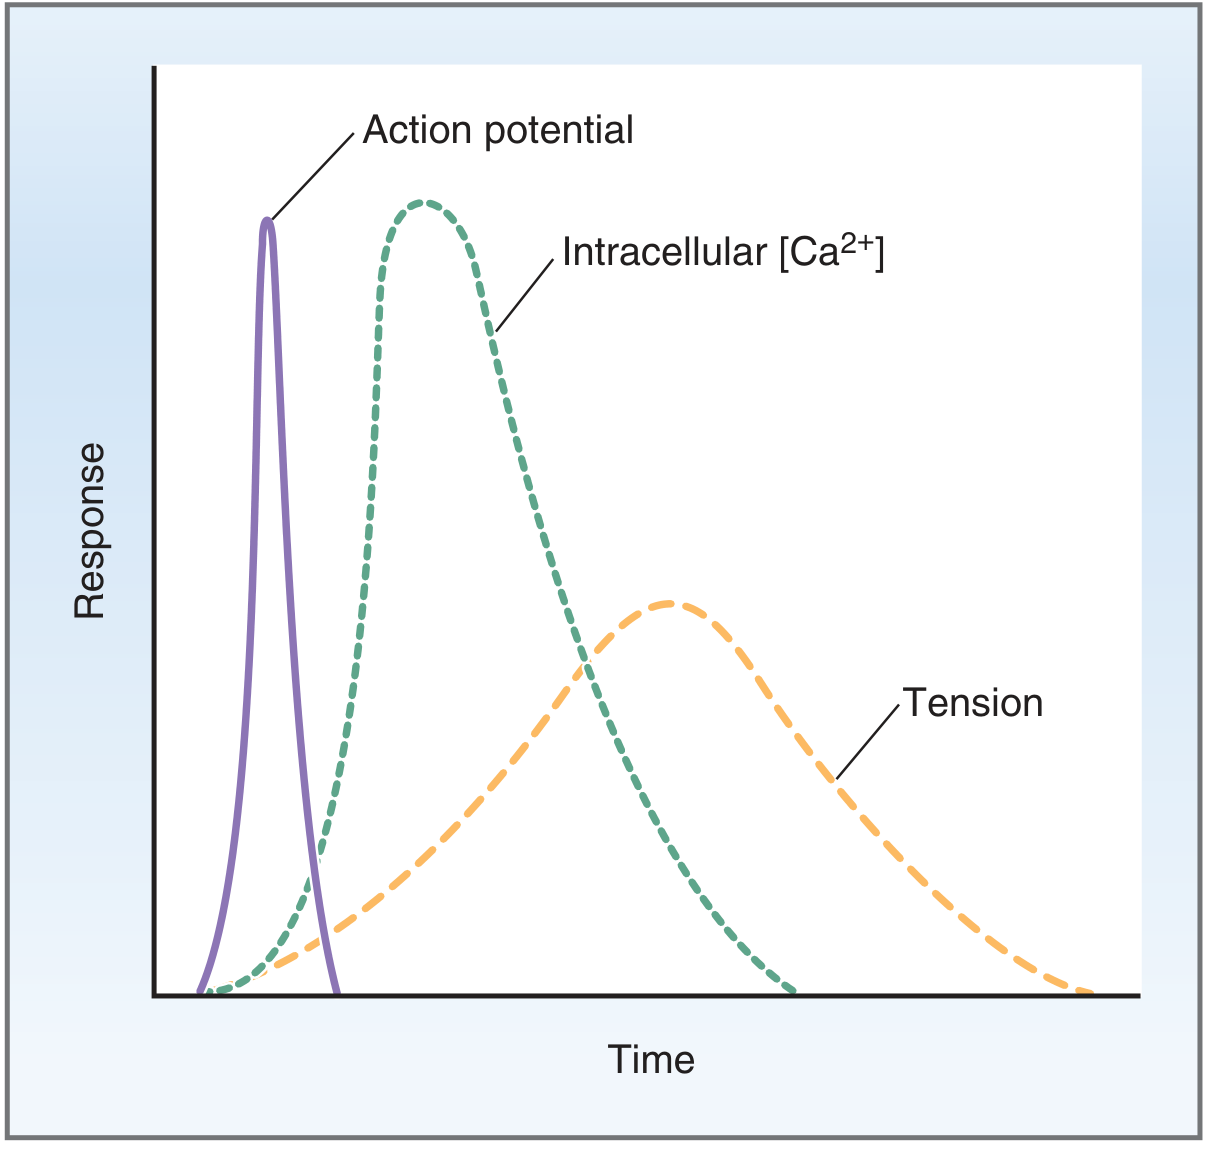
3. The Muscle Twitch
| Fiber Type | Twitch Duration | Primary Function |
|---|---|---|
| Fast fibers | as short as 7.5 ms | Fine, rapid, precise movement |
| Slow fibers | up to 100 ms | Strong, gross, sustained movement |
4. Summation and Tetanus
Mechanism of tetanus: A single action potential releases a fixed amount of Ca²⁺ from the SR. If repeated before the SR can reaccumulate it, [Ca²⁺] stays elevated, TnC remains occupied, tropomyosin stays displaced, and cross-bridge cycling is continuous. - Costanzo Physiology, p. 47
5. Isometric vs. Isotonic Contraction
| Type | Definition | What is measured |
|---|---|---|
| Isometric | Muscle develops tension but does NOT shorten (length is fixed) | Force/tension at a set preload |
| Isotonic | Muscle shortens against a fixed load (afterload) | Velocity and degree of shortening |
6. Length-Tension Relationship
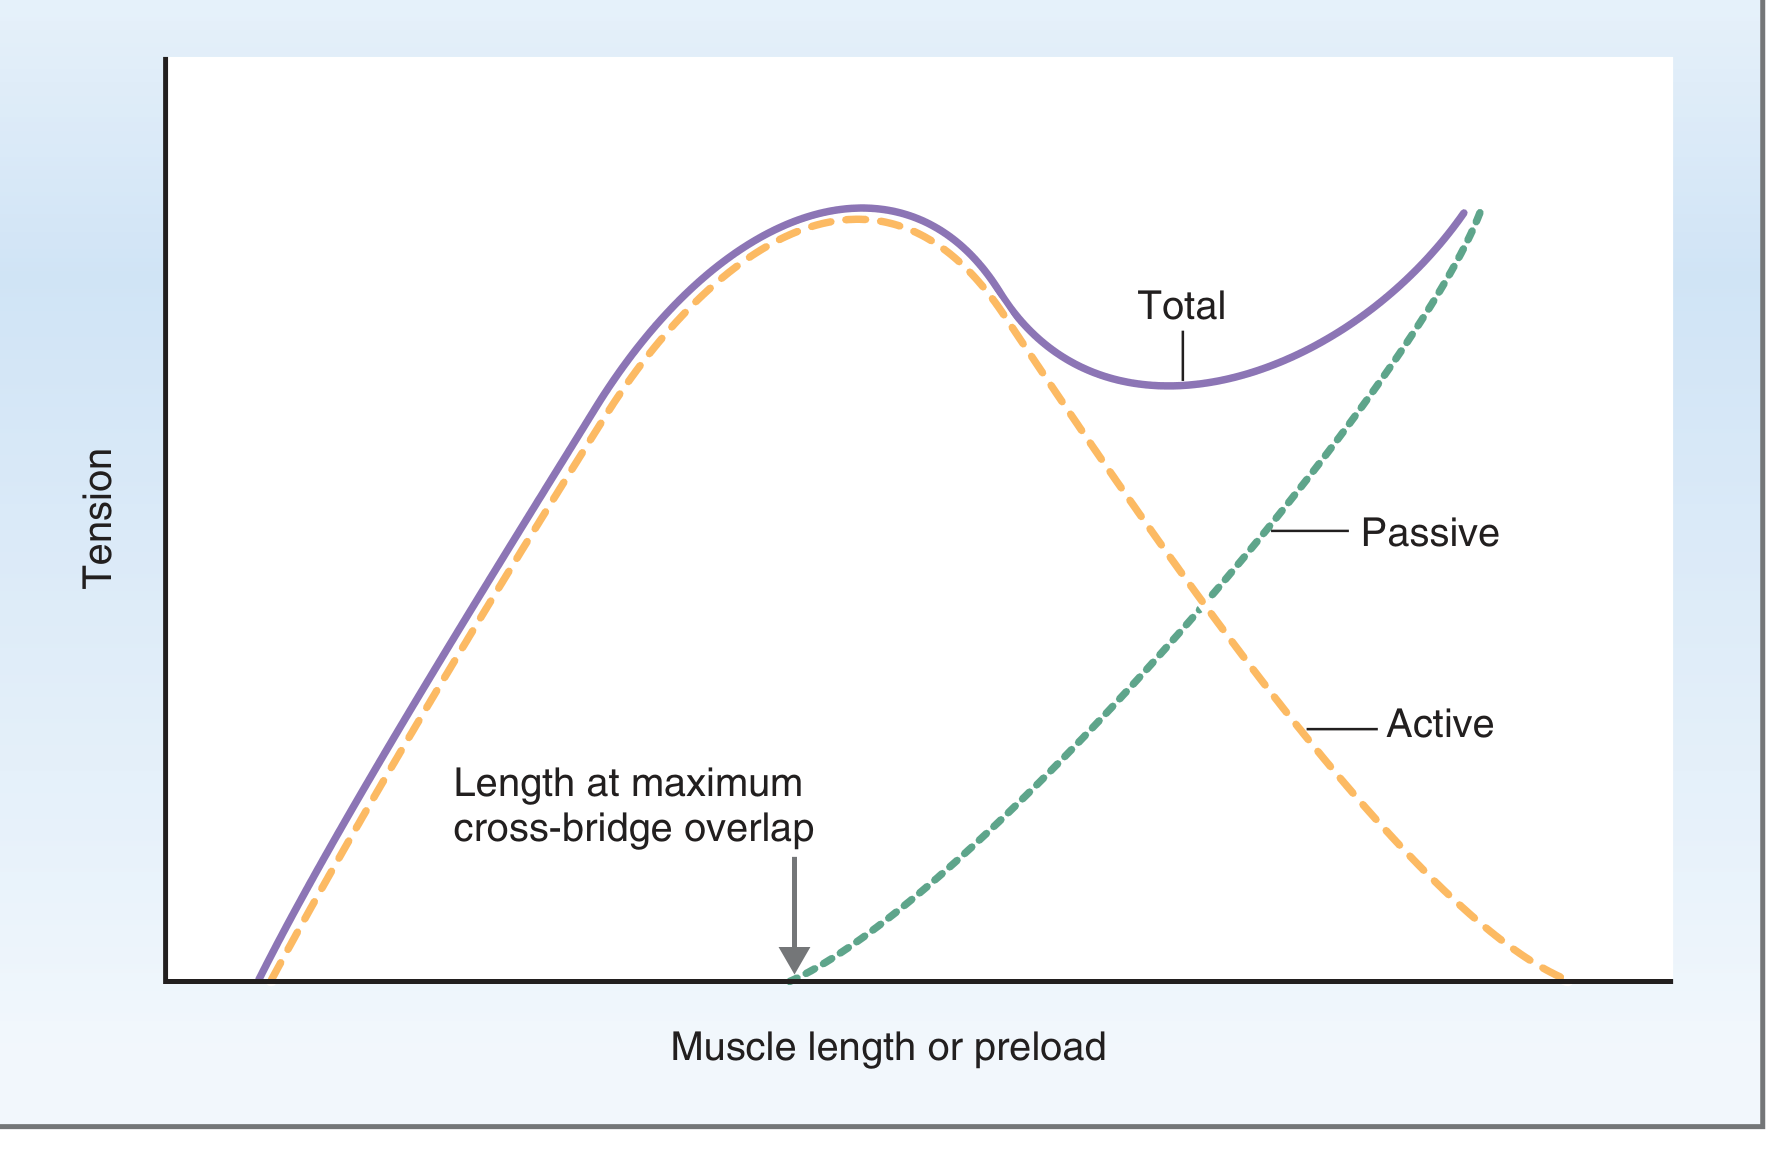
Three Components of Tension
- At optimal length (~2.2-2.3 µm sarcomere length): maximum overlap of thick and thin filaments → maximum possible cross-bridges → peak active tension
- Stretched beyond optimal: thin filaments pulled away from thick filaments → fewer cross-bridges possible → active tension falls
- Compressed below optimal: thin filaments collide in the center of the sarcomere ("double overlap") → interference reduces cross-bridge formation → active tension falls
- Costanzo Physiology, p. 47; Goldman-Cecil Medicine
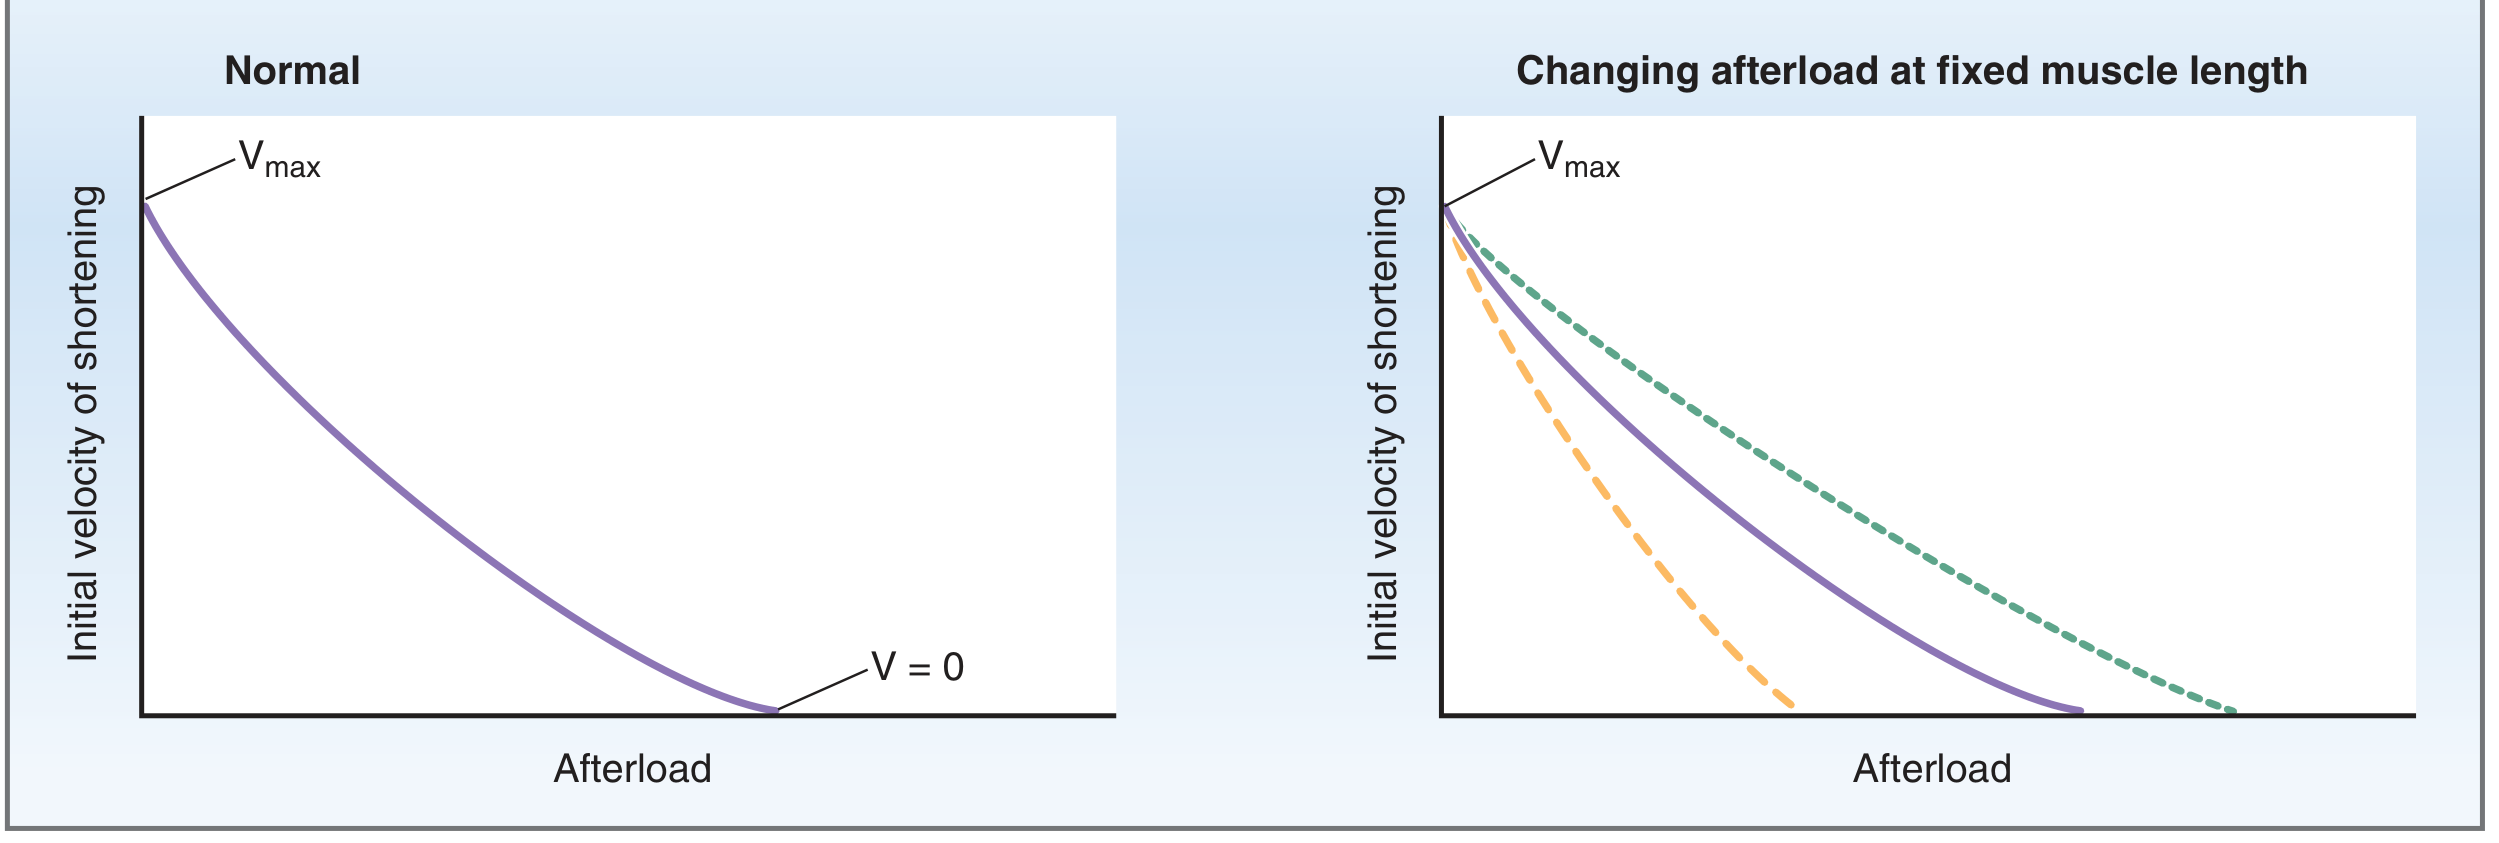
7. Force-Velocity Relationship
| Condition | Velocity |
|---|---|
| Afterload = 0 | V_max (maximal velocity, limited only by intrinsic cross-bridge cycling speed) |
| Afterload increases | Velocity decreases (cross-bridges cycle more slowly under resistance) |
| Afterload = isometric force | V = 0 (no shortening; isometric contraction) |
8. ATP and Energy Metabolism of the Sarcomere
- ATP binding → myosin detaches from actin
- ATP hydrolysis (ADP + Pi) → myosin head cocks into high-energy position
- Pi release → power stroke (force generation)
| Source | Duration | Notes |
|---|---|---|
| Phosphocreatine (PCr) | First ~10 sec | Creatine kinase rapidly regenerates ATP |
| Anaerobic glycolysis | Seconds to ~1-2 min | Fast; produces lactate |
| Oxidative phosphorylation | Minutes to hours | Most efficient; requires O₂ |
9. Clinical Relevance
| Condition | Mechanism at Sarcomere Level |
|---|---|
| Rigor mortis | ATP depletion after death → myosin cannot detach from actin → permanent cross-bridges (rigor state) |
| Malignant hyperthermia | Mutant RyR1 → uncontrolled Ca²⁺ release from SR → sustained sarcomere activation → hyperthermia and rigid muscles |
| Myasthenia gravis | Antibodies against acetylcholine receptors → reduced action potentials → fewer sarcomeres activated |
| Heart failure (Frank-Starling) | Sarcomere length-tension relationship: stretching ventricle (increased preload) increases cross-bridge overlap → greater force |
- Costanzo Physiology, 7th Ed. - pp. 43-48
- Ganong's Review of Medical Physiology, 26th Ed. - pp. 115-118
- Medical Physiology (Boron & Boulpaep)
https://youtube.com/shorts/0dRWRRmWGpU?si=CpsrGhY_WZg2zrMk This is our model now give intro about it and explain each part and it's working mechanism
https://youtube.com/shorts/0dRWRRmWGpU
Your Handmade Sarcomere Model - Introduction & Explanation
Introduction
Parts of Your Model and Their Working Mechanisms
1. 🔵 Z-Discs (Z-Lines) - The Boundaries
- The two Z-discs are the "walls" of the sarcomere
- During contraction, they move closer together (sarcomere shortens from ~2.3 µm → ~1.5 µm)
- During relaxation/stretching, they move farther apart
- In your model: the distance between the two Z-disc pieces decreases when you demonstrate contraction
2. 🔴 Thick Filaments (Myosin) - The Motor
- Myosin is the motor protein - it does the pulling work
- The myosin heads bind to actin, perform a power stroke (bend at 45°), and pull the thin filaments inward
- Myosin heads on the left half of the thick filament point LEFT; heads on the right half point RIGHT - so both sides pull actin toward the center simultaneously
- In your model: the red strips stay in the center and do not move - only the actin slides past them
3. 🔵/🟢 Thin Filaments (Actin) - The Track
- Actin is the track on which myosin heads walk
- During contraction, actin filaments slide inward (toward the M-line) over the thick filaments
- The filaments themselves do NOT shorten - they just overlap more
- In your model: the blue/green strips slide inward when you demonstrate contraction, increasing overlap with the red myosin strips
4. ⚫ M-Line (M-Band) - The Anchor
- Acts as the central anchor for thick filaments
- Keeps all myosin filaments precisely aligned in 3D
- Does NOT move during contraction - it is a fixed reference point
- In your model: the M-line stays stationary at the center throughout
5. 📏 Bands and Zones - What Changes During Contraction
| Band | Shown in Model | Resting | During Contraction | Why |
|---|---|---|---|---|
| A band | Full width of red myosin | Wide | Stays the same | Thick filament length never changes |
| I band | Space between Z-disc and start of red myosin | Wide | Gets narrower | Actin slides inward, reducing bare actin zone |
| H band | Central bare zone within red myosin (no actin overlap) | Wide | Narrows/disappears | Actin tips penetrate the H zone during contraction |
| Sarcomere length | Distance between two Z-discs | ~2.2 µm | Shortens to ~1.5 µm | Z-discs pulled closer together |
- The gap between the Z-disc and the red strips gets smaller (I band narrows)
- The central bare region of the red strips gets covered by the incoming green/blue strips (H band narrows)
- But the total length of the red strips is unchanged (A band constant)
6. 🟡 Myosin Heads / Cross-Bridges
1. RIGOR (no ATP) → myosin tightly bound to actin
2. ATP BINDS → myosin detaches from actin
3. ATP HYDROLYSIS → myosin head cocks (bends back ~90°)
4. Pi RELEASE → power stroke (head snaps to 45°, pulls actin ~10 nm)
→ ADP released → back to rigor state
- In your model: the hooks/projections visually show the cross-bridges that form between thick and thin filaments in the overlap zone
7. 🌀 Titin (if included)
- When sarcomere is compressed: titin buckles (slack)
- When sarcomere is at optimal length: titin is taut, providing centering force
- When sarcomere is overstretched: titin resists further extension, protecting the sarcomere from tearing
How to Demonstrate Contraction with Your Model
- I bands narrow
- H band disappears
- A band stays the same width
- Sarcomere is shorter
Note: I was unable to directly view your specific YouTube Short due to platform restrictions. The description above is based on the standard design of handmade sarcomere sliding models. If your model has unique components (springs, buttons, LEDs, elastic bands, additional labels), share a screenshot or describe those parts and I'll explain each one specifically!
Ans in short
Sarcomere Model - Short Explanation
Intro
Parts & Mechanism
| Part | Color (typical) | Function |
|---|---|---|
| Z-Disc | Dark blue/black vertical strips | Anchors actin; sarcomere boundary - moves closer during contraction |
| Thick Filament (Myosin) | Red/pink horizontal strips | Motor protein; myosin heads perform the power stroke pulling actin inward |
| Thin Filament (Actin) | Blue/green strips from Z-disc | Slides inward over myosin during contraction; does NOT shorten itself |
| M-Line | Central vertical line | Anchors thick filaments at center; stays fixed |
| H-Band | Bare center of myosin (no actin) | Narrows/disappears during contraction as actin slides in |
| I-Band | Actin-only zone near Z-disc | Narrows during contraction |
| A-Band | Full length of myosin | Never changes - key exam point |
| Myosin heads | Small hooks on myosin | Bind actin → power stroke → release → re-cock (needs ATP) |
What Happens When You Pull/Push the Model
- Push together = contraction → I-band & H-band narrow, Z-discs come closer
- Pull apart = relaxation → I-band & H-band widen, Z-discs move apart
- A-band width = always the same, no matter what
One-Line Mechanism
Explain in short
Sarcomere - Short & Simple
What is it?
Key Parts
Bands - What Changes?
| Band | Change during contraction |
|---|---|
| A-band | ❌ No change (always same) |
| I-band | ✅ Narrows |
| H-band | ✅ Narrows / disappears |
Contraction in 5 Steps
- Nerve fires → action potential reaches muscle
- Ca²⁺ released from sarcoplasmic reticulum
- Ca²⁺ binds Troponin C → tropomyosin shifts → actin binding sites exposed
- Myosin head binds actin → power stroke → actin slides inward (~10 nm per stroke)
- ATP binds myosin → head detaches → re-cocks → cycle repeats
Relaxation
Key rule: Filaments never shorten - they only slide past each other.