
I am internal medicine, resident. I want to know about all the pharmacology of corticosteroids and their processes and use in detail
corticosteroid mechanism of action glucocorticoid receptor diagram
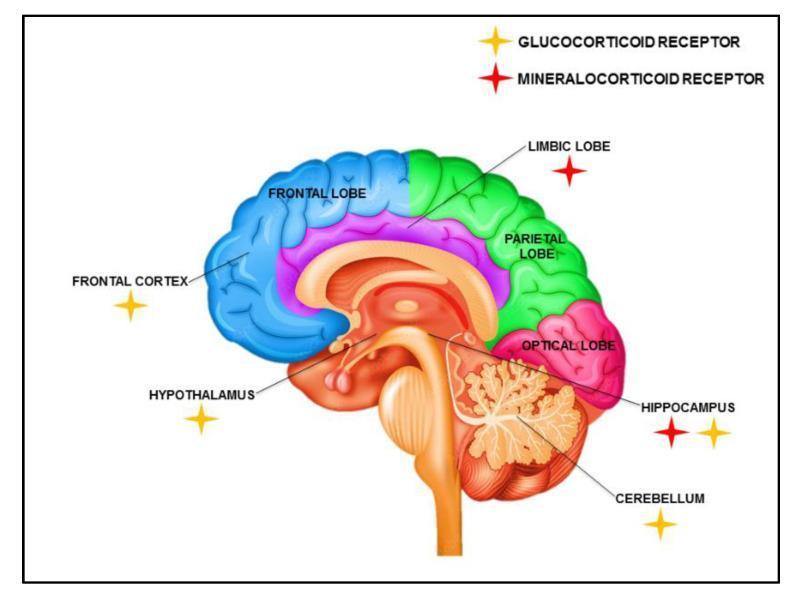
This medical anatomical diagram provides an educational overview of the distribution of glucocorticoid receptors (GR) and mineralocorticoid receptors (MR) in a sagittal section of the human brain. The illustration uses color-coded regions to delineate neuroanatomical structures: the frontal lobe and frontal cortex are shades of blue, the parietal and limbic lobes are green, and the occipital (labeled 'optical') lobe is pink. Subcortical structures including the hypothalamus, hippocampus, cerebellum, and brainstem are also clearly depicted. Using a symbolic key, the diagram identifies specific locations of corticosteroid receptors. Glucocorticoid receptors (GR), denoted by yellow star icons, are shown in the frontal cortex, hypothalamus, cerebellum, and hippocampus. Mineralocorticoid receptors (MR), denoted by red plus-sign icons, are localized to the limbic lobe and the hippocampus. Notably, the hippocampus is illustrated as a primary site where both receptor types co-exist. This visual aid is designed to demonstrate the neuroanatomical basis of the stress response and the differential signaling pathways of corticosteroids in the central nervous system, serving as an educational resource for neurobiology and endocrinology.
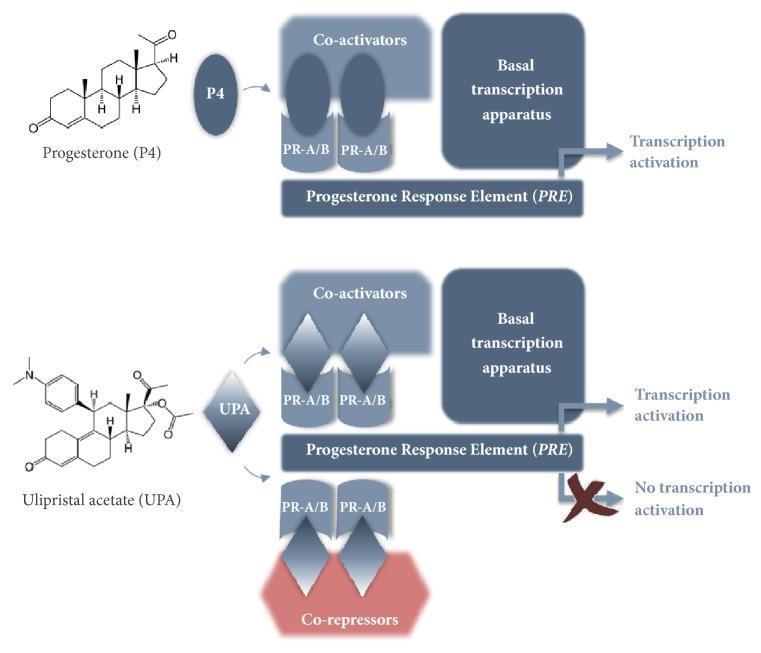
This pathophysiology diagram illustrates the molecular mechanism of action of Selective Progesterone Receptor Modulators (SPRMs) compared to Progesterone (P4). The upper panel depicts the natural ligand, Progesterone, binding to the Progesterone Receptor isoforms PR-A/B. This complex binds to the Progesterone Response Element (PRE) and recruits co-activators to the basal transcription apparatus, resulting in transcription activation. The lower panel displays the mechanism for Ulipristal Acetate (UPA), an SPRM used in the treatment of uterine fibroids. UPA binds to PR-A/B on the PRE; however, its unique chemical structure induces a conformational change that allows for the recruitment of both co-activators and co-repressors. The recruitment of co-repressors (indicated in red) inhibits the basal transcription apparatus, leading to the prevention of transcription activation, denoted by a red cross over the transcription arrow. This diagram highlights the mixed agonistic/antagonistic properties of SPRMs at the genomic level, which underpins their clinical efficacy in regulating endometrial and fibroid tissue proliferation.
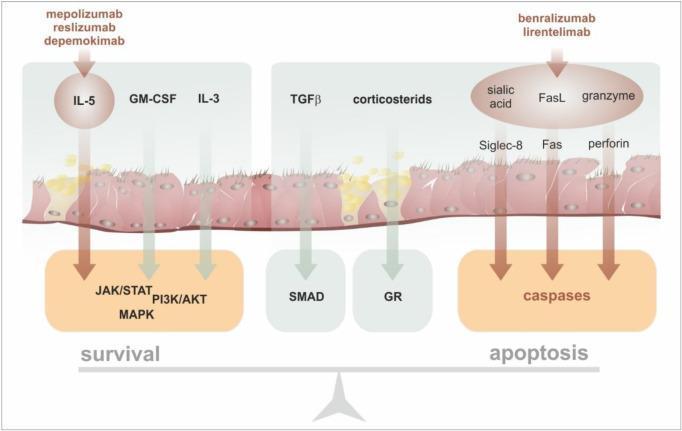
A medical illustration depicting the molecular mechanisms of action for antieosinophil biologicals and their impact on eosinophil life cycle. The diagram is structured as a balance between 'survival' and 'apoptosis'. On the left (survival), biologicals like mepolizumab, reslizumab, and depemokimab target IL-5, blocking its downstream signaling through the cell membrane. Other prosurvival inputs shown include GM-CSF and IL-3, which activate intracellular pathways such as JAK/STAT, PI3K/AKT, and MAPK. In the center, inhibitory and regulatory signals like TGFβ and corticosteroids act via SMAD and the glucocorticoid receptor (GR), respectively. On the right (apoptosis), biologicals like benralizumab and lirentelimab are shown inducing cell death. This process involves the inhibitory receptor Siglec-8 (interacting with sialic acid), the Fas receptor (interacting with FasL), and the perforin/granzyme pathway, all converging on the activation of intracellular caspases. The illustration highlights how different pharmacotherapies modulate these signaling pathways to reduce eosinophil counts in conditions such as severe eosinophilic asthma.
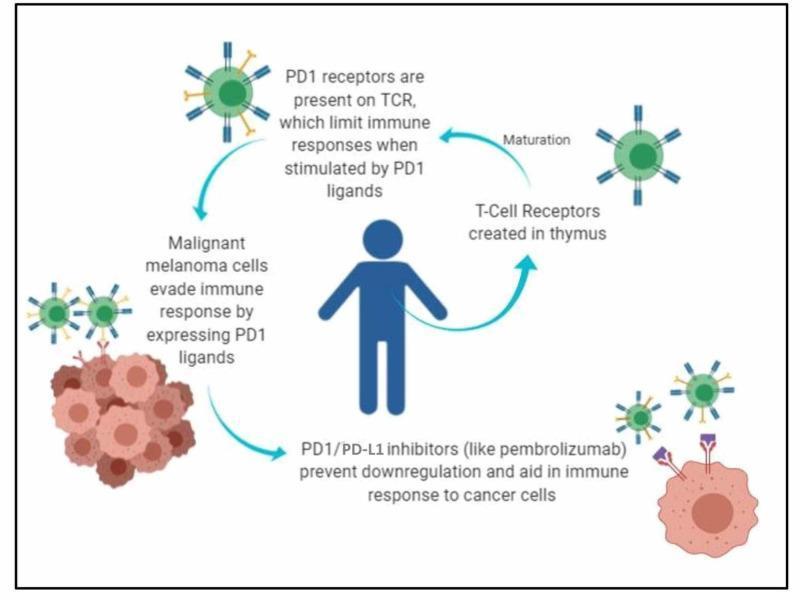
This pathophysiology diagram illustrates the mechanism of action of PD-1/PD-L1 inhibitors in the context of metastatic melanoma. The visual follows a circular educational flow starting with T-cell maturation, where T-cell receptors (TCRs) created in the thymus are shown progressing to a mature state expressing PD-1 receptors. The diagram depicts malignant melanoma cells as a cluster of pink/brown spherical cells that express PD-1 ligands (PD-L1) to evade immune detection by binding to the PD-1 receptors on T-cells, which normally limits the immune response. In the final stage of the diagram, the intervention of PD-1/PD-L1 inhibitors (such as pembrolizumab) is visualized as Y-shaped antibody structures blocking the interaction between the cancer cell's PD-L1 and the T-cell's PD-1 receptor. This blockade prevents immune downregulation and facilitates an active immune response against the tumor cells. The central human silhouette anchors the physiological processes within the systemic immune context.
corticosteroid side effects adverse effects diagram
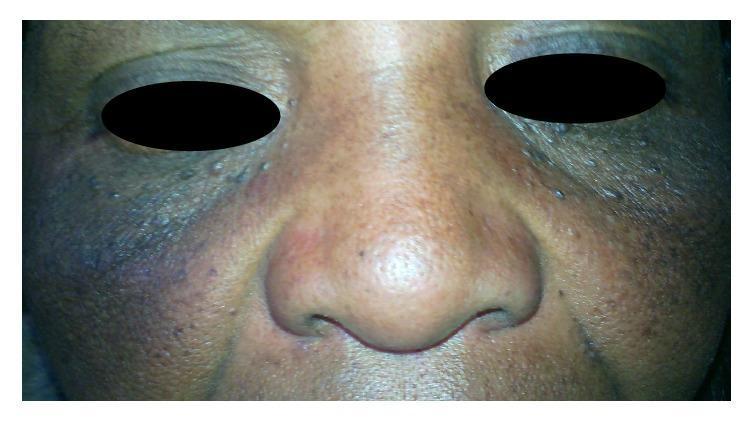
Clinical photograph of the mid-face of a patient with darker skin phototype demonstrating dermatological adverse effects of topical corticosteroid use. The image shows prominent, confluent, asymmetrical hyperpigmentation across the malar regions and cheeks, transitioning from deep brown to slaty bluish-black hues. In addition to the pigmentary changes, there are visible surface textural irregularities, including numerous small, skin-colored to slightly pigmented papules, suggestive of steroid-induced acne or follicular occlusion. Mild erythema is noted on the nasal bridge and alae. The clinical presentation illustrates exogenous pigmentary disorders and cutaneous atrophy often associated with the chronic or inappropriate application of high-potency topical steroids. This material is useful for medical education regarding iatrogenic skin conditions and the importance of monitoring topical therapy in dermatology.
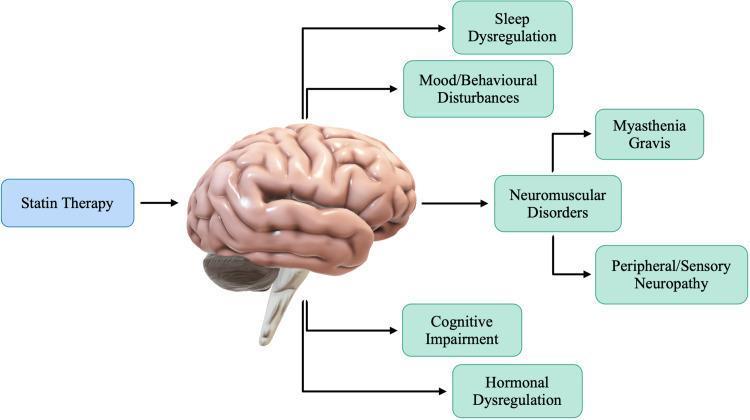
This medical illustration functions as a pathophysiology diagram mapping the proposed neurological adverse effects associated with statin therapy. Centered in the diagram is a stylized 3D model of a human brain. To the left, a blue box labeled 'Statin Therapy' points an arrow toward the brain, signifying pharmacological influence. From the brain, five branching pathways lead to green boxes representing specific clinical manifestations: Sleep Dysregulation, Mood/Behavioural Disturbances, Neuromuscular Disorders, Cognitive Impairment, and Hormonal Dysregulation. The Neuromuscular Disorders node further branches into two specific clinical entities: Myasthenia Gravis and Peripheral/Sensory Neuropathy. This diagram serves as an educational summary of how HMG-CoA reductase inhibitors may impact the central and peripheral nervous systems, intended for medical students and clinicians studying pharmacovigilance and drug side-effect profiles in lipid management.
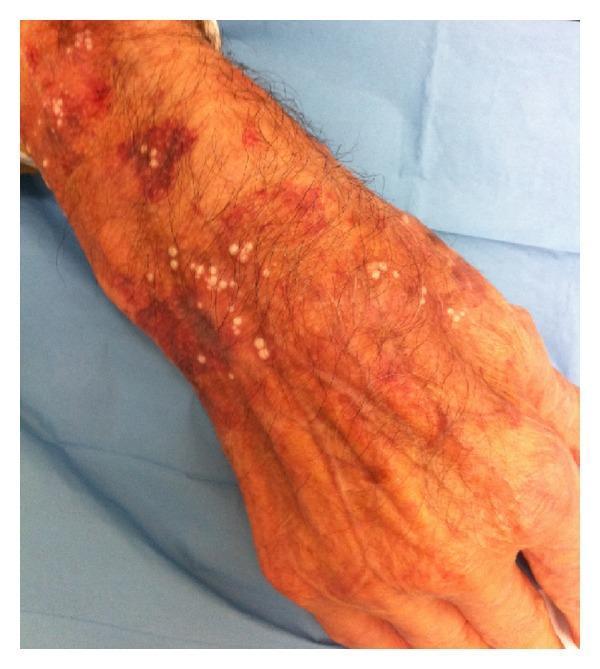
This clinical photograph displays the dorsal aspect of a human forearm and hand exhibiting classic cutaneous adverse effects from chronic, high-potency topical corticosteroid use. The image demonstrates a triad of clinical signs: rubeosis steroidica, senile-like purpura, and secondary milia. The background skin appears atrophic with prominent wrinkling and visible vasculature. A mottled, erythematous-to-brownish flushing (rubeosis steroidica) is observed throughout the hand and wrist. Superimposed on this are dark reddish-purple, irregular macules and patches of purpura, particularly concentrated on the distal forearm. Additionally, numerous small (1-2 mm), discrete, pearly-white, raised papules consistent with milia are scattered across the purpuric and erythematous regions. These findings illustrate the structural and vascular compromise of the dermis resulting from prolonged glucocorticoid therapy, useful for dermatological education on iatrogenic skin conditions.
glucocorticoid steroid synthesis adrenal cortex zones
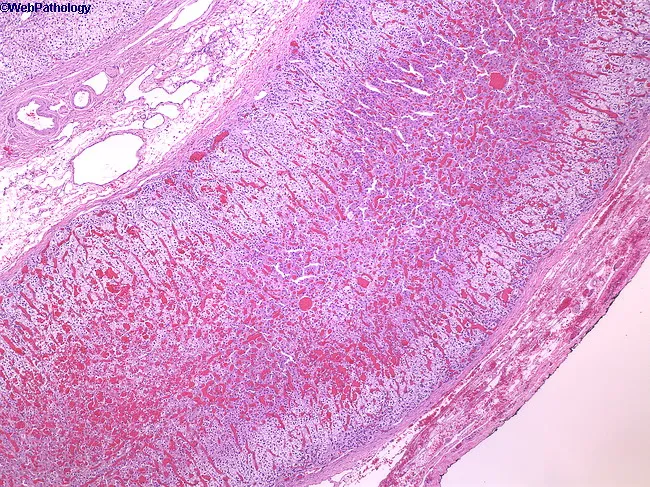
This histology image depicts a low-power hematoxylin-eosin stained cross-section of the mammalian adrenal gland, showing the capsule and the steroidogenic cortex with its three distinct zonal architectures. The adrenal cortex comprises approximately 90% of the gland and is organized into zona glomerulosa (outermost), zona fasciculata (widest middle layer), and zona reticularis (inner zone) adjacent to the medulla. The cortex appears pale and vesiculated due to lipid-rich, foamy cytoplasm within steroid-producing cells, arranged in cords and fascicles separated by sinusoids. At this low magnification, the boundary between capsule and cortex is evident, although a detailed medullary region is not fully resolved. The image demonstrates normal cortical histology without overt neoplasia, hemorrhage, or fibrosis. The adrenal cortex synthesizes glucocorticoids, mineralocorticoids, and androgens under ACTH regulation, with zonation reflecting functional segregation: zona glomerulosa producing aldosterone, zona fasciculata secreting cortisol, and zona reticularis generating dehydroepiandrosterone. Clinically, this pattern is essential for understanding endocrine physiology and adrenal disorders. This composite image serves educational reference for histology, pathology, and medical education, enabling comparison to hyperplasia, adenomas, or pheochromocytoma in other sections. The slide illustrates capsule integrity, distinct cortical zones, and ordinary vascular architecture relevant to teaching. Useful for exams, case discussions, and comparative pathology analyses exercises.
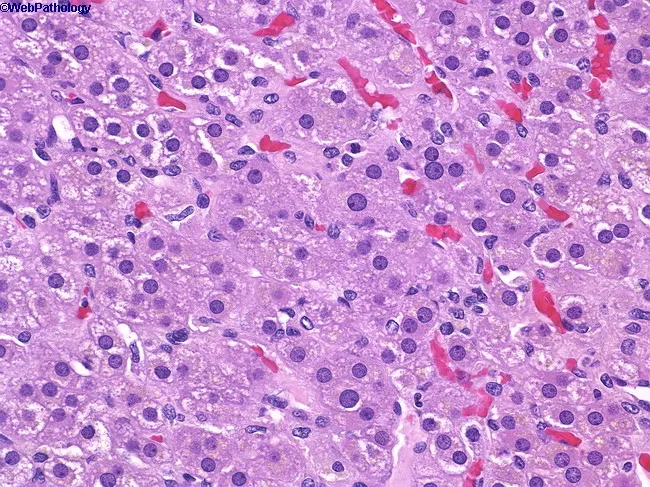
Imaging modality: Light microscopy of adrenal gland tissue, Hematoxylin and Eosin (H&E) stained section, viewed under brightfield illumination at high magnification (approximately 400x). Anatomical location: adrenal cortex with zona reticularis occupying the deepest corticoid layer, immediately superficial to the adrenal medulla, behind zona fasciculata. Visual features: cells arranged in anastomosing cords and small nests; cytoplasm is acidophilic and granular; nuclei are round to vesicular with prominent punctate nucleoli; capillary sinusoids are intermixed, producing a lobular vascular network. The zona reticularis lies between the zona fasciculata and the medulla, forming a reticular, fine meshwork. The cellular morphology indicates steroidogenic chromaffin-adjacent cells with robust endoplasmic reticulum and lipid-poor cytoplasm relative to fasciculata. Notable features include tight cell-to-cell contacts, vascularized stroma, and delineation from the surrounding zones. Pathophysiology/diagnostic significance: Normal zonation of the adrenal cortex is demonstrated; zona reticularis is responsible for glucocorticoid and sex hormone synthesis (androgen precursors), contributing to the endocrine milieu. Clinical relevance: understanding this histology supports differential diagnosis of adrenal cortical neoplasms and endocrine disorders; potential use in educational contexts, research on steroidogenesis, and histopathology training. This image serves as a reference for adrenal cortical anatomy, steroidogenic cell morphology, and the interface with the medulla.
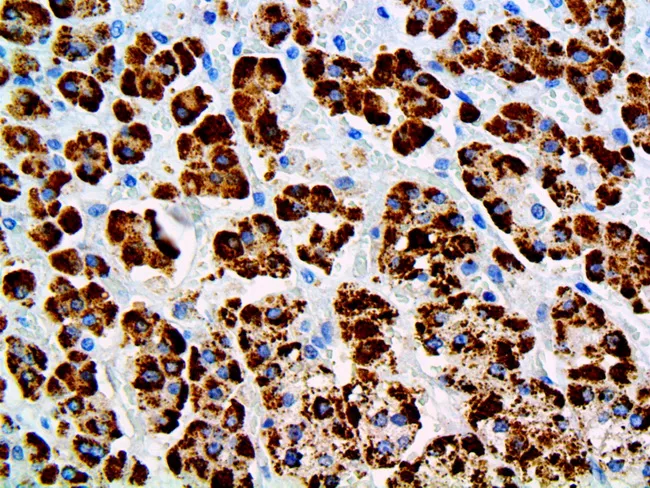
Label: Immunohistochemistry of adrenal tissue demonstrating strong STAR (steroidogenic acute regulatory protein) immunoreactivity. Modality: brightfield immunohistochemistry on a formalin-fixed paraffin-embedded adrenal cortex section. Primary target: STAR protein localized to the cytoplasm of steroidogenic adrenal cortical cells, with intense granular brown DAB signal and a light hematoxylin counterstain for nuclei. Imaging: high-magnification microscopic view showing diffuse, strong cytoplasmic staining across the cortex with preserved tissue architecture in cords and trabeculae. Biological relevance: STAR mediates cholesterol transport into mitochondria and the rate-limiting step of pregnenolone synthesis; its expression marks functional steroidogenesis. Diagnostic significance: STAR is a sensitive and specific marker for steroid-producing cells; in testicular pathology it differentiates sex cord-stromal tumors from germ cell tumors; in adrenal tissue it confirms steroidogenic lineage, and can aid in characterizing adrenocortical tumors versus non-steroid producing neoplasms. Technical notes: DAB chromogen yields brown precipitate; hematoxylin counterstain provides blue nuclei; no counterstain or contrast agent beyond standard reagents. Comparative considerations: positive STAR supports a steroidogenic phenotype, whereas absence suggests non-steroidogenic lineage; integration with additional markers (SF-1, inhibin, p450(c17)) improves diagnostic confidence. Educational utility: illustrates immunophenotype of STAR in adrenal cortex and related tissues, with implications for endocrinology, surgical pathology, and oncology.
HPA axis hypothalamus pituitary adrenal feedback cortisol
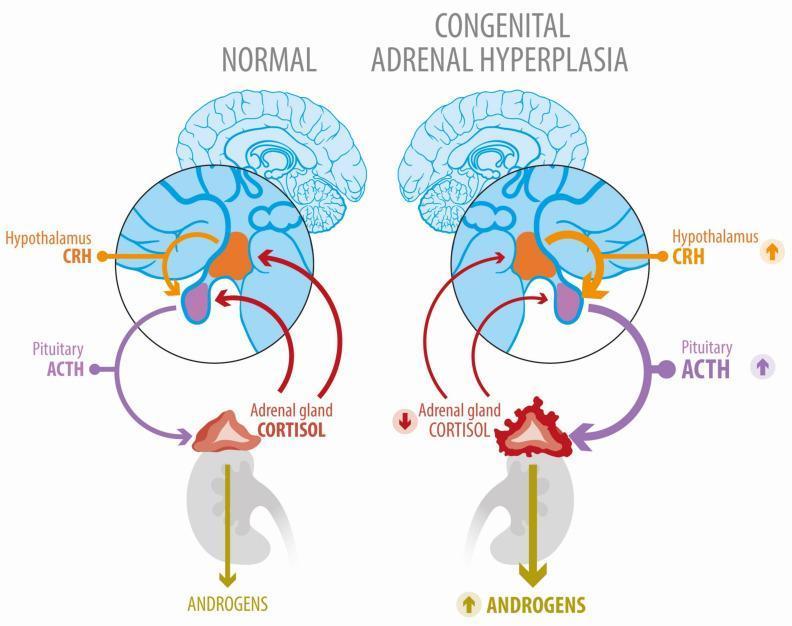
A comparative medical illustration of the Hypothalamic-Pituitary-Adrenal (HPA) axis under normal conditions and in Congenital Adrenal Hyperplasia (CAH). The 'Normal' panel displays a balanced feedback loop: the hypothalamus releases CRH to stimulate pituitary ACTH production, which in turn stimulates the adrenal gland to produce cortisol. Cortisol provides negative feedback to both the hypothalamus and pituitary. In the 'Congenital Adrenal Hyperplasia' panel, a block in the cortisol synthesis pathway (indicated by a downward red arrow) leads to reduced negative feedback. Consequently, the diagram shows compensatory increases in hypothalamic CRH and pituitary ACTH (upward purple and orange arrows). Visually, the adrenal gland in CAH is depicted as enlarged, irregular, and hyperplastic compared to the normal gland. This overstimulation by ACTH causes a metabolic shunt, resulting in significantly increased androgen production, represented by a thick, downward-pointing yellow arrow with an upward indicator. The diagram effectively illustrates the pathophysiology of 21-hydroxylase deficiency and the resulting secondary hyperandrogenism.
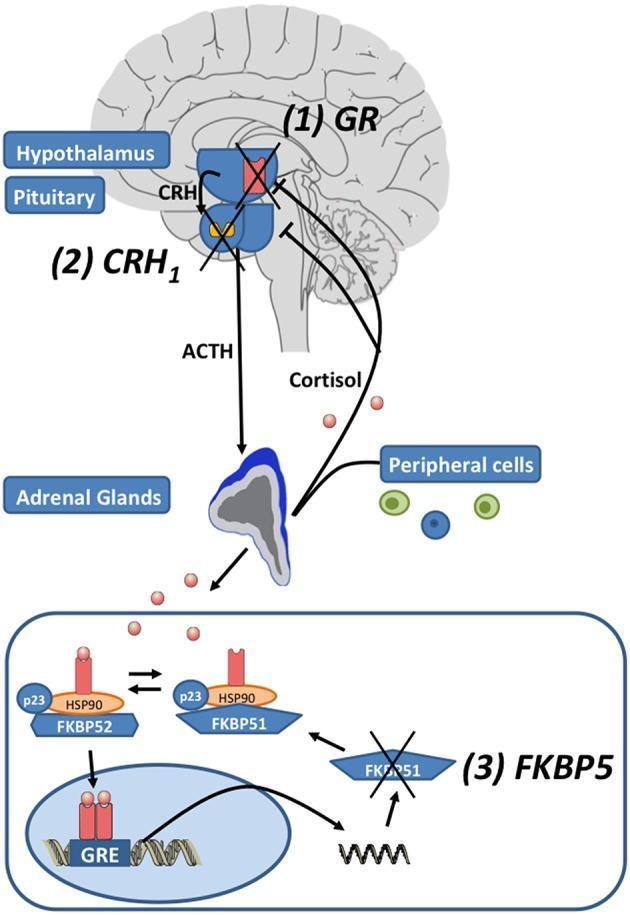
A multi-level pathophysiology diagram illustrating the hypothalamic-pituitary-adrenal (HPA) axis and the intracellular glucocorticoid receptor (GR) signaling pathway. The upper section shows the systemic feedback loop: the hypothalamus releases corticotropin-releasing hormone (CRH), acting on the pituitary gland’s CRH1 receptors to trigger adrenocorticotropic hormone (ACTH) secretion. ACTH stimulates the adrenal glands to release cortisol, which provides negative feedback to the brain. Pharmacological targets (1) GR, (2) CRH1, and (3) FKBP5 are marked with red 'X' symbols, indicating points of therapeutic inhibition. The lower section provides a detailed molecular view of GR regulation. It depicts the chaperone complex involving HSP90, p23, and the co-chaperones FKBP51 and FKBP52. The diagram illustrates that binding of cortisol facilitates an exchange of FKBP51 for FKBP52, allowing the ligand-bound GR to translocate into the nucleus. Within the nucleus, the GR binds to glucocorticoid response elements (GRE) on DNA to induce transcription, including the mRNA expression of FKBP5, which acts as an ultra-short negative feedback regulator of GR sensitivity.
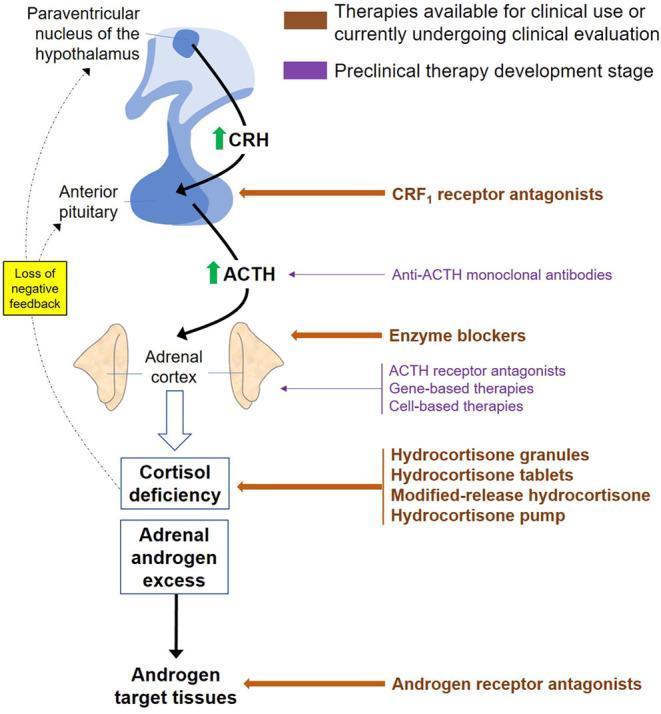
This pathophysiology diagram illustrates the hypothalamic-pituitary-adrenal (HPA) axis in the context of Congenital Adrenal Hyperplasia (CAH) and its pharmacological targets. The central pathway shows the paraventricular nucleus of the hypothalamus releasing CRH to stimulate the anterior pituitary, which then secretes ACTH. In CAH, 21-hydroxylase deficiency leads to cortisol deficiency, causing a loss of negative feedback and subsequent ACTH elevation. This drive results in adrenal androgen excess affecting target tissues. Therapeutic interventions are categorized by development stage: Clinical-stage therapies (brown labels) include CRF1 receptor antagonists, various hydrocortisone delivery methods (granules, tablets, modified-release, and pumps), and androgen receptor antagonists. Preclinical therapies (purple labels) include anti-ACTH monoclonal antibodies, enzyme blockers, ACTH receptor antagonists, and gene- or cell-based therapies. The diagram highlights the strategy of mitigating androgen excess by either replacing cortisol to restore feedback or directly inhibiting signaling at various levels of the axis.
Corticosteroids: Complete Pharmacology Reference for Internal Medicine
1. OVERVIEW AND CLASSIFICATION
| Class | Prototype | Primary Role |
|---|---|---|
| Glucocorticoids | Cortisol (hydrocortisone) | Metabolic regulation, anti-inflammatory, immunosuppressive |
| Mineralocorticoids | Aldosterone | Electrolyte and water balance |
2. BIOSYNTHESIS AND THE ADRENAL ZONES
| Zone | Product | Regulatory Signal |
|---|---|---|
| Zona glomerulosa (outer) | Aldosterone | Angiotensin II, K⁺ |
| Zona fasciculata (middle) | Cortisol | ACTH |
| Zona reticularis (inner) | DHEA, androstenedione | ACTH |
- Cholesterol → Pregnenolone: CYP11A1 (cholesterol side-chain cleavage) - rate-limiting step, requires StAR protein for mitochondrial cholesterol transport
- Pregnenolone → Progesterone: 3β-HSD
- Progesterone → 17α-hydroxyprogesterone: CYP17A1 (17α-hydroxylase)
- 17α-hydroxyprogesterone → 11-deoxycortisol: CYP21A2 (21-hydroxylase)
- 11-deoxycortisol → Cortisol: CYP11B1 (11β-hydroxylase)
- Aldosterone synthesis additionally requires CYP11B2 (aldosterone synthase), only in glomerulosa
3. THE HPA AXIS AND FEEDBACK CONTROL
- ACTH is derived from the precursor POMC (pro-opiomelanocortin) by proteolytic cleavage (via PCSK1/3 and PCSK2). POMC also yields β-endorphin, lipotropins, and MSH peptides.
- ACTH acts via MC2R (melanocortin receptor 2) on adrenocortical cells.
- Cortisol exerts negative feedback on both the hypothalamus (inhibiting CRH) and the pituitary (inhibiting ACTH release).
- Diurnal rhythm: Peak cortisol in early morning hours (6-8 AM), nadir several hours after sleep onset.
- Stress (physical, psychological, hemorrhage, hypoglycemia) overrides negative feedback and drives ACTH release.
- Prolonged exogenous corticosteroid use suppresses the HPA axis, leading to adrenal atrophy and risk of adrenal insufficiency on sudden withdrawal.
4. GLUCOCORTICOID AND MINERALOCORTICOID RECEPTORS
4a. Receptor Structure
- N-terminal domain (AF-1): Transcriptional regulatory function
- Central DNA-binding domain (DBD): Zinc-finger motifs for binding glucocorticoid response elements (GREs)
- C-terminal ligand-binding domain (LBD)
4b. Genomic Mechanisms
- Upregulates anti-inflammatory proteins: lipocortin-1 (annexin A1, inhibits phospholipase A2), IkB (inhibits NF-kB), GILZ, MKP-1
- Upregulates gluconeogenic enzymes (PEPCK, glucose-6-phosphatase)
- Upregulates surfactant proteins in lung
- Inhibits NF-kB (suppresses TNF-α, IL-1, IL-6, IL-8, COX-2)
- Inhibits AP-1 (c-Fos/c-Jun)
- This mechanism accounts for most of the anti-inflammatory effects
4c. Non-Genomic Mechanisms
- Membrane-associated GR signaling
- Physicochemical interactions with cellular membranes (especially at very high doses)
- Inhibition of mitochondrial calcium cycling
- Rapid suppression of lymphocyte function (relevant to pulse steroid therapy)
4d. Receptor Specificity and Selectivity
| Ligand | GR Affinity | MR Affinity |
|---|---|---|
| Aldosterone | Very low | Very high |
| Cortisol | Moderate | Very high (equal to aldosterone) |
| Dexamethasone | Very high | Very low |
| Fludrocortisone | Low | Very high |
5. SYNTHETIC CORTICOSTEROIDS: POTENCY AND PHARMACOKINETICS
5a. Comparative Potency Table
| Drug | Glucocorticoid Potency | Mineralocorticoid Potency | Plasma t½ | Biological t½ | Equivalent dose |
|---|---|---|---|---|---|
| Hydrocortisone | 1 | 1 | 90 min | 8-12 h | 20 mg |
| Cortisone | 0.8 | 0.8 | 80-100 min | 8-12 h | 25 mg |
| Prednisone | 4 | 0.8 | 60 min | 18-36 h | 5 mg |
| Prednisolone | 4 | 0.8 | 115-200 min | 18-36 h | 5 mg |
| Methylprednisolone | 5 | 0.5 | 180 min | 18-36 h | 4 mg |
| Triamcinolone | 5 | 0 | 200 min | 18-36 h | 4 mg |
| Dexamethasone | 25-30 | ~0 | 200 min | 36-54 h | 0.75 mg |
| Betamethasone | 25-30 | ~0 | 300 min | 36-54 h | 0.6 mg |
| Fludrocortisone | 10 | 125-250 | - | 18-36 h | - |
| Budesonide | High (local) | Very low | Short | Short systemic | - |
5b. Structural Modifications and Their Effects
- Δ1 double bond (prednisone vs cortisone): Reduces susceptibility to 11β-HSD and reduces mineralocorticoid activity
- 9α-fluorination: Dramatically increases both glucocorticoid AND mineralocorticoid activity (basis of fludrocortisone)
- 16-methylation/hydroxylation: Eliminates mineralocorticoid activity (dexamethasone, betamethasone)
- C17-esterification: Increases topical potency and duration
5c. Pharmacokinetics
- Oral bioavailability: Good for most agents (prednisolone >80%, dexamethasone ~78%)
- Prednisone is a prodrug requiring hepatic conversion to prednisolone (active form)
- Cortisone requires conversion to cortisol by 11β-HSD1 (thus should be avoided in severe liver disease)
- IV administration: Hemisuccinate and phosphate esters are water-soluble for IV use; high peak concentrations rapidly achieved
- IM suspensions (acetate, acetonide): Depot formulations with prolonged release
- Topical/inhaled forms absorbed systemically; occlusive dressing markedly increases skin absorption
- After absorption, >90% of cortisol is protein-bound
- Corticosteroid-binding globulin (CBG/transcortin): High affinity (Kd ~1 nM), low capacity - carries majority at physiologic levels
- Albumin: Low affinity (Kd ~1 mM), high capacity - carries excess at high levels
- Only free fraction is biologically active
- At pharmacologic doses, CBG is saturated; free fraction increases disproportionately
- Synthetic corticosteroids (dexamethasone, methylprednisolone) bind CBG poorly - higher free fraction
- Primarily hepatic via CYP enzymes; reduced by ring saturation, hydroxylation, conjugation to glucuronide/sulfate
- Renal excretion of water-soluble conjugates
- Drugs inducing CYP3A4 (rifampicin, phenytoin, phenobarbital, carbamazepine) accelerate metabolism → reduced efficacy
- Ketoconazole inhibits CYP3A4 → increases corticosteroid levels
- Liver disease: Impairs conversion of prednisone to prednisolone; use prednisolone directly
6. PHYSIOLOGICAL AND PHARMACOLOGICAL EFFECTS
6a. Metabolic Effects (Glucocorticoid Actions)
- Stimulates gluconeogenesis (upregulates PEPCK, glucose-6-phosphatase in liver)
- Promotes glycogen synthesis in liver
- Reduces peripheral glucose uptake (insulin antagonism in muscle and fat)
- Net effect: Hyperglycemia - steroid-induced diabetes is a significant clinical complication
- Stimulates protein catabolism in muscle, bone, skin, and connective tissue
- Decreases protein synthesis in non-hepatic tissues
- Increases hepatic amino acid uptake for gluconeogenesis
- Clinical consequences: muscle wasting, poor wound healing, skin atrophy, osteoporosis
- Stimulates lipolysis and increases circulating fatty acids (especially after chronic exposure)
- Redistributes fat: fat deposition in face (moon facies), neck (buffalo hump), and trunk with peripheral wasting
- Increases appetite
- Mechanism: Enhances responsiveness to lipolytic hormones (catecholamines, glucagon)
6b. Anti-Inflammatory Effects
| Cell Type | Factors Inhibited | Mechanism |
|---|---|---|
| Macrophages/Monocytes | IL-1, IL-6, TNF-α, PGs, LTs, acute-phase reactants | Inhibit COX-2 and PLA₂; suppress transcription via NF-kB/AP-1 |
| Endothelial cells | ELAM-1, ICAM-1, IL-1, acute-phase reactants | Reduces leukocyte adhesion and margination |
| Basophils | Arachidonic acid derivatives | - |
| Fibroblasts | Histamine, LTC₄, arachidonic acid metabolites, collagen | Reduce proliferation and IgE-dependent release |
| Lymphocytes | IL-1, IL-2, IL-3, IL-6, TNF-α, GM-CSF, IFN-γ | Broad cytokine suppression |
6c. Immunosuppressive Effects
- Lymphocyte redistribution: Acute administration causes peripheral blood lymphocytopenia (T cells sequestered in lymphoid organs and bone marrow); monocytes and eosinophils also decrease
- Neutrophilia: Glucocorticoids demarginate neutrophils and prolong their circulation (can cause WBC elevation of 2-3x, misleading as infection marker)
- T-cell suppression: Inhibit IL-2 production and T-cell proliferation (primary mechanism at pharmacologic doses)
- B-cell effects: Less direct; suppress antibody production at high doses; do not deplete mature B cells
- NK cell reduction
- Eosinopenia: Useful for allergic/eosinophilic conditions; promotes eosinophil apoptosis
- Inhibit: Delayed-type hypersensitivity, allograft rejection (basis for transplant use), autoimmune disease suppression
6d. Cardiovascular Effects
- Maintain vascular tone and responsiveness to catecholamines/angiotensin II (permissive effect)
- Increase cardiac output
- Sodium and water retention (via residual mineralocorticoid activity or at high doses) → hypertension
- Adrenal insufficiency leads to hypotension, shock - highlights permissive vasopressor role
- Long-term use: Hypertension, accelerated atherosclerosis, dyslipidemia
6e. Pulmonary Effects
- Essential for fetal lung maturation - induce surfactant synthesis (SP-A, SP-B, SP-C, SP-D) in type II pneumocytes
- Clinical use: Antenatal betamethasone (24 mg IM in 2 doses 24 h apart) given at 24-34 weeks gestation in threatened preterm labor reduces neonatal respiratory distress syndrome by ~50%
- Reduce bronchial mucosal edema, secretions, and hyperresponsiveness in asthma
6f. Renal and Electrolyte Effects
- Maintain GFR and water excretion capacity
- Adrenal insufficiency → impaired free water excretion, hyponatremia
- Mineralocorticoid activity → sodium retention, potassium excretion, hydrogen ion excretion
- Net effects at pharmacologic doses (depending on agent): Hypokalemia, metabolic alkalosis, hypertension, edema
6g. Central Nervous System Effects
- Low physiologic levels: Needed for normal mood, memory, and cognitive function
- Excessive levels: Euphoria (early), irritability, insomnia, depression, psychosis (steroid-induced psychiatric disorders - 5-10% of patients on high-dose systemic steroids)
- Elevate seizure threshold in some conditions
- Raised intracranial pressure on withdrawal (pseudotumor cerebri)
- Glucocorticoid receptors (GR) located in frontal cortex, hypothalamus, hippocampus, and cerebellum
- Mineralocorticoid receptors (MR) predominate in limbic system and hippocampus
6h. Musculoskeletal Effects
- Inhibit osteoblast activity and collagen synthesis; increase osteoclast activity → osteoporosis (most important long-term adverse effect)
- Increase urinary calcium excretion; decrease intestinal calcium absorption
- Fracture risk increases with cumulative dose and duration; vertebral and hip fractures most common
- Steroid-induced myopathy: Proximal muscle weakness (type II fiber atrophy) - typically with long-term use or high doses; triamcinolone particularly associated with myopathy
- Avascular necrosis (osteonecrosis) of femoral head: Even short courses at high dose can cause this; mechanism involves fat embolism, vascular thrombosis
6i. Growth and Development
- Suppress growth hormone secretion and action
- Inhibit bone growth directly
- Stunt linear growth in children - important consideration for pediatric dosing (inhaled preferred over systemic)
- Accelerate fetal lung maturation (therapeutically useful)
6j. Adrenal Suppression and HPA Axis
- Exogenous steroids suppress CRH and ACTH via negative feedback
- Degree of suppression depends on: dose, duration, time of day administered, route, potency, and half-life
- Risks of abrupt discontinuation:
- Adrenal insufficiency (fatigue, hypotension, hyponatremia, hypoglycemia)
- Disease flare
- Recovery of HPA axis can take weeks to months after prolonged use
- Alternate-day dosing minimizes HPA suppression while maintaining therapeutic effect (applicable for conditions requiring long-term therapy)
- Morning dosing causes less HPA suppression (aligns with natural cortisol surge)
7. CLINICAL USES
7a. Endocrine Indications (Replacement Therapy)
- Hydrocortisone 15-25 mg/day in divided doses (AM dose 2/3, PM dose 1/3) to mimic diurnal rhythm
- Plus fludrocortisone 0.05-0.2 mg/day for mineralocorticoid replacement
- Stress dosing: 2-3x usual dose during illness, procedure, or surgery
- Glucocorticoid replacement only (mineralocorticoid usually preserved via intact zona glomerulosa)
- Replace cortisol to suppress excess ACTH and reduce androgen overproduction
- Hydrocortisone preferred in children; adult alternatives include prednisone
- Overnight dexamethasone suppression test: 1 mg dexamethasone at 11 PM; cortisol <1.8 μg/dL next morning = normal suppression
7b. Non-Endocrine / Anti-Inflammatory Indications
- RA: Low-dose prednisone ≤10 mg/day as bridge therapy while DMARDs take effect; intra-articular injections for acute flares
- SLE: Variable dosing (low-dose for arthralgias, high-dose/pulse for nephritis, CNS lupus, pneumonitis)
- Polymyalgia rheumatica: Prednisone 15-20 mg/day, taper over 1-2 years
- Giant cell arteritis: Prednisone 40-60 mg/day; IV pulse methylprednisolone if visual symptoms; + tocilizumab to enable faster taper
- Vasculitis, myositis, Sjögren syndrome
- Asthma: Inhaled corticosteroids (ICS) first-line controller; systemic for acute exacerbations (prednisolone 40-50 mg/day x 5-7 days)
- COPD exacerbations: Prednisolone 40 mg/day x 5 days (REDUCE trial)
- Sarcoidosis, hypersensitivity pneumonitis, organizing pneumonia
- COVID-19 with hypoxia: Dexamethasone 6 mg/day x 10 days (RECOVERY trial - 35% reduction in mortality in mechanically ventilated patients)
- Anaphylaxis (adjunct; no immediate effect - epinephrine is primary treatment)
- Severe allergic reactions, angioedema, drug hypersensitivity
- Urticaria, contact dermatitis
- Bacterial meningitis: Dexamethasone 0.15 mg/kg q6h x 4 days (reduces Streptococcus pneumoniae complications, hearing loss)
- Cerebral edema from tumors: Dexamethasone 4-10 mg q6h (best for peritumoral vasogenic edema; less effect in ischemic/traumatic edema)
- Multiple sclerosis acute relapses: IV methylprednisolone 1g/day x 3-5 days accelerates recovery
- Myasthenia gravis (immunosuppression)
- Duchenne muscular dystrophy: Deflazacort (less weight gain) or prednisone 0.75 mg/kg/day
- IBD: Prednisone for flares; budesonide (controlled release) for mild-moderate Crohn's and UC (lower systemic effects due to high first-pass)
- Autoimmune hepatitis
- Alcoholic hepatitis: Prednisolone 40 mg/day (Maddrey score >32 or encephalopathy)
- Nephrotic syndrome (minimal change disease): Prednisone 1 mg/kg/day - induces remission in >90%
- Lupus nephritis, vasculitis, rapidly progressive GN
- Key component of immunosuppression protocols; attempts at steroid-free protocols ongoing
- ITP: Prednisone 1 mg/kg/day first-line
- Autoimmune hemolytic anemia
- Hodgkin's lymphoma (MOPP/ABVD protocols include prednisone)
- Multiple myeloma (dexamethasone is key component of induction regimens)
- ALL induction therapy
- Pemphigus vulgaris, bullous pemphigoid
- Severe psoriasis (systemic - use with caution due to rebound), eczema
- Topical agents: Classified by potency (Class I-VII), used for eczema, psoriasis, lichen planus
- Uveitis, allergic conjunctivitis, severe optic neuritis
- Betamethasone 12 mg IM x 2 doses (24 h apart) at 24-34 weeks for threatened preterm labor → reduces RDS, IVH, NEC
7c. Routes of Administration
| Route | Indications | Examples |
|---|---|---|
| Oral | Most chronic inflammatory conditions | Prednisone, prednisolone, dexamethasone |
| IV | Acute severe illness, pulse therapy | Methylprednisolone (Solu-Medrol), hydrocortisone |
| IM | Adrenal crisis, when IV impossible | Hydrocortisone hemisuccinate |
| IM depot | Inflammatory arthritis, allergy | Triamcinolone acetonide, methylprednisolone acetate |
| Intra-articular | Acute synovitis, crystal arthritis | Triamcinolone, methylprednisolone |
| Inhaled | Asthma, COPD | Budesonide, fluticasone, beclomethasone, mometasone |
| Intranasal | Allergic rhinitis | Fluticasone, mometasone, budesonide |
| Topical skin | Dermatitis, psoriasis | Hydrocortisone (Class VII) to clobetasol (Class I) |
| Ophthalmic | Uveitis, conjunctivitis | Prednisolone, dexamethasone eye drops |
| Epidural | Radiculopathy, spinal stenosis | Triamcinolone, methylprednisolone |
| Rectal | IBD | Hydrocortisone enemas/foam |
8. ADVERSE EFFECTS
8a. Metabolic
- Hyperglycemia / steroid-induced diabetes: Screen fasting glucose; monitor especially in pre-diabetic and diabetic patients
- Dyslipidemia: Elevated triglycerides, LDL; reduced HDL
- Central obesity, moon facies, buffalo hump: Redistribution of adipose tissue
- Negative nitrogen balance, muscle wasting
8b. Musculoskeletal
- Osteoporosis: Risk increases with >7.5 mg/day prednisone equivalent; give calcium + vitamin D with any expected treatment >3 months; bisphosphonates for prolonged use
- Avascular necrosis (osteonecrosis): Femoral head most common; unpredictable - even short courses
- Proximal myopathy: Weakness of hip and shoulder girdle; non-fluorinated agents preferred for myopathy-prone patients
8c. Endocrine / HPA Suppression
- Secondary adrenal insufficiency on abrupt withdrawal - taper all prolonged courses
- Growth retardation in children
- Menstrual irregularities
8d. Immunologic
- Increased infection risk: Bacterial (including reactivation TB - screen with IGRA/TST), fungal (Candida, Aspergillus, Pneumocystis jirovecii - prophylaxis with TMP-SMX if dose >20 mg/day for >4 weeks), viral (VZV reactivation)
- Suppressed fever response - can mask signs of serious infection
- Impaired wound healing
8e. Cardiovascular
- Hypertension
- Sodium and fluid retention (especially with mineralocorticoid-active agents)
- Hypokalemia, metabolic alkalosis
- Increased thrombotic risk
8f. Gastrointestinal
- Peptic ulcer disease / GI bleeding - risk highest with concomitant NSAIDs; prescribe gastroprotection (PPI) when combined
- Pancreatitis (rare)
- Fatty liver
8g. Ocular
- Posterior subcapsular cataracts (dose- and duration-related; unique to corticosteroids among anti-inflammatory drugs)
- Open-angle glaucoma (increased IOP; monitor IOP in predisposed patients)
- Scleromalacia
8h. Neuropsychiatric
- Insomnia (common, especially with evening dosing)
- Mood changes: euphoria, irritability, anxiety
- Steroid psychosis (5-10% with high doses: ≥40 mg/day prednisone equivalent)
- Cognitive impairment with chronic use
8i. Dermatologic
- Skin atrophy, striae, telangiectasias
- Impaired wound healing
- Acne, hirsutism
- Purpura
- Topical corticosteroids: Tachyphylaxis, skin atrophy, perioral dermatitis, steroid rosacea, hypopigmentation (especially in darker skin)
9. CORTICOSTEROID DOSING PRINCIPLES
9a. Dosing Regimens
| Strategy | Clinical Use | Advantage |
|---|---|---|
| Daily single morning dose | Most oral therapy | Mimics diurnal rhythm; less HPA suppression |
| Divided daily doses | Severe active disease | Better disease control |
| Alternate-day dosing (QOD) | Long-term maintenance | Minimizes HPA suppression and adverse effects |
| Pulse therapy | Lupus nephritis, MS relapse, transplant rejection | Very high dose IV x 3-5 days; rapid effect |
| Physiologic replacement | Adrenal insufficiency | Replaces normal daily output |
9b. Tapering
- Any patient on systemic steroids for >2-3 weeks needs a taper to avoid adrenal insufficiency
- Typical approach: Reduce by 10-20% every 1-2 weeks; slow further as dose approaches physiologic range (~5 mg prednisone equivalent)
- Monitor for steroid withdrawal syndrome: Fatigue, arthralgias, myalgias, headache - distinct from adrenal insufficiency but can overlap
- Stress dosing during surgery or illness required if still on steroids or for 12 months after stopping if prolonged course was used
10. PHARMACOLOGICAL INHIBITORS OF THE HPA AXIS / STEROIDOGENESIS
| Drug | Mechanism | Use |
|---|---|---|
| Ketoconazole | Inhibits CYP17A1, CYP11B1; multiple steps | Cushing syndrome (off-label) |
| Metyrapone | Inhibits CYP11B1 (11β-hydroxylase) | Cushing diagnosis (metyrapone test) and treatment |
| Mitotane | Inhibits 11β-hydroxylation; adrenolytic | Adrenocortical carcinoma |
| Etomidate | Inhibits CYP11B1 | ICU Cushing (IV form) |
| Osilodrostat | Inhibits CYP11B1 | Cushing's disease (FDA-approved 2020) |
| Mifepristone (RU-486) | GR antagonist | Type 2 DM/hyperglycemia in Cushing |
| Spironolactone / Eplerenone | MR antagonist | Hyperaldosteronism, heart failure |
| Pasireotide | Somatostatin analogue; inhibits ACTH | Cushing's disease |
| Cabergoline | Dopamine agonist; inhibits ACTH | Cushing's disease (adjunct) |
11. SPECIAL POPULATIONS
Pregnancy
- Prednisone/prednisolone preferred (placental 11β-HSD2 converts ~90% to inactive prednisolone, limiting fetal exposure)
- Dexamethasone and betamethasone cross placenta readily (used intentionally for fetal lung maturation)
- Fetal effects: Palatal clefts (first trimester; risk is small but documented), intrauterine growth restriction, neonatal adrenal suppression with prolonged high-dose use
Renal impairment
- No major dose adjustment needed; prednisolone preferred (not dependent on renal excretion)
Hepatic impairment
- Avoid prednisone and cortisone (require hepatic activation); use prednisolone and hydrocortisone directly
Elderly
- Higher risk of all adverse effects: Osteoporosis, diabetes, cataract, hypertension, infection, psychiatric effects
- Bone protection mandatory even at lower doses and shorter durations
Pediatric
- Prefer inhaled/topical where possible
- When systemic needed: Use lowest effective dose; alternate-day preferred for chronic use; monitor growth
12. DRUG INTERACTIONS
| Interaction | Mechanism | Clinical Consequence |
|---|---|---|
| NSAIDs | Additive GI toxicity | Peptic ulcer/GI bleed ↑↑ - give PPI |
| Rifampicin, phenytoin, carbamazepine | CYP3A4 induction | Increased steroid metabolism → reduced effect |
| Ketoconazole, itraconazole | CYP3A4 inhibition | Increased steroid levels → toxicity |
| Oral hypoglycemics / insulin | Antagonism | Hyperglycemia - increase antidiabetic dosing |
| Antihypertensives | Mineralocorticoid-induced fluid retention | Reduced efficacy of antihypertensives |
| Diuretics | Additive hypokalemia | Monitor K⁺ carefully |
| Live vaccines | Immunosuppression | Contraindicated in patients on >20 mg/day prednisone |
| Warfarin | Variable (can increase or decrease INR) | Monitor INR closely |
| Ciclosporin | CYP3A4 competition | Altered levels of both drugs |
13. CLINICAL MONITORING ON CORTICOSTEROID THERAPY
- Baseline and periodic: Blood pressure, weight, blood glucose (fasting), lipid profile, BMP (potassium, sodium), BMD (DXA scan)
- Eyes: Intraocular pressure, slit lamp examination annually
- Bone protection: Calcium 1000-1200 mg/day + Vitamin D 800-1000 IU/day for all; add bisphosphonate (alendronate/risedronate/zoledronic acid) if T-score < -1.5 or high fracture risk
- GI protection: PPI if also taking NSAIDs or if other risk factors for PUD
- Infection screening: IGRA/TST before starting (treat latent TB if positive); PJP prophylaxis if high dose >4 weeks; screen hepatitis B
- HPA axis: Consider morning cortisol or ACTH stimulation test before stopping prolonged courses; do stress dosing card
- Glucocorticoids act primarily through nuclear GR → transcription modulation (genomic, slow) plus rapid non-genomic effects at high doses
- The 11β-HSD1/2 system controls tissue-specific activation/inactivation - key to mineralocorticoid selectivity and prodrug activation
- Synthetic modifications (especially 9α-F, 16-methylation, Δ1 bond) tune potency and selectivity
- HPA axis suppression is the most dangerous consequence of abrupt discontinuation - always taper
- Osteoporosis and infection are the most clinically significant long-term complications
- Route of administration, agent choice, and dosing schedule can minimize side effects