
metabolism of cortsiol inckuding salibvary ,kidney and liver
cortisol metabolism liver kidney salivary gland 11beta-HSD biochemistry
cortisol metabolism 11beta-HSD liver kidney pathway diagram
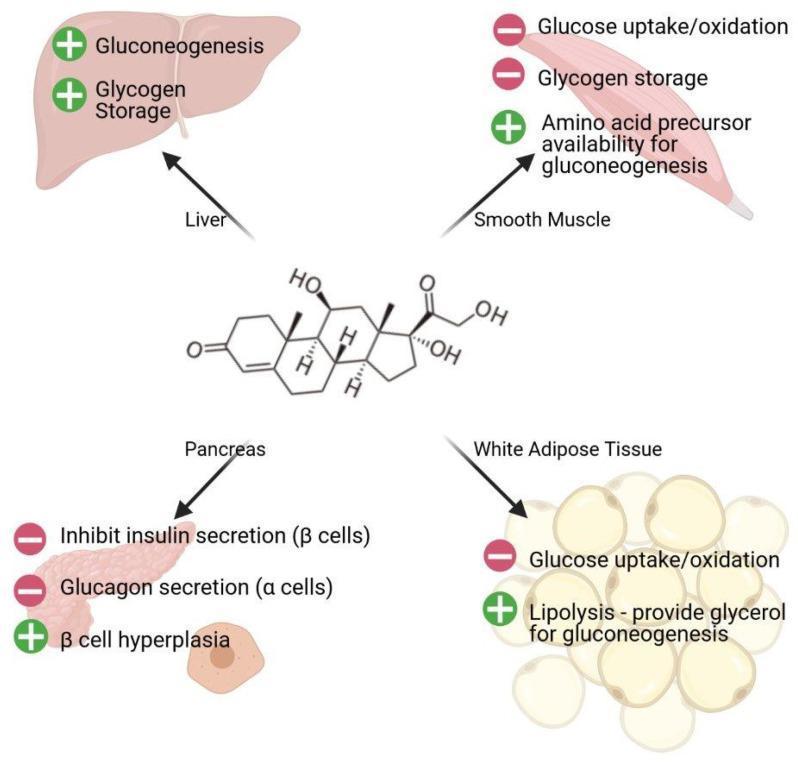
This pathophysiology diagram illustrates the systemic effects of cortisol on glucose metabolism across various human tissues. At the center is the chemical steroid structure of cortisol, with arrows indicating its multi-organ impact. 1) Liver: Shows increased (+) gluconeogenesis and glycogen storage. 2) Smooth Muscle: Depicts decreased (-) glucose uptake/oxidation and glycogen storage, but increased (+) amino acid precursor availability for gluconeogenesis. 3) Pancreas: Illustrates inhibition (-) of insulin secretion from beta cells and glucagon secretion from alpha cells, alongside induced (+) beta cell hyperplasia. 4) White Adipose Tissue: Shows decreased (-) glucose uptake/oxidation and increased (+) lipolysis, which provides glycerol for hepatic gluconeogenesis. The visual summarizes the hormonal role of glucocorticoids in mobilizing energy substrates and maintaining blood glucose levels, often associated with the metabolic response to stress. This educational material is suitable for students of endocrinology and metabolic physiology.
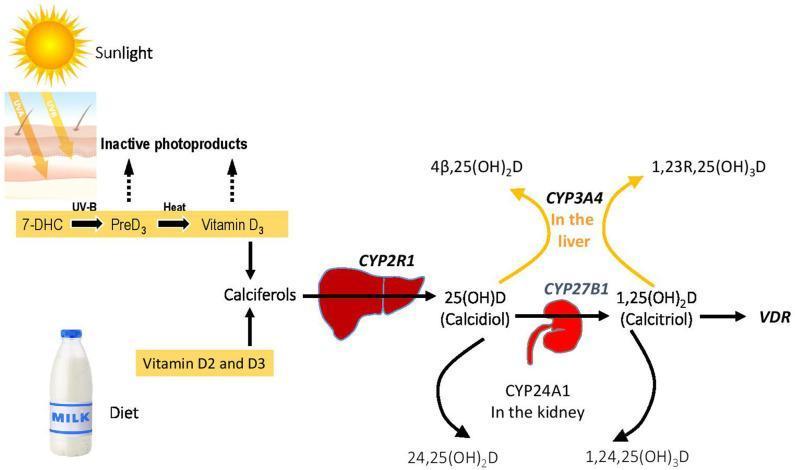
This pathophysiology diagram illustrates the metabolic pathway of Vitamin D homeostasis and its associated genetic enzymes. The process begins with two sources: endogenous synthesis in the skin via Sunlight (UV-B) converting 7-DHC to PreD3 and then to Vitamin D3 (Cholecalciferol) through heat, and dietary intake (Vitamin D2 and D3). These converge into 'Calciferols'. The primary activation pathway shows the liver enzyme CYP2R1 hydroxylating calciferols into 25(OH)D (Calcidiol). This metabolite then moves to the kidney, where CYP27B1 converts it to the active form, 1,25(OH)2D (Calcitriol), which binds to the Vitamin D Receptor (VDR). The diagram also highlights catabolic inactivation pathways: in the kidney, CYP24A1 converts 25(OH)D and 1,25(OH)2D into inactive products (24,25(OH)2D and 1,24,25(OH)3D respectively). In the liver, CYP3A4 facilitates an alternative inactivation route, producing 4β,25(OH)2D and 1,23R,25(OH)3D. Key genes involved in Vitamin D-Dependent Rickets (VDDR) are highlighted in bold, emphasizing the clinical significance of these enzymatic steps in mineral metabolism.
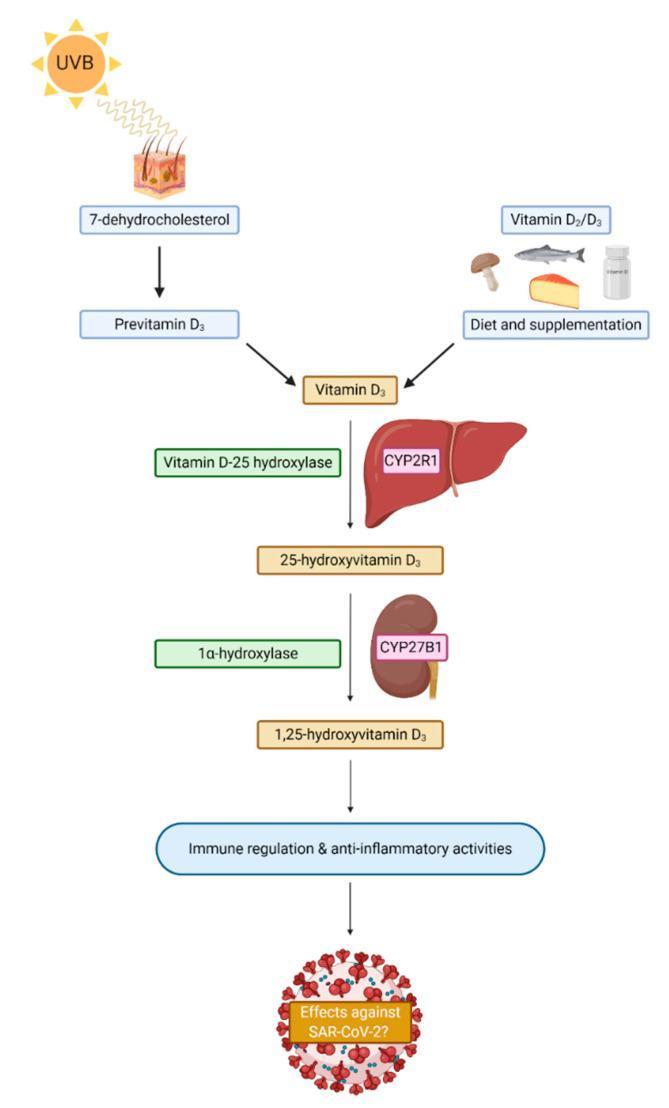
This pathophysiology diagram illustrates the metabolic pathway of Vitamin D synthesis and activation in humans, emphasizing its role in immune modulation. The flow begins with two primary sources: endogenous synthesis in the skin (UVB radiation converting 7-dehydrocholesterol to Previtamin D3 and subsequently Vitamin D3) and exogenous intake (dietary sources like fish, eggs, and mushrooms or supplementation). The pathway then details the two-step hydroxylation process: first in the liver, where Vitamin D-25 hydroxylase (CYP2R1) converts Vitamin D3 into 25-hydroxyvitamin D3; and second in the kidney, where 1α-hydroxylase (CYP27B1) converts it into the bioactive form, 1,25-dihydroxyvitamin D3. The diagram concludes by highlighting the clinical significance of active Vitamin D in promoting immune regulation and anti-inflammatory activities, specifically questioning its potential protective effects against SARS-CoV-2. This schematic serves as an educational tool for understanding endocrine metabolism and its systemic physiological impacts.
Educational infographics depicting metabolic pathway analysis in a liver fibrosis model. Panel C presents a detailed pathophysiology diagram of regulated metabolic networks. Metabolites are color-coded by pathway: green for taurine and hypotaurine metabolism; light blue for arginine and proline; yellow for tryptophan; orange for phenylalanine; purple for sphingolipids; and pink for primary bile acid biosynthesis. Key metabolic conversions connect substances like cholesterol, primary bile acids, and taurine, illustrating the cross-talk between the TCA cycle and amino acid metabolism. White boxes indicate undetected metabolites. Panel D shows a circular metabolic network graph where individual metabolites are represented as nodes. The nodes are interconnected by gray lines representing functional relationships. A color scale indicates the uncorrected p-value (ranging from blue/0.7 to red/0), and node size reflects the magnitude of the measured value. This visual set demonstrates how experimental treatments influence specific metabolic signatures in hepatic disease research.
cortisol cortisone interconversion 11-beta hydroxysteroid dehydrogenase salivary gland kidney mineralocorticoid receptor
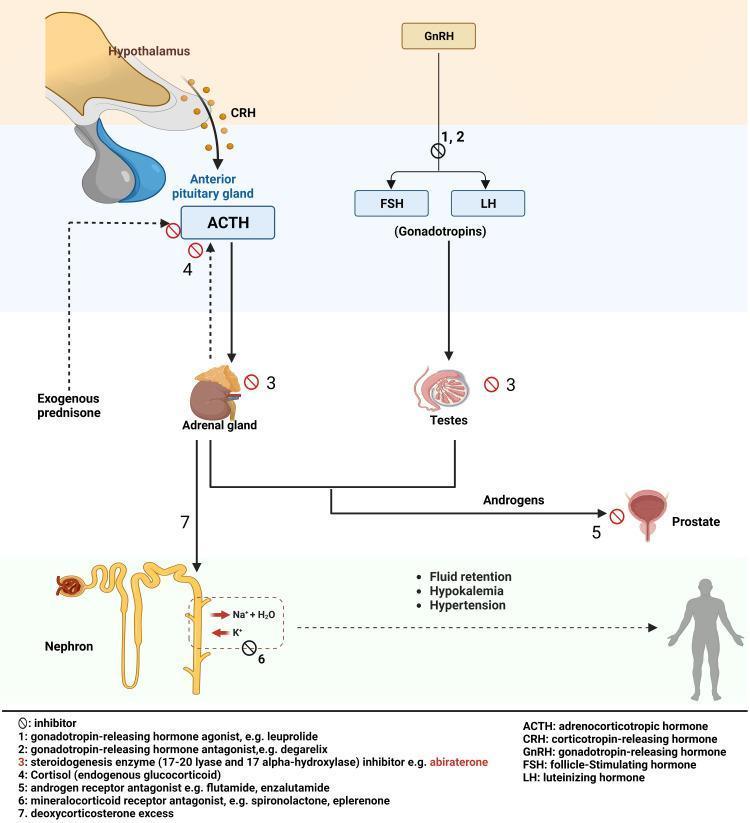
A comprehensive medical diagram illustrating the hypothalamic-pituitary-adrenal (HPA) and hypothalamic-pituitary-gonadal (HPG) axes, detailing the mechanism of action for prostate cancer pharmacotherapies. The illustration shows the hypothalamus releasing CRH and GnRH, which stimulate the anterior pituitary gland to secrete ACTH and gonadotropins (FSH/LH), respectively. These hormones target the adrenal glands and testes to produce androgens and cortisol. Key pharmacological interventions are indicated by inhibitory icons: abiraterone (inhibiting CYP17A1), exogenous prednisone (providing negative feedback to suppress ACTH), degarelix (GnRH antagonist), and androgen receptor antagonists like enzalutamide acting on the prostate. A central focus is the pathophysiology of secondary mineralocorticoid excess: the diagram traces how inhibition of steroidogenesis leads to deoxycorticosterone accumulation, affecting the nephron. Visible renal outcomes include sodium and water retention, potassium excretion (hypokalemia), and clinical hypertension. The diagram includes a legend identifying mineralocorticoid receptor antagonists (spironolactone/eplerenone) as agents used to mitigate these electrolyte imbalances.
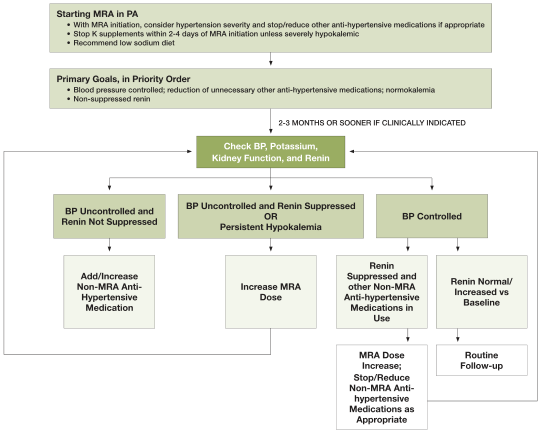
Summary : This flowchart outlines the clinical management process for starting mineralocorticoid receptor antagonist (MRA) therapy in patients with primary aldosteronism (PA), focusing on blood pressure, potassium, kidney function, and renin monitoring, and subsequent medication adjustments. flowchart: # Nodes : • Starting MRA in PA (rectangle): With MRA initiation, consider hypertension severity and stop/reduce other anti-hypertensive medications if appropriate; stop K supplements within 2–4 days of MRA initiation unless severely hypokalemic; recommend low sodium diet. • Primary Goals, in Priority Order (rectangle): Blood pressure controlled; reduction of unnecessary other anti-hypertensive medications; normokalemia; non-suppressed renin. • Check BP, Potassium, Kidney Function, and Renin (rectangle): 2–3 months or sooner if clinically indicated. • BP Uncontrolled and Renin Not Suppressed (rectangle): Add/Increase Non-MRA Anti-Hypertensive Medication. • BP Uncontrolled and Renin Suppressed OR Persistent Hypokalemia (rectangle): Increase MRA Dose. • BP Controlled (rectangle): Branches into two sub-nodes: – Renin Suppressed and other Non-MRA Anti-hypertensive Medications in Use (rectangle): MRA Dose Increase; Stop/Reduce Non-MRA Anti-hypertensive Medications as Appropriate. – Renin Normal/Increased vs Baseline (rectangle): Routine Follow-up. # Connectors : • Downward arrows connect each step in the process, starting from "Starting MRA in PA" to "Primary Goals" to "Check BP, Potassium, Kidney Function, and Renin". • From "Check BP, Potassium, Kidney Function, and Renin", three branches lead to: – "BP Uncontrolled and Renin Not Suppressed" – "BP Uncontrolled and Renin Suppressed OR Persistent Hypokalemia" – "BP Controlled" • "BP Controlled" further branches into two sub-nodes based on renin status. # Layout : • Vertical flow from top (starting MRA) to bottom (medication adjustment/follow-up). • At the decision point (Check BP, Potassium, Kidney Function, and Renin), the flow splits horizontally into three main branches, with the rightmost branch further splitting into two sub-branches. # Analysis : • The flowchart provides a structured approach for clinicians to titrate MRA therapy and other anti-hypertensive medications based on blood pressure control, renin levels, and potassium status. • The process prioritizes blood pressure control, minimizing unnecessary medications, and achieving normokalemia and non-suppressed renin. • Decision points are clearly defined, allowing for tailored adjustments in therapy and follow-up based on patient response. • The chart emphasizes regular monitoring and timely intervention to optimize outcomes in PA management.
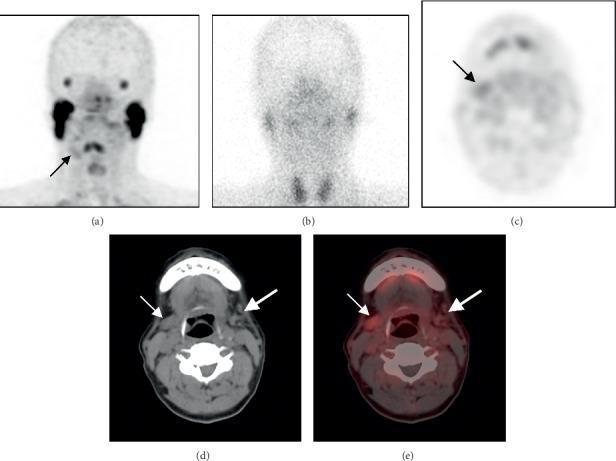
Comparison of salivary gland imaging using 68Ga-PSMA-11 PET/CT and 99mTcO4− salivary gland scintigraphy (SGS) in a 64-year-old male with post-radiotherapy nasopharyngeal carcinoma. Panel (a) shows a Maximum Intensity Projection (MIP) image where a slight tracer uptake is noted in the right submandibular gland (small arrow, SUVmax 2.6). Panel (b) depicts planar SGS with absent tracer uptake in bilateral submandibular glands, indicating severe functional impairment. Panels (c-e) provide tomographic axial views (PET, CT, and fused PET/CT) illustrating morphological and functional asymmetry. There is a significant reduction in the volume (atrophy) of the left submandibular gland (large arrow, SUVmax 1.9) compared to the right. The diagnostic images demonstrate the superior sensitivity and anatomical resolution of 68Ga-PSMA-11 PET/CT over SGS in evaluating glandular atrophy and residual functional metabolic activity in salivary glands following radiotherapy.
Cortisol Metabolism: Complete Overview
1. Overview and Circulation
- Guyton and Hall Textbook of Medical Physiology, pp. 950-954
- Goldman-Cecil Medicine, p. 443
2. The Central Mechanism: 11β-Hydroxysteroid Dehydrogenase (11β-HSD)
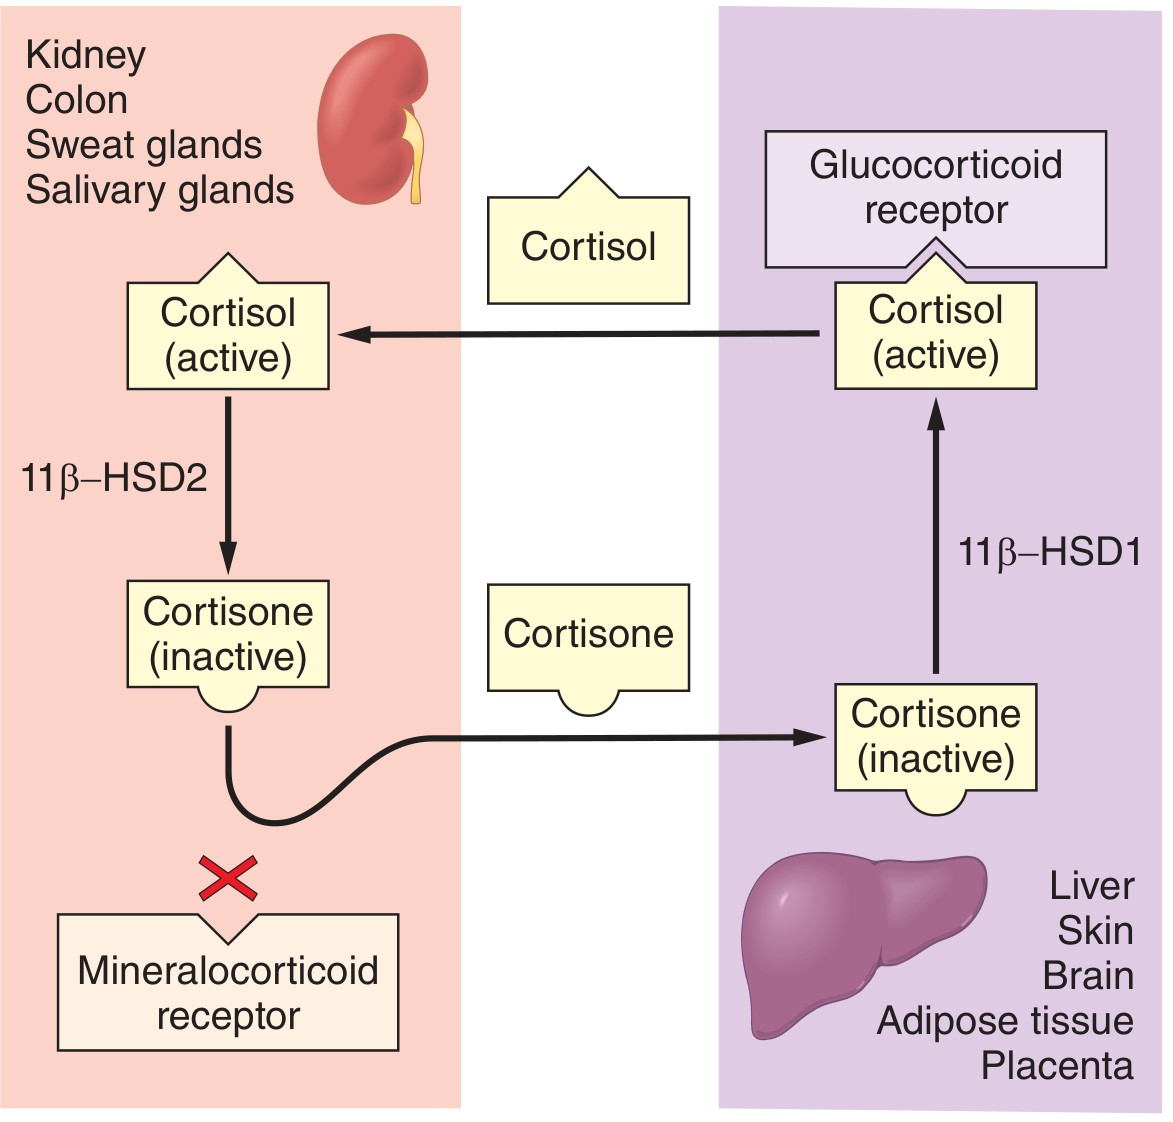
| Feature | 11β-HSD Type 1 | 11β-HSD Type 2 |
|---|---|---|
| Direction | Cortisone → Cortisol (reductase) | Cortisol → Cortisone (dehydrogenase) |
| Cofactor | NADPH-dependent | NAD⁺-dependent |
| Effect on cortisol | Activates / amplifies | Inactivates / protects |
| Tissues | Liver, adipose tissue, brain, skin, skeletal muscle, lung | Kidney, colon, salivary glands, sweat glands, placenta |
| Clinical role | Amplifies glucocorticoid action locally | Protects mineralocorticoid receptor from cortisol |
- Guyton and Hall, pp. 953-954
3. Liver Metabolism
A. 11β-HSD1 (Activation)
- Gluconeogenesis: Cortisol upregulates transcription of gluconeogenic enzymes (PEPCK, glucose-6-phosphatase). This can increase hepatic glucose output 6- to 10-fold.
- Glycogen storage: Increased hepatic glycogen deposition.
- Protein catabolism substrate supply: Mobilized amino acids from peripheral tissues are taken up by the liver for gluconeogenesis.
B. Hepatic Conjugation and Excretion (Terminal Catabolism)
- Reduction: Ring A of cortisol is reduced by 5α-reductase and 5β-reductase, producing tetrahydrocortisol (THF) and allo-THF (5α-THF).
- Cortisone pathway: Cortisol → cortisone (via 11β-HSD2 in kidney) → tetrahydrocortisone (THE) via hepatic 5β-reductase and 3α-HSD.
- Glucuronide/sulfate conjugation: THF, allo-THF, and THE are conjugated with glucuronic acid (primarily) in the liver, making them water-soluble.
- Urinary excretion: These conjugates (collectively "urinary free cortisol metabolites") are excreted in urine.
The ratio (THF + allo-THF) : THE in urine reflects hepatic 11β-HSD1 activity. Elevated hepatic 11β-HSD1 (as in obesity) skews this ratio.
- Biochemistry, Lippincott 8th ed, pp. 664-665
- Goldman-Cecil Medicine
4. Kidney Metabolism
11β-HSD2 - The Mineralocorticoid Gatekeeper
- The mineralocorticoid receptor (MR) has equal affinity for both cortisol and aldosterone.
- Circulating cortisol is ~1000× more abundant than aldosterone.
- Without 11β-HSD2, cortisol would saturate all renal MRs and produce massive sodium retention and hypertension.
- 11β-HSD2 ensures that only aldosterone can activate MRs in the kidney, allowing proper sodium/potassium homeostasis.
Mechanism:
Clinical Correlation - Apparent Mineralocorticoid Excess (AME):
-
Cortisol floods renal MRs → acts like aldosterone
-
Result: severe hypertension, hypokalemia, metabolic alkalosis, suppressed renin/aldosterone
-
Causes: genetic mutations in HSD11B2 gene, or licorice abuse (glycyrrhetinic acid is a suicide substrate for 11β-HSD2)
-
Urinary marker: elevated urinary free cortisol : cortisone (UFF:UFE) ratio - the best indicator of renal 11β-HSD2 activity
-
Guyton and Hall, p. 953; Brenner & Rector's The Kidney, p. 647; Ganong's Review, p. 3287
5. Salivary Gland Metabolism
- Physiological: Protects salivary MRs (which regulate Na⁺/K⁺ transport in saliva) from cortisol excess.
- Diagnostic relevance: Salivary fluid contains both cortisol and cortisone. The salivary cortisol:cortisone ratio reflects local 11β-HSD2 activity. Unlike serum cortisol (which measures bound + free), salivary cortisol measures only free (bioactive) cortisol, making it an excellent non-invasive test for:
- Cushing's syndrome (late-night salivary cortisol is a validated screening test)
- HPA axis activity assessment, especially in children and research settings
- Monitoring cortisol in neonates and during stress studies
When 11β-HSD2 is overwhelmed (e.g., Cushing's with very high cortisol), excess cortisol escapes inactivation in salivary gland tissue, and the salivary cortisol:cortisone ratio rises.
- Guyton and Hall, p. 953; Liverpool salivary biomarker review
6. Metabolic Effects of Cortisol (Summary by Organ)
| Tissue | Effect |
|---|---|
| Liver | ↑ Gluconeogenesis, ↑ glycogen storage, ↑ gluconeogenic enzyme transcription |
| Skeletal muscle | ↓ Glucose uptake (↓ GLUT4), ↑ protein catabolism → amino acids for liver |
| Adipose tissue | ↑ Lipolysis → FFA release, ↓ glucose uptake; central fat redistribution |
| Pancreas | ↓ Insulin sensitivity; ↑ β-cell compensation (chronic) |
| Kidney | Cortisol → cortisone (11β-HSD2); protects MR; regulates ENaC |
| Salivary glands | Cortisol → cortisone (11β-HSD2); free cortisol in saliva = diagnostic biomarker |
| Immune cells | ↓ Prostaglandins, leukotrienes; lysosomal stabilization; ↓ capillary permeability |
- Guyton and Hall, pp. 2053-2071
7. Synthesis and Fate Pathway (Summary)
Cholesterol
    ↓ (StAR, CYP11A1)
Pregnenolone → Progesterone → 17α-OH-Progesterone → 11-Deoxycortisol
    ↓ (CYP11B1 - adrenal)
CORTISOL (active)
    ↓                               ↓
  KIDNEY/SALIVARY (11β-HSD2)     LIVER (11β-HSD1)
  Cortisol → Cortisone            Cortisone → Cortisol (amplification)
       ↓                               ↓
  [MR protected]            5α/5β-reductase + 3α-HSD
                              ↓
              THF / allo-THF (cortisol metabolites)
              THE (cortisone metabolite)
                              ↓
              Glucuronide conjugation (liver)
                              ↓
              Urinary excretion
Key Diagnostic Ratios
| Ratio | Reflects | Used for |
|---|---|---|
| (THF + allo-THF) : THE in urine | Hepatic 11β-HSD1 activity | Obesity, metabolic syndrome research |
| UFF : UFE (urinary free cortisol : cortisone) | Renal 11β-HSD2 activity | AME diagnosis, licorice toxicity |
| Salivary cortisol (free) | HPA axis, free cortisol | Cushing's screening (late-night) |
| Salivary cortisol : cortisone | Salivary gland 11β-HSD2 activity | Research, pediatric stress studies |
can u make a flow chart
A detailed medical flowchart showing cortisol metabolism across different organs. The flowchart starts at the top with "Cholesterol" in the adrenal gland, flowing down through enzymatic steps (StAR, CYP11A1, CYP17, CYP21, CYP11B1) to produce "CORTISOL (Active)" in the zona fasciculata. From cortisol, the chart branches into three parallel pathways going left, center-right, and right: LEFT BRANCH - labeled "KIDNEY, SALIVARY GLANDS, Colon, Sweat Glands": Cortisol is acted on by 11β-HSD2 (NAD+ dependent, oxidase) → produces Cortisone (Inactive) → this PROTECTS Mineralocorticoid Receptor (MR) from cortisol → shown with a red X blocking MR activation. Note: "Only aldosterone activates MR". Clinical box: "If 11β-HSD2 deficient → AME: hypertension, hypokalemia. Licorice (glycyrrhetinic acid) inhibits 11β-HSD2" CENTER-RIGHT BRANCH - labeled "LIVER (primary catabolism)": Cortisol → 5α-reductase / 5β-reductase → Dihydrocortisol → 3α-HSD → Tetrahydrocortisol (THF) and allo-THF. Also: Cortisone → 5β-reductase → Tetrahydrocortisone (THE). Both THF/allo-THF and THE → Glucuronide conjugation (liver) → Urinary excretion. Diagnostic ratio box: "(THF + allo-THF) : THE = hepatic 11β-HSD1 activity" RIGHT BRANCH - labeled "LIVER, ADIPOSE, BRAIN, SKIN": Cortisone (inactive) → 11β-HSD1 (NADPH dependent, reductase) → Cortisol (active) → Glucocorticoid Receptor (GR) → Metabolic effects box listing: "↑ Gluconeogenesis, ↑ Glycogen storage, ↑ Protein catabolism, ↑ Lipolysis, ↓ Immune response" SALIVARY box at bottom: "Salivary Cortisol = FREE cortisol only → Diagnostic use: Late-night salivary cortisol for Cushing's screening. Salivary cortisol:cortisone ratio = 11β-HSD2 activity" Use color coding: yellow for cortisol, grey for cortisone, green for active states, red for blocked pathways. Clean professional medical diagram style with clear arrows and labeled boxes.
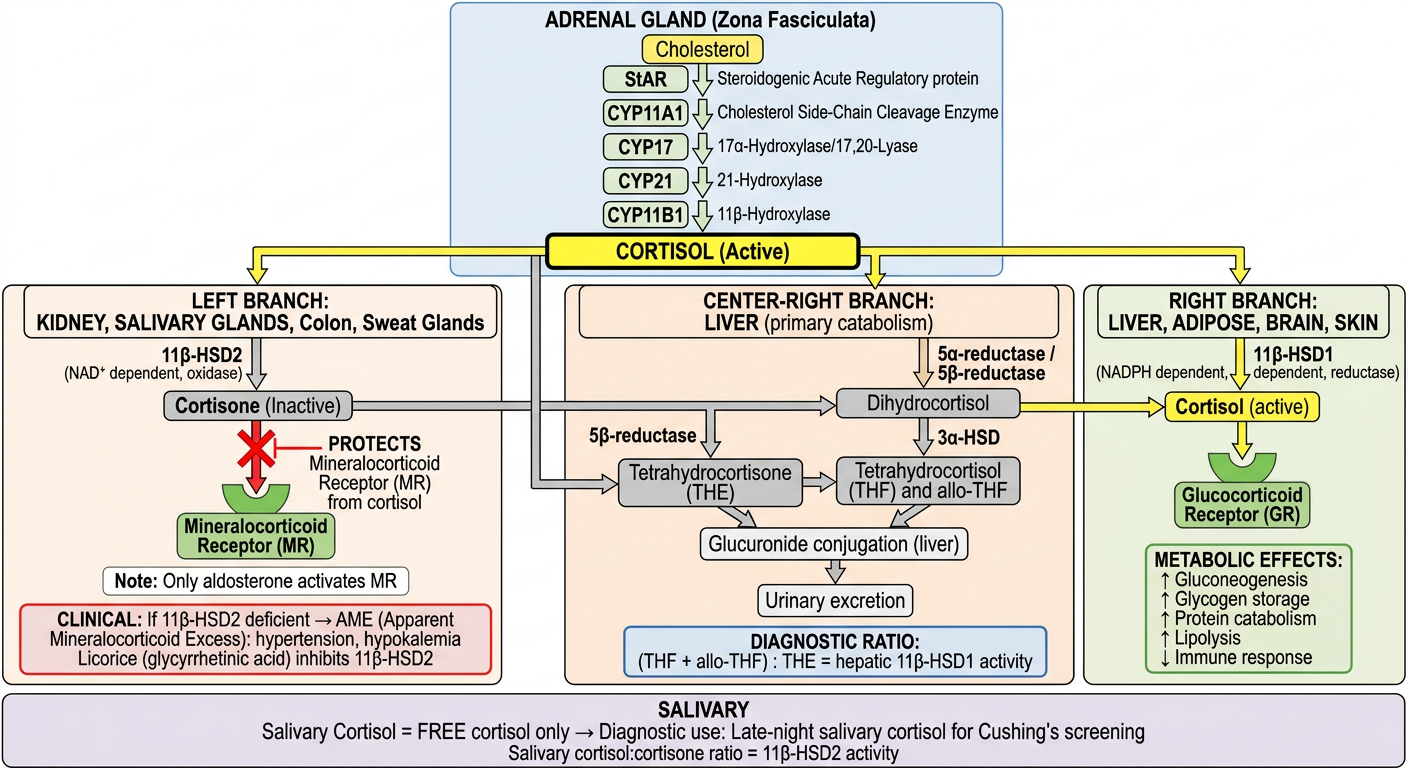
- Top: Synthesis from cholesterol in the adrenal cortex (zona fasciculata) through the CYP enzyme cascade
- Left branch: Kidney, salivary glands, colon, and sweat glands - where 11β-HSD2 converts cortisol → inactive cortisone, protecting the mineralocorticoid receptor (with the AME/licorice clinical note)
- Center branch: Hepatic catabolism through 5α/5β-reductase and 3α-HSD producing THF, allo-THF, and THE, followed by glucuronide conjugation and urinary excretion
- Right branch: Liver, adipose, brain - where 11β-HSD1 reactivates cortisone → cortisol, amplifying glucocorticoid effects via the glucocorticoid receptor
- Bottom: Salivary cortisol as a free-cortisol biomarker for Cushing's screening
no i want a simple one and in a ppt and all th ereferbces '
mkdir -p /tmp/workspace/cortisol-ppt && ls /tmp/workspace/cortisol-ppt/
~/cortisol-ppt/build_ppt.py
from pptx import Presentation
from pptx.util import Inches, Pt, Emu
from pptx.dml.color import RGBColor
from pptx.enum.text import PP_ALIGN, MSO_ANCHOR
from pptx.util import Inches, Pt
import copy

prs = Presentation()
prs.slide_width  = Inches(13.333)
prs.slide_height = Inches(7.5)
blank = prs.slide_layouts[6]

# ── Colour palette ──────────────────────────────────────────────
C_TITLE_BG   = RGBColor(0x1A, 0x3A, 0x5C)   # dark navy
C_TITLE_FG   = RGBColor(0xFF, 0xFF, 0xFF)
C_ACCENT     = RGBColor(0xF0, 0x A0, 0x00)   # amber accent bar
C_BOX_YELLOW = RGBColor(0xFF, 0xF0, 0xB0)    # cortisol box
C_BOX_GREY   = RGBColor(0xE0, 0xE0, 0xE0)    # cortisone box
C_BOX_GREEN  = RGBColor(0xC8, 0xE6, 0xC9)    # active/effect box
C_BOX_RED    = RGBColor(0xFF, 0xCC, 0xCC)    # AME/clinical box
C_BOX_BLUE   = RGBColor(0xBB, 0xDE, 0xFB)    # salivary / diag box
C_BOX_BORDER = RGBColor(0x33, 0x33, 0x33)
C_ARROW      = RGBColor(0x33, 0x33, 0x33)
C_REF_BG     = RGBColor(0xF5, 0xF5, 0xF5)
C_REF_TXT    = RGBColor(0x44, 0x44, 0x44)
C_WHITE      = RGBColor(0xFF, 0xFF, 0xFF)

# ── Helper: add a filled rectangle with centred text ────────────
def add_box(slide, x, y, w, h, fill_rgb, text, font_size=13,
            bold=False, font_rgb=RGBColor(0x11,0x11,0x11),
            border_rgb=C_BOX_BORDER, border_pt=1.0):
    shape = slide.shapes.add_shape(
        1,  # MSO_SHAPE_TYPE.RECTANGLE
        Inches(x), Inches(y), Inches(w), Inches(h)
    )
    shape.fill.solid()
    shape.fill.fore_color.rgb = fill_rgb
    shape.line.color.rgb = border_rgb
    shape.line.width = Pt(border_pt)
    tf = shape.text_frame
    tf.word_wrap = True
    tf.vertical_anchor = MSO_ANCHOR.MIDDLE
    p = tf.paragraphs[0]
    p.alignment = PP_ALIGN.CENTER
    run = p.add_run()
    run.text = text
    run.font.size = Pt(font_size)
    run.font.bold = bold
    run.font.color.rgb = font_rgb
    return shape

# ── Helper: add arrow (connector line with arrowhead) ───────────
def add_arrow(slide, x1, y1, x2, y2):
    from pptx.oxml.ns import qn
    from lxml import etree
    cx = int((x2 - x1) * 914400)
    cy = int((y2 - y1) * 914400)
    sp_tree = slide.shapes._spTree
    xml = f"""
    <p:cxnSp xmlns:p="http://schemas.openxmlformats.org/presentationml/2006/main"
             xmlns:a="http://schemas.openxmlformats.org/drawingml/2006/main"
             xmlns:r="http://schemas.openxmlformats.org/officeDocument/2006/relationships">
      <p:nvCxnSpPr>
        <p:cNvPr id="99" name="Arrow"/>
        <p:cNvCxnSpPr/>
        <p:nvPr/>
      </p:nvCxnSpPr>
      <p:spPr>
        <a:xfrm>
          <a:off x="{int(x1*914400)}" y="{int(y1*914400)}"/>
          <a:ext cx="{cx}" cy="{cy}"/>
        </a:xfrm>
        <a:prstGeom prst="straightConnector1"><a:avLst/></a:prstGeom>
        <a:ln w="25400">
          <a:solidFill><a:srgbClr val="333333"/></a:solidFill>
          <a:headEnd type="none"/>
          <a:tailEnd type="arrow" w="med" len="med"/>
        </a:ln>
      </p:spPr>
    </p:cxnSp>"""
    sp_tree.append(etree.fromstring(xml))

# ── Helper: slide-wide background ────────────────────────────────
def set_bg(slide, rgb):
    from pptx.oxml.ns import qn
    from lxml import etree
    bg = slide.background
    fill = bg.fill
    fill.solid()
    fill.fore_color.rgb = rgb

# ── Helper: text label (no box) ─────────────────────────────────
def add_label(slide, x, y, w, h, text, size=11, bold=False,
              align=PP_ALIGN.CENTER, rgb=RGBColor(0x33,0x33,0x33)):
    tb = slide.shapes.add_textbox(Inches(x), Inches(y), Inches(w), Inches(h))
    tf = tb.text_frame
    tf.word_wrap = True
    tf.vertical_anchor = MSO_ANCHOR.MIDDLE
    p = tf.paragraphs[0]
    p.alignment = align
    run = p.add_run()
    run.text = text
    run.font.size = Pt(size)
    run.font.bold = bold
    run.font.color.rgb = rgb

# ══════════════════════════════════════════════════════════════════
# SLIDE 1 — Title slide
# ══════════════════════════════════════════════════════════════════
s1 = prs.slides.add_slide(blank)
set_bg(s1, RGBColor(0xF7, 0xF9, 0xFF))

# navy header bar
hdr = s1.shapes.add_shape(1, Inches(0), Inches(0), Inches(13.333), Inches(2.2))
hdr.fill.solid(); hdr.fill.fore_color.rgb = C_TITLE_BG
hdr.line.fill.background()

add_label(s1, 0.3, 0.25, 12.7, 1.1,
          "CORTISOL METABOLISM", size=40, bold=True, rgb=C_TITLE_FG)
add_label(s1, 0.3, 1.3, 12.7, 0.7,
          "Liver  |  Kidney  |  Salivary Glands  |  Peripheral Tissues",
          size=18, rgb=RGBColor(0xBB, 0xCC, 0xFF))

add_label(s1, 1.5, 2.5, 10, 0.5,
          "Cortisol is secreted by the zona fasciculata of the adrenal cortex in response to ACTH.",
          size=14, rgb=RGBColor(0x22,0x22,0x55))
add_label(s1, 1.5, 3.1, 10, 0.5,
          "~90–95% circulates BOUND to cortisol-binding globulin (CBG) and albumin (liver-synthesised).",
          size=14, rgb=RGBColor(0x22,0x22,0x55))
add_label(s1, 1.5, 3.7, 10, 0.5,
          "~5% is FREE — the biologically active fraction.",
          size=14, rgb=RGBColor(0x22,0x22,0x55))
add_label(s1, 1.5, 4.3, 10, 0.5,
          "Key enzyme: 11β-Hydroxysteroid Dehydrogenase (11β-HSD) — two isoforms control tissue-level activity.",
          size=14, rgb=RGBColor(0x22,0x22,0x55))

# footer
add_label(s1, 0.2, 7.0, 12.9, 0.4,
          "References: Guyton & Hall (2021) p.950–954 | Lippincott Biochemistry 8e p.664–665 | Ganong's Review 26e p.3287 | Brenner & Rector's Kidney p.647 | Goldman-Cecil Medicine",
          size=8, rgb=RGBColor(0x88,0x88,0x88))

# ══════════════════════════════════════════════════════════════════
# SLIDE 2 — 11β-HSD isoforms comparison table
# ══════════════════════════════════════════════════════════════════
s2 = prs.slides.add_slide(blank)
set_bg(s2, RGBColor(0xF7, 0xF9, 0xFF))
hdr2 = s2.shapes.add_shape(1, Inches(0), Inches(0), Inches(13.333), Inches(1.2))
hdr2.fill.solid(); hdr2.fill.fore_color.rgb = C_TITLE_BG; hdr2.line.fill.background()
add_label(s2, 0.3, 0.1, 12.7, 0.9, "The 11β-HSD Enzyme System — Pre-receptor Gatekeeper",
          size=26, bold=True, rgb=C_TITLE_FG)

# Table headers
cols = ["Feature", "11β-HSD Type 1", "11β-HSD Type 2"]
col_x = [0.3, 3.5, 8.0]
col_w = [3.0, 4.3, 4.9]
row_data = [
    ("Direction",    "Cortisone → Cortisol\n(Reductase — ACTIVATES)",
                     "Cortisol → Cortisone\n(Dehydrogenase — INACTIVATES)"),
    ("Cofactor",     "NADPH-dependent",           "NAD⁺-dependent"),
    ("Tissues",      "Liver, Adipose, Brain,\nSkin, Skeletal muscle",
                     "Kidney, Salivary glands,\nColon, Sweat glands, Placenta"),
    ("Net Effect",   "Amplifies glucocorticoid\naction locally",
                     "Protects mineralocorticoid\nreceptor from cortisol"),
    ("Clinical relevance",
                     "↑ in obesity → insulin\nresistance; cognitive decline",
                     "Deficiency → Apparent\nMineralocorticoid Excess (AME)"),
]
header_fills = [RGBColor(0x1A,0x3A,0x5C), RGBColor(0x2E,0x7D,0x32), RGBColor(0xC6,0x28,0x28)]
header_fgs   = [C_WHITE, C_WHITE, C_WHITE]

for ci, (col, cx, cw) in enumerate(zip(cols, col_x, col_w)):
    add_box(s2, cx, 1.3, cw, 0.55, header_fills[ci], col,
            font_size=14, bold=True, font_rgb=header_fgs[ci],
            border_rgb=RGBColor(0xFF,0xFF,0xFF), border_pt=1.5)

row_fills = [C_BOX_YELLOW, C_BOX_GREY, C_BOX_GREEN, C_BOX_BLUE, C_BOX_RED]
for ri, (label, v1, v2) in enumerate(row_data):
    ry = 1.9 + ri * 0.98
    add_box(s2, 0.3,  ry, 3.0, 0.88, RGBColor(0xEE,0xEE,0xEE), label,
            font_size=12, bold=True)
    add_box(s2, 3.5,  ry, 4.3, 0.88, row_fills[ri], v1,  font_size=11)
    add_box(s2, 8.0,  ry, 4.9, 0.88, row_fills[ri], v2,  font_size=11)

add_label(s2, 0.2, 7.0, 12.9, 0.4,
          "References: Guyton & Hall (2021) p.953–954 | Wikipedia: 11β-Hydroxysteroid dehydrogenase | Brenner & Rector's Kidney p.647",
          size=8, rgb=RGBColor(0x88,0x88,0x88))

# ══════════════════════════════════════════════════════════════════
# SLIDE 3 — Simple Flowchart: Cortisol Metabolism
# ══════════════════════════════════════════════════════════════════
s3 = prs.slides.add_slide(blank)
set_bg(s3, RGBColor(0xF7, 0xF9, 0xFF))
hdr3 = s3.shapes.add_shape(1, Inches(0), Inches(0), Inches(13.333), Inches(1.1))
hdr3.fill.solid(); hdr3.fill.fore_color.rgb = C_TITLE_BG; hdr3.line.fill.background()
add_label(s3, 0.3, 0.1, 12.7, 0.85, "Cortisol Metabolism — Simple Flowchart",
          size=26, bold=True, rgb=C_TITLE_FG)

# Central cortisol box (top centre)
add_box(s3, 4.9, 1.2, 3.5, 0.75, C_BOX_YELLOW,
        "CORTISOL (Active)\nSecreted by Adrenal Cortex", font_size=12, bold=True)

# Arrow down-left to Kidney branch
add_arrow(s3, 5.0, 1.95, 2.2, 3.0)
# Arrow down-right to Liver/HSD1 branch
add_arrow(s3, 8.3, 1.95, 11.1, 3.0)
# Arrow straight down to Liver catabolism
add_arrow(s3, 6.65, 1.95, 6.65, 3.0)

# ── LEFT: Kidney / Salivary ──────────────────────────────────────
add_box(s3, 0.3, 3.0, 3.8, 0.75, C_BOX_BLUE,
        "Kidney | Salivary Glands\nColon | Sweat Glands", font_size=11, bold=True)
add_arrow(s3, 2.2, 3.75, 2.2, 4.5)
add_label(s3, 0.3, 3.78, 3.8, 0.65, "11β-HSD2\n(NAD⁺, Dehydrogenase)", size=10,
          rgb=RGBColor(0x77,0x00,0x00))
add_box(s3, 0.3, 4.5, 3.8, 0.65, C_BOX_GREY,
        "CORTISONE (Inactive)", font_size=12, bold=True)
add_arrow(s3, 2.2, 5.15, 2.2, 5.85)
add_box(s3, 0.3, 5.85, 3.8, 0.75, C_BOX_RED,
        "MR PROTECTED\n✗ Cannot activate Mineralocorticoid Receptor", font_size=10)

# ── CENTRE: Liver catabolism ─────────────────────────────────────
add_box(s3, 4.9, 3.0, 3.5, 0.7, C_BOX_YELLOW,
        "LIVER (Catabolism)", font_size=12, bold=True)
add_arrow(s3, 6.65, 3.7, 6.65, 4.4)
add_label(s3, 4.9, 3.72, 3.5, 0.65,
          "5α/5β-Reductase + 3α-HSD", size=10, rgb=RGBColor(0x00,0x55,0x00))
add_box(s3, 4.9, 4.4, 3.5, 0.7, C_BOX_GREEN,
        "THF / allo-THF / THE\n(Tetrahydro metabolites)", font_size=11)
add_arrow(s3, 6.65, 5.1, 6.65, 5.75)
add_label(s3, 4.9, 5.12, 3.5, 0.6,
          "Glucuronide conjugation", size=10, rgb=RGBColor(0x00,0x55,0x00))
add_box(s3, 4.9, 5.75, 3.5, 0.65, C_BOX_BLUE,
        "URINE EXCRETION\n(Water-soluble conjugates)", font_size=11)

# ── RIGHT: Liver HSD1 / Amplification ────────────────────────────
add_box(s3, 9.2, 3.0, 3.9, 0.75, C_BOX_GREY,
        "Liver | Adipose | Brain\nSkin | Skeletal Muscle", font_size=11, bold=True)
add_arrow(s3, 11.15, 3.75, 11.15, 4.45)
add_label(s3, 9.2, 3.78, 3.9, 0.65, "11β-HSD1\n(NADPH, Reductase — ACTIVATES)", size=10,
          rgb=RGBColor(0x00,0x44,0x88))
add_box(s3, 9.2, 4.45, 3.9, 0.7, C_BOX_YELLOW,
        "CORTISOL (Active)\n→ Glucocorticoid Receptor (GR)", font_size=11, bold=True)
add_arrow(s3, 11.15, 5.15, 11.15, 5.8)
add_box(s3, 9.2, 5.8, 3.9, 0.8, C_BOX_GREEN,
        "↑ Gluconeogenesis  ↑ Lipolysis\n↓ Immune response  ↑ Protein catabolism",
        font_size=10)

add_label(s3, 0.2, 7.0, 12.9, 0.4,
          "References: Guyton & Hall (2021) p.950–954 | Lippincott Biochemistry 8e p.664–665 | Ganong's Review 26e p.3287 | Brenner & Rector's Kidney p.647",
          size=8, rgb=RGBColor(0x88,0x88,0x88))

# ══════════════════════════════════════════════════════════════════
# SLIDE 4 — Kidney in detail
# ══════════════════════════════════════════════════════════════════
s4 = prs.slides.add_slide(blank)
set_bg(s4, RGBColor(0xF7, 0xF9, 0xFF))
hdr4 = s4.shapes.add_shape(1, Inches(0), Inches(0), Inches(13.333), Inches(1.1))
hdr4.fill.solid(); hdr4.fill.fore_color.rgb = C_TITLE_BG; hdr4.line.fill.background()
add_label(s4, 0.3, 0.1, 12.7, 0.85, "Kidney — Role of 11β-HSD2",
          size=26, bold=True, rgb=C_TITLE_FG)

points_kidney = [
    ("11β-HSD2 in distal tubule / cortical collecting duct",
     "Converts cortisol → cortisone (NAD⁺-dependent)"),
    ("Why it matters",
     "Cortisol circulates at ~1000× the concentration of aldosterone\nbut BOTH have equal affinity for the mineralocorticoid receptor (MR)"),
    ("Normal state",
     "11β-HSD2 inactivates cortisol → only aldosterone activates MR\n→ normal Na⁺ reabsorption, K⁺ excretion, blood pressure"),
    ("If 11β-HSD2 fails (AME / Licorice abuse)",
     "Cortisol floods MR → Na⁺ retention, hypertension, hypokalemia\nSuppressed renin, angiotensin II and aldosterone"),
    ("Diagnostic marker",
     "Urinary free cortisol : cortisone (UFF:UFE) ratio\n↑ ratio = impaired renal 11β-HSD2 activity"),
]

for i, (title, body) in enumerate(points_kidney):
    ry = 1.25 + i * 1.12
    add_box(s4, 0.4, ry, 4.5, 0.95, C_BOX_BLUE, title, font_size=12, bold=True)
    add_box(s4, 5.1, ry, 7.9, 0.95, C_BOX_GREY, body, font_size=11)

add_label(s4, 0.2, 7.0, 12.9, 0.4,
          "References: Guyton & Hall (2021) p.953 | Ganong's Review 26e p.3287 | Brenner & Rector's Kidney p.647 | Goldman-Cecil Medicine",
          size=8, rgb=RGBColor(0x88,0x88,0x88))

# ══════════════════════════════════════════════════════════════════
# SLIDE 5 — Liver in detail
# ══════════════════════════════════════════════════════════════════
s5 = prs.slides.add_slide(blank)
set_bg(s5, RGBColor(0xF7, 0xF9, 0xFF))
hdr5 = s5.shapes.add_shape(1, Inches(0), Inches(0), Inches(13.333), Inches(1.1))
hdr5.fill.solid(); hdr5.fill.fore_color.rgb = C_TITLE_BG; hdr5.line.fill.background()
add_label(s5, 0.3, 0.1, 12.7, 0.85, "Liver — Dual Role in Cortisol Metabolism",
          size=26, bold=True, rgb=C_TITLE_FG)

# Two columns
add_label(s5, 0.3, 1.15, 6.0, 0.5, "ROLE 1: ACTIVATION (11β-HSD1)",
          size=16, bold=True, rgb=RGBColor(0x1A,0x3A,0x5C))
add_label(s5, 7.0, 1.15, 6.0, 0.5, "ROLE 2: CATABOLISM & EXCRETION",
          size=16, bold=True, rgb=RGBColor(0x1A,0x3A,0x5C))

left_pts = [
    "Liver expresses 11β-HSD1 (NADPH reductase)",
    "Converts cortisone → active cortisol",
    "Amplifies glucocorticoid signalling locally",
    "↑ Gluconeogenesis (6–10× baseline)",
    "↑ Glycogen storage",
    "↑ Expression of gluconeogenic enzymes\n(PEPCK, G6Pase) via GR-mediated transcription",
    "↑ 11β-HSD1 in obesity → contributes to\ninsulin resistance & metabolic syndrome",
]
right_pts = [
    "5β-reductase (and 5α-reductase) reduce ring A",
    "→ Dihydrocortisol → Tetrahydrocortisol (THF)",
    "Cortisone → Tetrahydrocortisone (THE) via 5β-reductase",
    "Glucuronide (mainly) or sulfate conjugation",
    "Water-soluble conjugates excreted in urine",
    "Ratio (THF + allo-THF) : THE reflects\nhepatic 11β-HSD1 activity",
    "CBG (cortisol-binding globulin) also\nsynthesised by liver — liver disease ↓ CBG",
]

for i, pt in enumerate(left_pts):
    ry = 1.75 + i * 0.72
    b = s5.shapes.add_shape(1, Inches(0.3), Inches(ry), Inches(6.0), Inches(0.62))
    b.fill.solid(); b.fill.fore_color.rgb = C_BOX_YELLOW
    b.line.color.rgb = C_BOX_BORDER; b.line.width = Pt(0.75)
    tf = b.text_frame; tf.word_wrap = True; tf.vertical_anchor = MSO_ANCHOR.MIDDLE
    p = tf.paragraphs[0]; p.alignment = PP_ALIGN.LEFT
    run = p.add_run(); run.text = "• " + pt
    run.font.size = Pt(11); run.font.color.rgb = RGBColor(0x11,0x11,0x11)
    tf.margin_left = Pt(6)

for i, pt in enumerate(right_pts):
    ry = 1.75 + i * 0.72
    b = s5.shapes.add_shape(1, Inches(7.0), Inches(ry), Inches(6.1), Inches(0.62))
    b.fill.solid(); b.fill.fore_color.rgb = C_BOX_GREEN
    b.line.color.rgb = C_BOX_BORDER; b.line.width = Pt(0.75)
    tf = b.text_frame; tf.word_wrap = True; tf.vertical_anchor = MSO_ANCHOR.MIDDLE
    p = tf.paragraphs[0]; p.alignment = PP_ALIGN.LEFT
    run = p.add_run(); run.text = "• " + pt
    run.font.size = Pt(11); run.font.color.rgb = RGBColor(0x11,0x11,0x11)
    tf.margin_left = Pt(6)

add_label(s5, 0.2, 7.0, 12.9, 0.4,
          "References: Guyton & Hall (2021) p.2055–2071 | Lippincott Biochemistry 8e p.664–665 | Goldman-Cecil Medicine p.443",
          size=8, rgb=RGBColor(0x88,0x88,0x88))

# ══════════════════════════════════════════════════════════════════
# SLIDE 6 — Salivary Glands
# ══════════════════════════════════════════════════════════════════
s6 = prs.slides.add_slide(blank)
set_bg(s6, RGBColor(0xF7, 0xF9, 0xFF))
hdr6 = s6.shapes.add_shape(1, Inches(0), Inches(0), Inches(13.333), Inches(1.1))
hdr6.fill.solid(); hdr6.fill.fore_color.rgb = C_TITLE_BG; hdr6.line.fill.background()
add_label(s6, 0.3, 0.1, 12.7, 0.85, "Salivary Glands — Cortisol Metabolism & Diagnostic Use",
          size=26, bold=True, rgb=C_TITLE_FG)

sal_pts = [
    ("11β-HSD2 present in salivary gland epithelium",
     "Converts cortisol → cortisone\nProtects salivary mineralocorticoid receptors (regulate Na⁺/K⁺ in saliva)"),
    ("Salivary cortisol = FREE cortisol only",
     "Unlike serum (90–95% protein-bound)\nSaliva contains only the unbound, biologically active fraction"),
    ("Diagnostic — Late-night salivary cortisol",
     "Gold-standard non-invasive screen for Cushing's syndrome\nNormal: low at midnight; Cushing's: remains elevated"),
    ("Salivary cortisol : cortisone ratio",
     "Reflects local 11β-HSD2 activity\nHigh ratio = impaired inactivation (enzyme overwhelmed or deficient)"),
    ("Advantages of salivary sampling",
     "Non-invasive, stress-free, suitable for children, outpatients & research\nStable at room temperature for several hours"),
]

for i, (title, body) in enumerate(sal_pts):
    ry = 1.25 + i * 1.12
    add_box(s6, 0.4, ry, 4.5, 0.95, C_BOX_BLUE, title, font_size=12, bold=True)
    add_box(s6, 5.1, ry, 7.9, 0.95, C_BOX_GREY, body, font_size=11)

add_label(s6, 0.2, 7.0, 12.9, 0.4,
          "References: Guyton & Hall (2021) p.953 | Salivary Biomarkers Review, Univ. of Liverpool (2021) | Ganong's Review 26e p.3287",
          size=8, rgb=RGBColor(0x88,0x88,0x88))

# ══════════════════════════════════════════════════════════════════
# SLIDE 7 — Clinical Correlations
# ══════════════════════════════════════════════════════════════════
s7 = prs.slides.add_slide(blank)
set_bg(s7, RGBColor(0xF7, 0xF9, 0xFF))
hdr7 = s7.shapes.add_shape(1, Inches(0), Inches(0), Inches(13.333), Inches(1.1))
hdr7.fill.solid(); hdr7.fill.fore_color.rgb = C_TITLE_BG; hdr7.line.fill.background()
add_label(s7, 0.3, 0.1, 12.7, 0.85, "Clinical Correlations",
          size=26, bold=True, rgb=C_TITLE_FG)

clin = [
    ("Apparent Mineralocorticoid\nExcess (AME)",
     "Genetic deficiency of 11β-HSD2\nCortisol activates renal MR\nHypertension + Hypokalemia + Suppressed aldosterone",
     C_BOX_RED),
    ("Licorice Abuse",
     "Glycyrrhetinic acid inhibits 11β-HSD2\nSame picture as AME\nReversible on stopping licorice",
     C_BOX_RED),
    ("Cushing's Syndrome",
     "Extreme cortisol excess overwhelms 11β-HSD2\nCortisol spills into MR → Na⁺ retention\nAlso adrenal diabetes, central obesity",
     C_BOX_RED),
    ("Obesity / Metabolic Syndrome",
     "↑ Adipose 11β-HSD1 → excess local cortisol\nContributes to insulin resistance, dyslipidaemia\nTarget for drug development (11β-HSD1 inhibitors)",
     C_BOX_YELLOW),
    ("Cushing's Screening",
     "Late-night salivary cortisol — validated first-line test\nUrinary free cortisol / 24-hr UFC\nLow-dose dexamethasone suppression test",
     C_BOX_BLUE),
    ("Diagnostic Ratios",
     "(THF + allo-THF) : THE → hepatic 11β-HSD1\nUFF : UFE (urinary) → renal 11β-HSD2\nSalivary cortisol : cortisone → salivary 11β-HSD2",
     C_BOX_GREEN),
]

for i, (title, body, fill) in enumerate(clin):
    col = i % 2
    row = i // 2
    cx = 0.3 + col * 6.6
    ry = 1.2 + row * 2.0
    add_box(s7, cx, ry, 3.0, 1.7, C_TITLE_BG, title, font_size=13, bold=True,
            font_rgb=C_WHITE, border_rgb=C_WHITE)
    add_box(s7, cx + 3.1, ry, 3.4, 1.7, fill, body, font_size=10)

add_label(s7, 0.2, 7.0, 12.9, 0.4,
          "References: Ganong's Review 26e p.3287 | Brenner & Rector's Kidney p.647 | Guyton & Hall (2021) p.953–954 | Liverpool Salivary Biomarkers Review (2021)",
          size=8, rgb=RGBColor(0x88,0x88,0x88))

# ══════════════════════════════════════════════════════════════════
# SLIDE 8 — References
# ══════════════════════════════════════════════════════════════════
s8 = prs.slides.add_slide(blank)
set_bg(s8, RGBColor(0xF7, 0xF9, 0xFF))
hdr8 = s8.shapes.add_shape(1, Inches(0), Inches(0), Inches(13.333), Inches(1.1))
hdr8.fill.solid(); hdr8.fill.fore_color.rgb = C_TITLE_BG; hdr8.line.fill.background()
add_label(s8, 0.3, 0.1, 12.7, 0.85, "References", size=26, bold=True, rgb=C_TITLE_FG)

refs = [
    "1.  Hall JE, Hall ME. Guyton and Hall Textbook of Medical Physiology. 14th ed. Elsevier; 2021. pp. 950–954.",
    "2.  Ferrier DR. Lippincott Illustrated Reviews: Biochemistry. 8th ed. Wolters Kluwer; 2022. pp. 664–665.",
    "3.  Barrett KE, et al. Ganong's Review of Medical Physiology. 26th ed. McGraw-Hill; 2019. p. 3287.",
    "4.  Yu ASL, et al. Brenner and Rector's The Kidney. 11th ed. Elsevier; 2020. p. 647.",
    "5.  Goldman L, Schafer AI. Goldman-Cecil Medicine. 26th ed. Elsevier; 2020. Chapter 203.",
    "6.  Chapman K, Holmes M, Seckl J. 11β-Hydroxysteroid Dehydrogenases: Intracellular Gate-Keepers of\n    Tissue Glucocorticoid Action. Physiol Rev. 2013;93(3):1139–1206. PMC3962546.",
    "7.  New MI, et al. 11β-Hydroxysteroid Dehydrogenase and Its Role in Apparent Mineralocorticoid Excess.\n    Pediatr Res. 1997;41(1):25–29.",
    "8.  Clow A, et al. Salivary Biomarkers of Health and Disease from Childhood to Older Adults.\n    University of Liverpool Repository; 2021.",
    "9.  Wikipedia: 11β-Hydroxysteroid dehydrogenase. Accessed July 2026.\n    https://en.wikipedia.org/wiki/11%CE%B2-Hydroxysteroid_dehydrogenase",
]

for i, ref in enumerate(refs):
    ry = 1.2 + i * 0.67
    tb = s8.shapes.add_textbox(Inches(0.5), Inches(ry), Inches(12.5), Inches(0.6))
    tf = tb.text_frame; tf.word_wrap = True
    p = tf.paragraphs[0]; p.alignment = PP_ALIGN.LEFT
    run = p.add_run(); run.text = ref
    run.font.size = Pt(12); run.font.color.rgb = C_REF_TXT

# ══════════════════════════════════════════════════════════════════
# SAVE
# ══════════════════════════════════════════════════════════════════
out = "/tmp/workspace/cortisol-ppt/Cortisol_Metabolism.pptx"
prs.save(out)
print(f"Saved: {out}")
cd /tmp/workspace/cortisol-ppt && python build_ppt.py 2>&1
~/cortisol-ppt/build_ppt.py
Successfully replaced 1 instance(s) of the string in '/tmp/workspace/cortisol-ppt/build_ppt.py'
cd /tmp/workspace/cortisol-ppt && python build_ppt.py 2>&1
Cortisol Metabolism
Presentation · PPTX
| Slide | Content |
|---|---|
| 1 | Title slide - overview of cortisol circulation & binding |
| 2 | 11β-HSD isoforms comparison table (HSD1 vs HSD2) |
| 3 | Simple flowchart - Cortisol → 3 branches: Kidney/Salivary, Liver catabolism, Liver/Adipose activation |
| 4 | Kidney detail - 11β-HSD2, MR protection, AME, diagnostic ratio |
| 5 | Liver detail - dual role: activation (HSD1) + catabolism (THF/THE → urine) |
| 6 | Salivary glands - 11β-HSD2, free cortisol, Cushing's screening |
| 7 | Clinical correlations - AME, licorice, Cushing's, obesity, diagnostic ratios |
| 8 | Full references (9 sources) |
i want put a slide on basis of investiation in Cushing syndrome gve me some bullet points
Bullet Points: Investigation of Cushing's Syndrome
STEP 1 — First exclude Iatrogenic Cushing's
- Rule out exogenous corticosteroid use (oral, inhaled, topical)
STEP 2 — Screening Tests (confirm hypercortisolism)
- Late-night salivary cortisol (×2 measurements) - loss of diurnal rhythm; elevated at midnight = abnormal
- 24-hour urinary free cortisol (UFC) (×2 measurements) - >3× upper limit of normal = significant overspill
- Overnight 1-mg dexamethasone suppression test (DST) - morning cortisol >50 nmol/L (>1.8 µg/dL) = non-suppressed = abnormal
- 2-mg 48-hour DST - preferred in depression, obesity, alcoholism, diabetes (pseudo-Cushing states)
- Note: Use 24-hr UFC in pregnancy and severe renal failure (DST unreliable)
STEP 3 — Determine ACTH dependency (plasma ACTH)
- ACTH elevated (>20 pg/mL) → ACTH-dependent (~80% of cases)
- ACTH suppressed (<5 pg/mL) → ACTH-independent (~20% of cases)
STEP 4A — If ACTH-Dependent
- Pituitary MRI - most have microadenoma (<10 mm); low sensitivity in isolation
- High-dose DST (8 mg) - suppression >50% suggests Cushing's disease (pituitary); no suppression suggests ectopic
- CRH stimulation test - exaggerated ACTH/cortisol rise = Cushing's disease
- Bilateral inferior petrosal sinus sampling (BIPSS) - gold standard to distinguish pituitary vs ectopic ACTH; after CRH stimulation
- If ectopic suspected: CT thorax/abdomen/pelvis; ⁶⁸Ga-SSTR PET-CT (75-80% sensitive for ectopic source)
STEP 4B — If ACTH-Independent
- CT or MRI of adrenal glands - unilateral adenoma / bilateral hyperplasia / adrenocortical carcinoma
- Benign adenoma: hypodense, <10 HU on non-contrast CT
cd /tmp/workspace/cortisol-ppt && python3 - <<'EOF' from pptx import Presentation from pptx.util import Inches, Pt from pptx.dml.color import RGBColor from pptx.enum.text import PP_ALIGN, MSO_ANCHOR from io import BytesIO prs = Presentation("Cortisol_Metabolism.pptx") blank = prs.slide_layouts[6] C_TITLE_BG = RGBColor(0x1A,0x3A,0x5C) C_WHITE = RGBColor(0xFF,0xFF,0xFF) C_BOX_BLUE = RGBColor(0xBB,0xDE,0xFB) C_BOX_YELLOW= RGBColor(0xFF,0xF0,0xB0) C_BOX_GREEN = RGBColor(0xC8,0xE6,0xC9) C_BOX_RED = RGBColor(0xFF,0xCC,0xCC) C_BOX_GREY = RGBColor(0xE8,0xE8,0xE8) C_BOX_ORANGE= RGBColor(0xFF,0xE0,0xB2) C_TXT = RGBColor(0x11,0x11,0x11) C_BORDER = RGBColor(0x55,0x55,0x55) def set_bg(slide, rgb): slide.background.fill.solid() slide.background.fill.fore_color.rgb = rgb def add_label(slide, x, y, w, h, text, size=12, bold=False, align=PP_ALIGN.LEFT, rgb=RGBColor(0x11,0x11,0x11)): tb = slide.shapes.add_textbox(Inches(x), Inches(y), Inches(w), Inches(h)) tf = tb.text_frame; tf.word_wrap = True tf.vertical_anchor = MSO_ANCHOR.MIDDLE p = tf.paragraphs[0]; p.alignment = align run = p.add_run(); run.text = text run.font.size = Pt(size); run.font.bold = bold run.font.color.rgb = rgb def add_box(slide, x, y, w, h, fill, text, fsize=11, bold=False, align=PP_ALIGN.LEFT, border=C_BORDER): shape = slide.shapes.add_shape(1, Inches(x), Inches(y), Inches(w), Inches(h)) shape.fill.solid(); shape.fill.fore_color.rgb = fill shape.line.color.rgb = border; shape.line.width = Pt(0.8) tf = shape.text_frame; tf.word_wrap = True tf.vertical_anchor = MSO_ANCHOR.MIDDLE tf.margin_left = Pt(6); tf.margin_right = Pt(4) p = tf.paragraphs[0]; p.alignment = align run = p.add_run(); run.text = text run.font.size = Pt(fsize); run.font.bold = bold run.font.color.rgb = C_TXT def add_arrow(slide, x1, y1, x2, y2): from lxml import etree sp_tree = slide.shapes._spTree xml = f"""<p:cxnSp xmlns:p="http://schemas.openxmlformats.org/presentationml/2006/main" xmlns:a="http://schemas.openxmlformats.org/drawingml/2006/main" xmlns:r="http://schemas.openxmlformats.org/officeDocument/2006/relationships"> <p:nvCxnSpPr><p:cNvPr id="200" name="Arr"/><p:cNvCxnSpPr/><p:nvPr/></p:nvCxnSpPr> <p:spPr> <a:xfrm><a:off x="{int(x1*914400)}" y="{int(y1*914400)}"/> <a:ext cx="{int((x2-x1)*914400)}" cy="{int((y2-y1)*914400)}"/></a:xfrm> <a:prstGeom prst="straightConnector1"><a:avLst/></a:prstGeom> <a:ln w="22860"><a:solidFill><a:srgbClr val="333333"/></a:solidFill> <a:headEnd type="none"/><a:tailEnd type="arrow" w="med" len="med"/></a:ln> </p:spPr></p:cxnSp>""" sp_tree.append(etree.fromstring(xml)) # ══════════════════════════════════════════════════ # New slide: Investigation of Cushing's Syndrome # ══════════════════════════════════════════════════ s = prs.slides.add_slide(blank) set_bg(s, RGBColor(0xF7,0xF9,0xFF)) # Header hdr = s.shapes.add_shape(1, Inches(0), Inches(0), Inches(13.333), Inches(1.05)) hdr.fill.solid(); hdr.fill.fore_color.rgb = C_TITLE_BG; hdr.line.fill.background() add_label(s, 0.3, 0.08, 12.7, 0.85, "Investigation of Cushing's Syndrome — Step-by-Step Approach", size=24, bold=True, align=PP_ALIGN.LEFT, rgb=C_WHITE) # ── STEP 1: Exclude Iatrogenic ─────────────────── add_box(s, 0.25, 1.1, 12.8, 0.55, C_BOX_GREY, "STEP 1 — First exclude IATROGENIC Cushing's: rule out exogenous corticosteroid use (oral, inhaled, topical, parenteral)", fsize=11, bold=False) # ── STEP 2: Screening header ───────────────────── add_box(s, 0.25, 1.75, 12.8, 0.42, C_TITLE_BG, "STEP 2 — SCREENING TESTS (Confirm hypercortisolism — Endocrine Society 2008: ≥2 tests abnormal required)", fsize=11, bold=True, border=C_TITLE_BG, align=PP_ALIGN.LEFT) # force white text shape = s.shapes[-1] shape.text_frame.paragraphs[0].runs[0].font.color.rgb = C_WHITE scr = [ ("Late-night Salivary Cortisol ×2", "Loss of diurnal rhythm; cortisol normally at nadir at midnight;\nRaised = abnormal; non-invasive, validated for Cushing's screening", C_BOX_BLUE), ("24-hr Urinary Free Cortisol (UFC) ×2", ">3× upper limit of normal = significant hypercortisolism;\nPreferred in pregnancy and severe renal failure", C_BOX_BLUE), ("Overnight 1-mg DST", "Morning cortisol >50 nmol/L (>1.8 µg/dL) = non-suppressed = abnormal", C_BOX_BLUE), ("2-mg 48-hr DST", "Preferred when pseudo-Cushing states present:\ndepression, obesity, alcoholism, diabetes mellitus", C_BOX_BLUE), ] for i, (lbl, body, fill) in enumerate(scr): rx = 0.25 + i * 3.28 add_box(s, rx, 2.22, 2.3, 0.42, C_BOX_ORANGE, lbl, fsize=10, bold=True) add_box(s, rx, 2.68, 2.3, 0.72, fill, body, fsize=9) # ── STEP 3: ACTH ──────────────────────────────── add_box(s, 0.25, 3.48, 12.8, 0.42, C_TITLE_BG, "STEP 3 — PLASMA ACTH (Determine ACTH-dependency)", fsize=11, bold=True, border=C_TITLE_BG) s.shapes[-1].text_frame.paragraphs[0].runs[0].font.color.rgb = C_WHITE add_box(s, 0.25, 3.95, 6.2, 0.58, C_BOX_YELLOW, "ACTH ELEVATED (>20 pg/mL) → ACTH-Dependent (~80%)\nCushing's disease (pituitary) or Ectopic ACTH", fsize=10, bold=True) add_box(s, 6.65, 3.95, 6.4, 0.58, C_BOX_GREEN, "ACTH SUPPRESSED (<5 pg/mL) → ACTH-Independent (~20%)\nAdrenal adenoma / Carcinoma / Bilateral hyperplasia", fsize=10, bold=True) # ── STEP 4A: ACTH-dependent ────────────────────── add_box(s, 0.25, 4.62, 6.2, 0.38, C_BOX_YELLOW, "STEP 4A — If ACTH-Dependent", fsize=10, bold=True) dep = [ "Pituitary MRI — microadenoma (<10 mm); low sensitivity alone", "High-dose DST (8 mg) — suppression >50% = Cushing's disease", "CRH stimulation test — exaggerated rise = pituitary source", "Bilateral Inferior Petrosal Sinus Sampling (BIPSS) — gold standard\n to distinguish pituitary vs ectopic ACTH", "If ectopic suspected: CT thorax/abdomen/pelvis;\n ⁶⁸Ga-SSTR PET-CT (75–80% sensitive for ectopic source)", ] for i, pt in enumerate(dep): ry = 5.05 + i * 0.43 add_box(s, 0.25, ry, 6.2, 0.40, C_BOX_YELLOW, "• " + pt, fsize=9) # ── STEP 4B: ACTH-independent ──────────────────── add_box(s, 6.65, 4.62, 6.4, 0.38, C_BOX_GREEN, "STEP 4B — If ACTH-Independent", fsize=10, bold=True) indep = [ "CT or MRI of adrenal glands", "Unilateral adenoma — benign: hypodense, <10 HU on non-contrast CT", "Bilateral nodular hyperplasia — consider AIMAH or Carney complex", "Adrenocortical carcinoma — large, irregular, heterogeneous", "First exclude surreptitious glucocorticoid administration", ] for i, pt in enumerate(indep): ry = 5.05 + i * 0.43 add_box(s, 6.65, ry, 6.4, 0.40, C_BOX_GREEN, "• " + pt, fsize=9) # Footer add_label(s, 0.2, 7.08, 12.9, 0.35, "References: Bailey & Love's Surgery 28e p.8032–8068 | Berek & Novak's Gynaecology p.88 | Quick Compendium Clinical Pathology 5e p.3470–3481 | Endocrine Society Clinical Practice Guidelines 2008", size=7.5, rgb=RGBColor(0x88,0x88,0x88)) # Save buf = BytesIO() prs.save(buf) with open("Cortisol_Metabolism.pptx","wb") as f: f.write(buf.getvalue()) print("Done — slide added successfully.") EOF
Cortisol Metabolism
Presentation · PPTX
- Rule out exogenous corticosteroid use (oral, inhaled, topical, parenteral)
- Late-night salivary cortisol ×2 - loss of diurnal rhythm
- 24-hr urinary free cortisol (UFC) ×2 - >3× upper limit = significant
- Overnight 1-mg DST - cortisol >50 nmol/L = non-suppressed
- 2-mg 48-hr DST - preferred in pseudo-Cushing states (depression, obesity, alcoholism, diabetes)
- Elevated (>20 pg/mL) → ACTH-dependent (~80%)
- Suppressed (<5 pg/mL) → ACTH-independent (~20%)
- Pituitary MRI (microadenoma, <10 mm)
- High-dose DST (8 mg) - suppression >50% = Cushing's disease
- CRH stimulation test - exaggerated rise = pituitary source
- Bilateral inferior petrosal sinus sampling (BIPSS) - gold standard to distinguish pituitary vs ectopic
- If ectopic: CT thorax/abdomen/pelvis; ⁶⁸Ga-SSTR PET-CT (75-80% sensitive)
- CT/MRI adrenals - adenoma, bilateral hyperplasia, or carcinoma
- Benign adenoma: hypodense, <10 HU on non-contrast CT
Exogenous cusgings syndrome and role of synaten test and
Exogenous (Iatrogenic) Cushing's Syndrome & the Synacthen Test
What is Exogenous Cushing's Syndrome?
- Harrison's Principles of Internal Medicine 22e, p. 964
- Campbell Walsh Wein Urology, p. 1832
Causes / Sources of Exogenous Glucocorticoids
- Oral: prednisolone, dexamethasone, hydrocortisone (most common and potent route)
- Inhaled: fluticasone ≥750 mcg/day or beclomethasone ≥1500 mcg/day for >3 weeks
- Topical: high-potency creams >2 g/day for >2 weeks
- Intra-articular / epidural / spinal: 3 or more injections within 3 months
- Ophthalmic / ototopical: can also cause HPA suppression
- Surreptitious use: herbal remedies, nasal sprays, performance-enhancing drugs - patient may be unaware
Key Pathophysiology
Exogenous glucocorticoid
        ↓
Negative feedback on hypothalamus + pituitary
        ↓
↓ CRH  →  ↓ ACTH  →  Adrenal cortex loses ACTH stimulation
        ↓
Adrenocortical cells undergo apoptosis + atrophy
(all cells except aldosterone-producing zona glomerulosa)
        ↓
Secondary adrenal insufficiency
- Without ACTH, glucocorticoid-producing adrenal cells arrest hormone production and undergo apoptosis
- Goldman-Cecil Medicine, p. 2728; Campbell Walsh Urology, p. 1819
Clinical Features of Exogenous Cushing's
| Feature | Notes |
|---|---|
| Central obesity, moon face, buffalo hump | Classic Cushingoid appearance |
| Skin fragility, easy bruising, striae | Very common with steroids |
| Proximal myopathy | Characteristic |
| Osteoporosis / osteonecrosis | Major complication, often femoral head |
| Hypertension, hyperglycaemia | Common |
| Poor wound healing | Impaired immunity |
| Posterior subcapsular cataracts | |
| Hyperlipidaemia | |
| Growth retardation (children) | |
| ACTH very LOW / suppressed | Key distinguishing feature from endogenous |
| Adrenal glands atrophied / small | On imaging - opposite of Cushing's disease |
| No hyperpigmentation | (No excess ACTH to stimulate melanocytes) |
| Risk of adrenal crisis on withdrawal | Critical danger - do NOT stop steroids abruptly |
The Synacthen (Short ACTH Stimulation) Test
- Confirm adrenal insufficiency
- Assess the degree of HPA axis suppression after prolonged steroid use
- Guide safe steroid tapering
Protocol:
| Step | Detail |
|---|---|
| Baseline | Measure serum cortisol at time 0 |
| Injection | 250 mcg Synacthen IV (or IM) bolus |
| Re-measure | Serum cortisol at 30 minutes and 60 minutes |
Interpretation:
| Result | Meaning |
|---|---|
| Peak cortisol >500 nmol/L (>18 µg/dL) | NORMAL - adrenal reserve intact, HPA axis not significantly suppressed |
| Peak cortisol <500 nmol/L (<18 µg/dL) | ABNORMAL - adrenal insufficiency confirmed (92% sensitive) |
| Peak cortisol >20 µg/dL | Normal per some centres (Mulholland Surgery criteria) |
- Symptom to Diagnosis 4th ed, p. 7499; Mulholland & Greenfield's Surgery 7e, p. 2743
Why the SST Can Be FALSELY NORMAL in Exogenous Cushing's
- Chronic HPA suppression (>1 month) → adrenal atrophy → adrenal cannot respond to Synacthen → SST positive (abnormal) - correctly detected
- Acute/recent HPA suppression (e.g., just stopped steroids, recent pituitary surgery) → adrenal gland not yet atrophied → Synacthen still stimulates cortisol → falsely normal SST
- In acute cases, the Insulin Tolerance Test (ITT) or metyrapone test is needed to challenge the whole hypothalamic-pituitary axis
When to Suspect HPA Suppression (Do the Synacthen Test)
| Steroid dose/duration | HPA suppression risk | Action |
|---|---|---|
| <7.5 mg prednisolone/day, any duration | Unlikely | No test needed; take usual morning dose |
| Any dose, <3 weeks | Unlikely | No test needed |
| 7.5–20 mg/day, >3 weeks | Uncertain - likely | Consider SST |
| >20 mg/day, >3 weeks | Likely | Assume suppressed; perioperative steroid cover required |
| Inhaled fluticasone ≥750 mcg/day, >3 weeks | Risk | Consider SST preoperatively |
- Miller's Anaesthesia 10e, p. 84-86; Barash's Clinical Anaesthesia 9e, p. 2541
Management of Exogenous Cushing's / Steroid Withdrawal
-
Never stop abruptly - risk of adrenal crisis (hypotension, vomiting, shock, death)
-
Gradual taper to allow HPA axis recovery - may take weeks to months
-
Adrenal insufficiency risk after withdrawal estimated at ~30% across all routes of administration
-
Use SST to confirm HPA recovery before stopping completely
-
During illness or surgery - give stress doses of hydrocortisone:
-
Minor surgery: 25 mg hydrocortisone on day of procedure
-
Moderate surgery: 50-75 mg hydrocortisone, taper over 1-2 days
-
Major surgery: 100-150 mg hydrocortisone/day, tapered over 2-3 days
-
Goldman-Cecil Medicine, p. 2728; Miller's Anaesthesia 10e, p. 86-93
how to known biochemically exogenouss strid intake
How to Identify Exogenous Steroid Intake Biochemically
The Core Biochemical Fingerprint
| Test | Exogenous Cushing's | Endogenous Cushing's (e.g. Cushing's disease) |
|---|---|---|
| Plasma ACTH | Very LOW / undetectable (<5 pg/mL) | Elevated (pituitary) or very high (ectopic) |
| Serum cortisol (morning) | LOW / suppressed | Elevated |
| 24-hr Urinary Free Cortisol (UFC) | LOW (endogenous cortisol suppressed) | Elevated (>3× ULN) |
| Late-night salivary cortisol | LOW | Elevated (diurnal rhythm lost) |
| Dexamethasone suppression test (DST) | Paradoxically SUPPRESSED already | Fails to suppress |
| Adrenal size on imaging | Small / atrophied bilaterally | Enlarged / hyperplastic |
- Tietz Textbook of Laboratory Medicine 7e, pp. 2221-2226; Campbell Walsh Urology, p. 1963
Detailed Biochemical Tests & Their Interpretation
1. Plasma ACTH (Most Discriminating Single Test)
- Exogenous glucocorticoids exert negative feedback on the hypothalamus (↓ CRH) and pituitary (↓ ACTH)
- Result: ACTH suppressed to <5 pg/mL or undetectable
- This is the single most useful test to distinguish exogenous from endogenous causes
- In Cushing's disease ACTH is high; in ectopic ACTH syndrome it can be >300 pg/mL
- In exogenous Cushing's it is paradoxically opposite - near zero
2. Serum Cortisol
-
Morning serum cortisol is LOW - endogenous production suppressed
-
Normal morning range: 5-25 µg/dL (140-690 nmol/L); in exogenous Cushing's, may be <3 µg/dL
-
BUT: Important assay caveat - some synthetic steroids (prednisolone, hydrocortisone) cross-react with cortisol immunoassays, giving falsely ELEVATED readings
-
Prednisolone shows variable cross-reactivity with cortisol antibodies - can falsely inflate measured cortisol
-
Dexamethasone does NOT cross-react with cortisol immunoassays - this is why dexamethasone is used in suppression tests (endogenous cortisol can still be measured accurately)
-
HPLC-MS/MS (liquid chromatography-mass spectrometry) is the gold standard - can separately measure cortisol AND identify specific exogenous steroids simultaneously
-
Tietz Textbook of Laboratory Medicine 7e, pp. 2444-2446; Henry's Clinical Diagnosis by Laboratory Methods, p. 1761
3. Urinary Free Cortisol (24-hr UFC)
- Exogenous Cushing's → endogenous cortisol suppressed → UFC is LOW or undetectable
- Endogenous Cushing's → UFC is elevated (>3× upper limit of normal)
- A low UFC with Cushingoid features = strongly suggests exogenous source
4. Direct Detection of Exogenous Steroids in Urine or Serum
| Steroid | Detected by |
|---|---|
| Prednisolone / prednisone | Urinary steroid profile (GC-MS / HPLC-MS) - prednisolone and its metabolites detected in urine |
| Dexamethasone | Serum/urine dexamethasone levels by HPLC-MS; does NOT cross-react with cortisol assays |
| Budesonide, fluticasone | Specialist mass spectrometry panels |
| Methylprednisolone | Urinary metabolites on steroid profile |
- A 24-hr urine steroid profile by GC-MS will show:
- Absent or very low tetrahydrocortisol (THF), allo-THF, tetrahydrocortisone (THE) - endogenous metabolites suppressed
- Presence of exogenous steroid metabolites (prednisolone metabolites, etc.)
5. Dexamethasone Suppression Test (DST) - Paradoxical Response
- In endogenous Cushing's: cortisol fails to suppress after 1mg dexamethasone (>50 nmol/L = abnormal)
- In exogenous Cushing's: if the patient is taking dexamethasone themselves, cortisol will appear suppressed - but this is misleading
- If taking other steroids (prednisolone): the DST may give confusing results because prednisolone cross-reacts with the cortisol assay
- Key: dexamethasone does not cross-react with cortisol immunoassay, making it the ideal suppressing agent for diagnostic testing
- Tietz Textbook, p. 2444
6. Synacthen (Short ACTH Stimulation) Test in Exogenous Cushing's
- After prolonged exogenous steroid use → adrenal cortex atrophies from lack of ACTH stimulation
- Give 250 µg Synacthen IV → measure cortisol at 30 and 60 min
- Result in exogenous Cushing's (chronic):
- Blunted/absent cortisol rise (peak <500 nmol/L = <18 µg/dL)
- Confirms secondary adrenal insufficiency due to HPA suppression
- Interpretation caveat: if steroid use is recent/short-term (<1 month), adrenal atrophy has not yet occurred and the SST may be falsely normal - the ITT (insulin tolerance test) is then needed
Summary Algorithm: "Is This Exogenous Steroid Use?"
Patient has Cushingoid features
            ↓
STEP 1: History → any steroid use? (including hidden sources)
            ↓
STEP 2: Plasma ACTH
   Low/undetectable → ACTH-independent
            ↓
STEP 3: Serum cortisol (morning)
   LOW → suggests exogenous (not an autonomous adrenal tumour)
            ↓
STEP 4: 24-hr UFC
   LOW → further supports exogenous
            ↓
STEP 5: HPLC-MS/MS urine steroid profile
   Absent endogenous metabolites (THF/THE) + exogenous steroid metabolites DETECTED
            ↓
STEP 6: Adrenal imaging (CT/MRI)
   Both adrenals SMALL/ATROPHIED → confirms no autonomous adrenal tumour
            ↓
STEP 7: Short Synacthen Test
   Flat response → HPA suppression from chronic exogenous steroid use CONFIRMED
Key Distinguishing Points at a Glance
| Feature | Exogenous | Endogenous (Cushing's disease) | Adrenal adenoma |
|---|---|---|---|
| ACTH | ↓↓ undetectable | ↑ (normal-high) | ↓ |
| Morning cortisol | ↓ | ↑ | ↑ |
| UFC | ↓ | ↑↑ | ↑ |
| Adrenal size | ↓ (atrophied) | ↑ (hyperplastic) | Unilateral mass |
| DST response | Suppressed (cortisol already low) | Fails to suppress | Fails to suppress |
| Synacthen | Flat / blunted | Normal or exaggerated | Flat (contralateral atrophy) |
| Exogenous steroid in urine | PRESENT | Absent | Absent |
from endocrine soirty guidelines i want 8am cortsiol velues
"Endocrine Society" guideline cortisol 8am morning adrenal insufficiency Cushing
"adrenal insufficiency" diagnosis "morning cortisol" cutoff guideline
Endocrine Society guidelines 8am cortisol values cutoff adrenal insufficiency Cushing syndrome 2016
https://pmc.ncbi.nlm.nih.gov/articles/PMC2605410
Endocrine Society Guidelines — 8 AM Cortisol Values
GUIDELINE 1: Diagnosis of Adrenal Insufficiency (2016)
| 8 AM Cortisol Value | Interpretation | Action |
|---|---|---|
| ≥ 18 µg/dL (≥ 500 nmol/L) | Adrenal insufficiency EXCLUDED - sufficient adrenal function | No further testing needed |
| < 3 µg/dL (< 83 nmol/L) | Adrenal insufficiency CONFIRMED - strongly diagnostic | Check 8 AM ACTH to distinguish primary vs secondary |
| 3–15 µg/dL (83–415 nmol/L) | Indeterminate / Grey zone | Proceed to Short Synacthen Test (SST) |
| > 15 µg/dL (> 415 nmol/L) | AI unlikely | Can likely exclude AI |
"Morning serum cortisol ≤3 mcg/dL is strongly suggestive of adrenal insufficiency; morning serum cortisol ≥18 mcg/dL assures sufficient adrenal function."
- Mulholland & Greenfield's Surgery 7e, Endocrine Society 2016 Central AI Guidelines
- Morning cortisol ≥ 16.3 µg/dL → rules OUT adrenal insufficiency (99.2% sensitive)
- Morning cortisol ≤ 3.6 µg/dL → establishes adrenal insufficiency (98.4% specific)
- Morning cortisol 3.6–16.3 µg/dL → non-diagnostic → do Synacthen test
GUIDELINE 2: Diagnosis of Cushing's Syndrome (2008)
| 8 AM Cortisol (after 1 mg DEX at 11 PM) | Interpretation |
|---|---|
| > 1.8 µg/dL (> 50 nmol/L) | ABNORMAL - cortisol not suppressed = possible Cushing's syndrome (sensitivity >95%) |
| ≤ 1.8 µg/dL (≤ 50 nmol/L) | NORMAL - cortisol suppressed = Cushing's unlikely |
| Old cut-off (not recommended): > 5 µg/dL (140 nmol/L) | Less sensitive - the Society recommends 1.8 µg/dL instead |
The guideline recommends the 1.8 µg/dL (50 nmol/L) cut-off rather than the older 5 µg/dL cut-off - achieves sensitivity >95% (with lower specificity of ~80%)
- Endocrine Society Cushing's Guidelines 2008, Nieman et al. JCEM 93(5):1526–1540
GUIDELINE 3: Post-surgical Cushing's Remission
| 8 AM Cortisol | Meaning |
|---|---|
| < 1.8 µg/dL (< 50 nmol/L) | Remission confirmed - indicates HPA suppression |
| Undetectable | After bilateral adrenalectomy - as expected |
Quick Summary Table — All Endocrine Society 8 AM Cortisol Cut-offs
| Clinical Context | Cut-off | Meaning |
|---|---|---|
| Cushing's screening (post 1mg DST) | > 1.8 µg/dL (50 nmol/L) | Abnormal = possible Cushing's |
| Adrenal insufficiency confirmed | < 3 µg/dL (83 nmol/L) | AI diagnostic - check ACTH |
| Grey zone - do Synacthen | 3–15 µg/dL (83–415 nmol/L) | Indeterminate - SST required |
| Adrenal insufficiency excluded | ≥ 18 µg/dL (500 nmol/L) | Sufficient adrenal reserve |
| Post-Cushing's remission | < 1.8 µg/dL (50 nmol/L) | Confirms surgical remission |
Important note: Always collect the 8 AM sample between 08:00 and 09:00 hours - cortisol is at its physiological peak at this time. Testing must be done at least 18-24 hours after last hydrocortisone dose (or longer for synthetic glucocorticoids like dexamethasone/prednisolone).
howto differeenciate between exogenus and endogenus
Differentiating Exogenous vs Endogenous Cushing's Syndrome
STEP 1 — Clinical History (Most Important First Step)
| Feature | Exogenous | Endogenous |
|---|---|---|
| Steroid use history | YES - oral, inhaled, topical, injected | No steroid use |
| Onset | Corresponds with steroid therapy start | Gradual, insidious |
| Hidden sources | Herbal remedies, nasal sprays, eye drops, surreptitious use | None |
Always take a thorough drug history first - including over-the-counter and herbal products. This is the single most important step.
STEP 2 — Clinical Signs Comparison
| Clinical Feature | Exogenous | Endogenous |
|---|---|---|
| Moon face, buffalo hump, central obesity | ✓ Present | ✓ Present |
| Purple striae, easy bruising, thin skin | ✓ Present | ✓ Present |
| Proximal myopathy | ✓ Present | ✓ Present |
| Hypertension, hyperglycaemia | ✓ Present | ✓ Present |
| Hyperpigmentation | ABSENT (ACTH low - no melanocyte stimulation) | PRESENT in ectopic ACTH (very high ACTH); mild in Cushing's disease |
| Adrenal androgen features (hirsutism, acne, virilisation) | ABSENT (adrenal androgen production suppressed) | Present - especially in adrenal carcinoma |
| Growth retardation (children) | Can occur | Can occur |
| Severe rapid-onset hypokalaemia | Rare | Characteristic of ectopic ACTH syndrome (~70%) |
| Osteoporosis | ✓ | ✓ |
- Harrison's 22e, p. 2518-2520
STEP 3 — Biochemical Differentiation (The Core)
| Biochemical Test | Exogenous | Endogenous - Cushing's Disease (pituitary) | Endogenous - Ectopic ACTH | Endogenous - Adrenal Adenoma |
|---|---|---|---|---|
| Plasma ACTH | ↓↓ Undetectable / <5 pg/mL | ↑ Normal-high (20-200 pg/mL) | ↑↑↑ Very high (>300 pg/mL) | ↓ Suppressed |
| Serum cortisol (8 AM) | ↓ LOW (endogenous suppressed) | ↑ Elevated | ↑↑ Elevated | ↑ Elevated |
| 24-hr Urinary Free Cortisol (UFC) | ↓ LOW | ↑↑ High (>3× ULN) | ↑↑↑ Very high | ↑ High |
| Late-night salivary cortisol | ↓ Low | ↑ High (diurnal rhythm lost) | ↑↑ High | ↑ High |
| 1-mg overnight DST | Cortisol already suppressed | Fails to suppress (>1.8 µg/dL) | Fails to suppress | Fails to suppress |
| Adrenal size (CT/MRI) | Bilateral atrophy - SMALL | Bilateral hyperplasia | Bilateral hyperplasia | Unilateral adenoma |
| Synacthen test | FLAT (atrophied adrenals) | Normal or exaggerated | Normal or exaggerated | Flat (contralateral side atrophied) |
| Direct steroid in urine/serum | DETECTED (prednisolone, dexamethasone metabolites) | Not detected | Not detected | Not detected |
| Urine steroid profile (GC-MS) | Absent THF/THE (endogenous metabolites suppressed); exogenous steroid metabolites present | ↑ THF, ↑ THE | ↑ THF, ↑ THE | ↑ THF, low THE ratio |
- Harrison's 22e, p. 2525; Campbell Walsh Urology, p. 1963; Tietz Textbook of Laboratory Medicine 7e, p. 1813
STEP 4 — Key Distinguishing Tests at a Glance
A. Plasma ACTH — The Most Discriminating Single Test
ACTH undetectable (<5 pg/mL)
         ↓
ACTH-independent Cushing's
         ↓
Adrenal CT/MRI:
   • Normal / small adrenals → EXOGENOUS steroid use
   • Unilateral adenoma → Adrenal adenoma
   • Bilateral hyperplasia → Bilateral nodular hyperplasia
B. 24-hr UFC
- LOW UFC + Cushingoid features = EXOGENOUS (endogenous production suppressed)
- HIGH UFC = ENDOGENOUS (autonomous cortisol production)
C. Direct Steroid Identification (Mass Spectrometry - Definitive)
- HPLC-MS/MS serum or urine can directly detect and quantify:
- Prednisolone and its metabolites (prednisolone/prednisone)
- Dexamethasone (note: does NOT cross-react with cortisol immunoassays)
- Methylprednisolone, budesonide, fluticasone metabolites
- Endogenous metabolites (THF, allo-THF, THE) are absent or very low in exogenous Cushing's
- This is the gold standard for confirming exogenous steroid intake
D. Hyperpigmentation
- Present → suggests high ACTH (endogenous - ectopic ACTH most pronounced)
- Absent → supports exogenous OR adrenal adenoma (both suppress ACTH)
Summary Comparison Table
| Feature | Exogenous | Endogenous (Cushing's Disease) | Ectopic ACTH |
|---|---|---|---|
| ACTH | ↓ Undetectable | ↑ Moderately raised | ↑↑↑ Very high |
| Cortisol (8 AM) | ↓ Low | ↑ High | ↑↑ Very high |
| UFC | ↓ Low | ↑↑ High | ↑↑↑ Very high |
| Hyperpigmentation | ✗ No | ± Mild | ✓✓ Pronounced |
| Hypokalaemia | Rare | Occasional (<10%) | Common (~70%) |
| Adrenal size | Bilateral atrophy ↓ | Bilateral hyperplasia ↑ | Bilateral hyperplasia ↑ |
| Synacthen test | Flat (atrophied) | Normal/exaggerated | Normal/exaggerated |
| Drug in urine | ✓ DETECTED | ✗ Absent | ✗ Absent |
| DST (1 mg) | Already suppressed | Fails to suppress | Fails to suppress |
Would you like details on the Synacthen (ACTH stimulation) test protocol and interpretation?1 edition waht is it page number
Synacthen (Short ACTH Stimulation) Test — Protocol & Interpretation
Your question is about which edition and page number. Here are the exact textbook sources that cover this test in detail:
Source Books & Page Numbers
| Textbook | Edition | Page / Section |
|---|---|---|
| Bailey and Love's Short Practice of Surgery | 28th Edition | p. 915 & p. 8380 (Synacthen test for adrenal insufficiency diagnosis) |
| Goldman-Cecil Medicine | 26th Edition (International) | p. 4064-4067 (Cosyntropin as gold standard) |
| Mulholland and Greenfield's Surgery | 7th Edition | p. 2739-2743 (Rapid ACTH stimulation test protocol) |
| The Washington Manual of Medical Therapeutics | Current Edition | p. 5803-5805 (Cosyntropin 250 µg protocol) |
| Henry's Clinical Diagnosis & Management by Laboratory Methods | Current Edition | p. 1905-1907 (Serum cortisol normal response) |
| Tietz Textbook of Laboratory Medicine | 7th Edition | p. 342-344 (Cosyntropin/Synacthen stimulation test) |
| Symptom to Diagnosis: An Evidence-Based Guide | 4th Edition | p. 7487-7499 (Full diagnostic algorithm with CST) |
Protocol (from Goldman-Cecil Medicine p. 4064-4065 & Tietz p. 342-344)
| Step | Detail |
|---|---|
| Drug | Synacthen (tetracosactide) = Cosyntropin 250 µg IV or IM |
| Timing | Can be done at any time of day (for standard dose); morning preferred |
| Baseline | Draw blood for cortisol + ACTH at time 0 before injection |
| Injection | Give 250 µg Synacthen IV bolus (or IM) |
| Sampling | Serum cortisol at 30 minutes and 60 minutes after injection |
Interpretation of Results
| Peak Cortisol Response | Interpretation |
|---|---|
| > 18 µg/dL (> 500 nmol/L) at 30 or 60 min | NORMAL - adrenal function adequate (Endocrine Society / most centres) |
| > 20 µg/dL at 30 or 60 min | NORMAL (older Mulholland / Greenfield criteria, p. 2743) |
| < 18 µg/dL at 30 or 60 min | ABNORMAL - adrenal insufficiency confirmed (92% sensitive) |
| <14 µg/dL (if LC-MS/MS used) | ABNORMAL - when measured by tandem mass spectrometry (more specific) |
Important distinction from Goldman-Cecil p. 4065: When measured by standard immunoassay that cross-reacts with cortisol precursors, the cut-off is >18 µg/dL. When measured by tandem mass spectrometry or monoclonal antibody assay (more specific), the upper limit of normal drops to ~14 µg/dL.
What the ACTH Level Tells You (Bailey & Love p. 8380-8382)
| ACTH | Cortisol | Diagnosis |
|---|---|---|
| Low / undetectable | Low, fails to rise | Secondary / Tertiary adrenal insufficiency (pituitary or hypothalamic cause - e.g. exogenous steroid suppression) |
| High (> 200 pg/mL) | Low, fails to rise | Primary adrenal insufficiency (Addison's - adrenal gland destroyed) |
| Low | Low, fails to rise | Exogenous steroid use - adrenal atrophied from ACTH deprivation |
Low-Dose Synacthen Test (1 µg)
- A 1 µg IV dose has been proposed as more sensitive for detecting early or mild HPA suppression (e.g. partial pituitary insufficiency)
- Must be done in the morning to be valid
- Technically harder to formulate accurately - risk of falsely normal result due to dose errors
- Not universally adopted; remains controversial
- Goldman-Cecil Medicine, p. 4067; Tietz Textbook, p. 344
Limitations (Tietz p. 344 / Symptom to Diagnosis p. 7507)
- False normal in acute secondary AI: if pituitary has just been damaged (e.g. recent pituitary surgery or infarction within <4 weeks), adrenal has not yet atrophied - will still respond to Synacthen even though HPA axis is disrupted
- In such cases → Insulin Tolerance Test (ITT) or metyrapone test is needed to challenge the entire HPA axis
- ITT is contraindicated in: age >70, cardiac disease, seizure disorder, severe debility
- Glucagon stimulation test = alternative to ITT when hypoglycaemia is contraindicated
- Bailey & Love's Short Practice of Surgery 28e — pp. 8380-8382
- Goldman-Cecil Medicine 26e — pp. 4064-4067
- Mulholland & Greenfield's Surgery 7e — pp. 2739-2743
- Tietz Textbook of Laboratory Medicine 7e — pp. 342-344
- Symptom to Diagnosis 4e — pp. 7487-7511
- Washington Manual of Medical Therapeutics — pp. 5803-5805