
Ventricular fibrillations treatment
"ventricular fibrillation"[MeSH Terms] AND "defibrillation"[MeSH Terms]
ventricular fibrillation ECG waveform defibrillation treatment algorithm
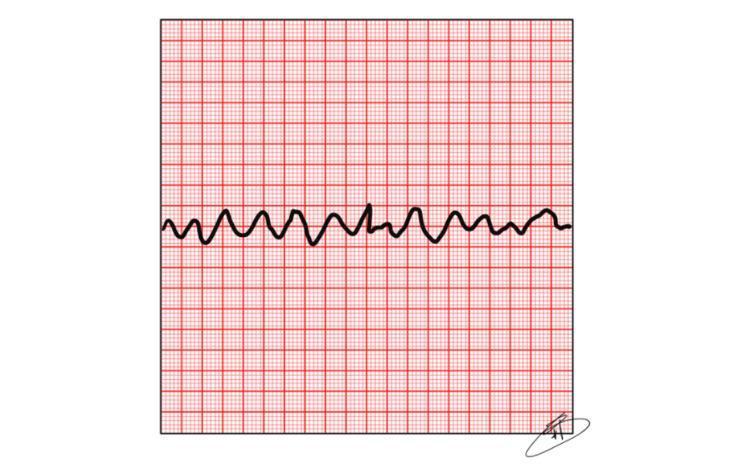
This diagnostic image shows a single-lead electrocardiogram (ECG/EKG) strip plotted on standard red grid paper, demonstrating Ventricular Fibrillation (VF). The waveform is characterized by a chaotic, irregular, and disorganized rhythm. Key morphological features include the complete absence of identifiable P waves, QRS complexes, and T waves. The tracing displays fibrillatory waves with varying amplitudes and erratic vertical deflections, indicating a lack of coordinated ventricular contraction. The amplitude of these oscillations fluctuates, generally ranging across two small grid squares relative to the isoelectric baseline. This tracing is a classic representation of a shockable cardiac arrest rhythm, emphasizing the medical importance of rapid defibrillation in Advanced Cardiovascular Life Support (ACLS) protocols. It serves as a pedagogical tool for medical students and healthcare professionals to differentiate between organized rhythms and life-threatening ventricular arrhythmias.
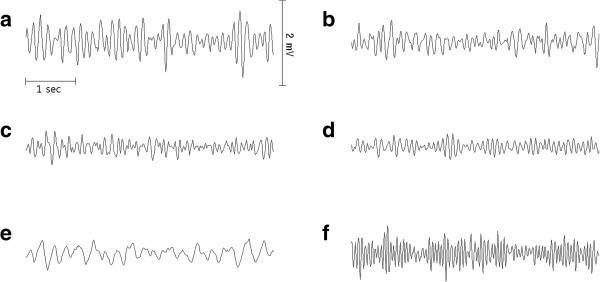
This diagnostic image displays a series of six representative 5-second electrocardiogram (ECG) waveform segments (labeled a-f) illustrating the progression of ventricular fibrillation (VF) over time. The segments correspond to 1, 4, 6, 8, 10, and 12 minutes post-VF induction. Initially (1 min), the waveform shows high-amplitude, coarse VF with disorganized but rapid electrical activity. From 4 to 10 minutes, there is a visible trend toward 'fine' ventricular fibrillation, characterized by a progressive decrease in both amplitude and dominant frequency as the myocardium becomes increasingly ischemic and depleted of ATP. At 10 minutes (panel e), the rhythm is near-isoelectric with very low amplitude. However, at 12 minutes (panel f), following the initiation of oxygenated blood perfusion, there is a stark morphological shift back to high-amplitude, high-frequency coarse VF. This sequence demonstrates the clinical significance of myocardial oxygenation and metabolic state in influencing VF morphology and the potential for successful defibrillation (often correlated with AMSA—Amplitude Mid-frequency Spectrum Analysis).

This diagnostic image is a continuous rhythm strip (ECG trace) illustrating ventricular fibrillation, a life-threatening cardiac arrhythmia. The waveform is characterized by rapid, chaotic, and disorganized electrical activity. There is a total absence of identifiable P waves, QRS complexes, and T waves. The baseline is highly irregular, showing undulating oscillations with variable amplitudes and frequencies, consistent with the coarse ventricular fibrillation pattern. Annotated labels 'Initial Rhythm' and 'Point 1' indicate specific chronological markers during the clinical event recorded by emergency medical services. This tracing serves as a classic educational example of a shockable cardiac arrest rhythm requiring immediate defibrillation. It highlights the loss of coordinated ventricular contraction and the resulting hemodynamic collapse associated with this arrhythmia.
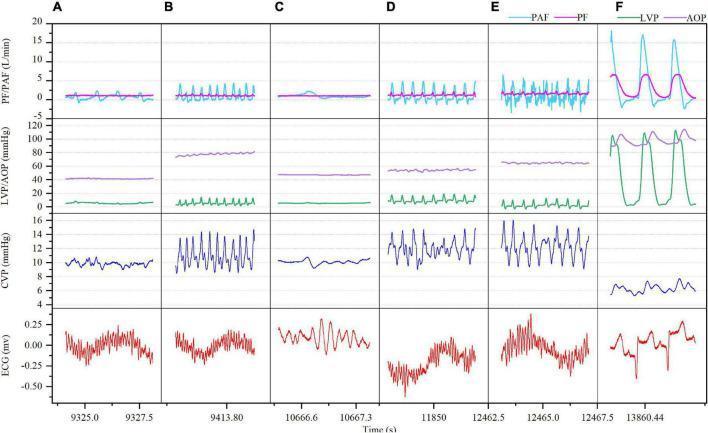
Multi-panel physiological waveform series demonstrating hemodynamic changes during ventricular fibrillation (VF) and subsequent defibrillation in the context of a continuous-flow left ventricular assist device (CF-LVAD). The image consists of a grid with six time-sequenced panels (A-F) tracking four parameters: Flow rates (PF: Pump Flow in pink, PAF: Pulmonary Artery Flow in cyan), Pressures (LVP: Left Ventricular Pressure in green, AOP: Aortic Pressure in purple), Central Venous Pressure (CVP in dark blue), and Electrocardiogram (ECG in red). Panels B-E illustrate the progression of sustained VF over 60 minutes, characterized by disorganized ECG activity and a compensatory increase in CVP amplitude and baseline (rising from ~10 to 14 mmHg). During VF, LVP and AOP remain significantly depressed with low pulsatility. Panel F displays the hemodynamic recovery post-defibrillation, showing the restoration of organized QRS complexes on ECG, a return of high-amplitude rhythmic pulsatility in LVP/AOP, and a significant reduction in CVP toward a stable baseline, signifying successful conversion to sinus rhythm and restored biventricular output.
"ventricular fibrillation" AND "cardiac arrest" AND treatment
Ventricular Fibrillation (VF) - Treatment
What is VF?
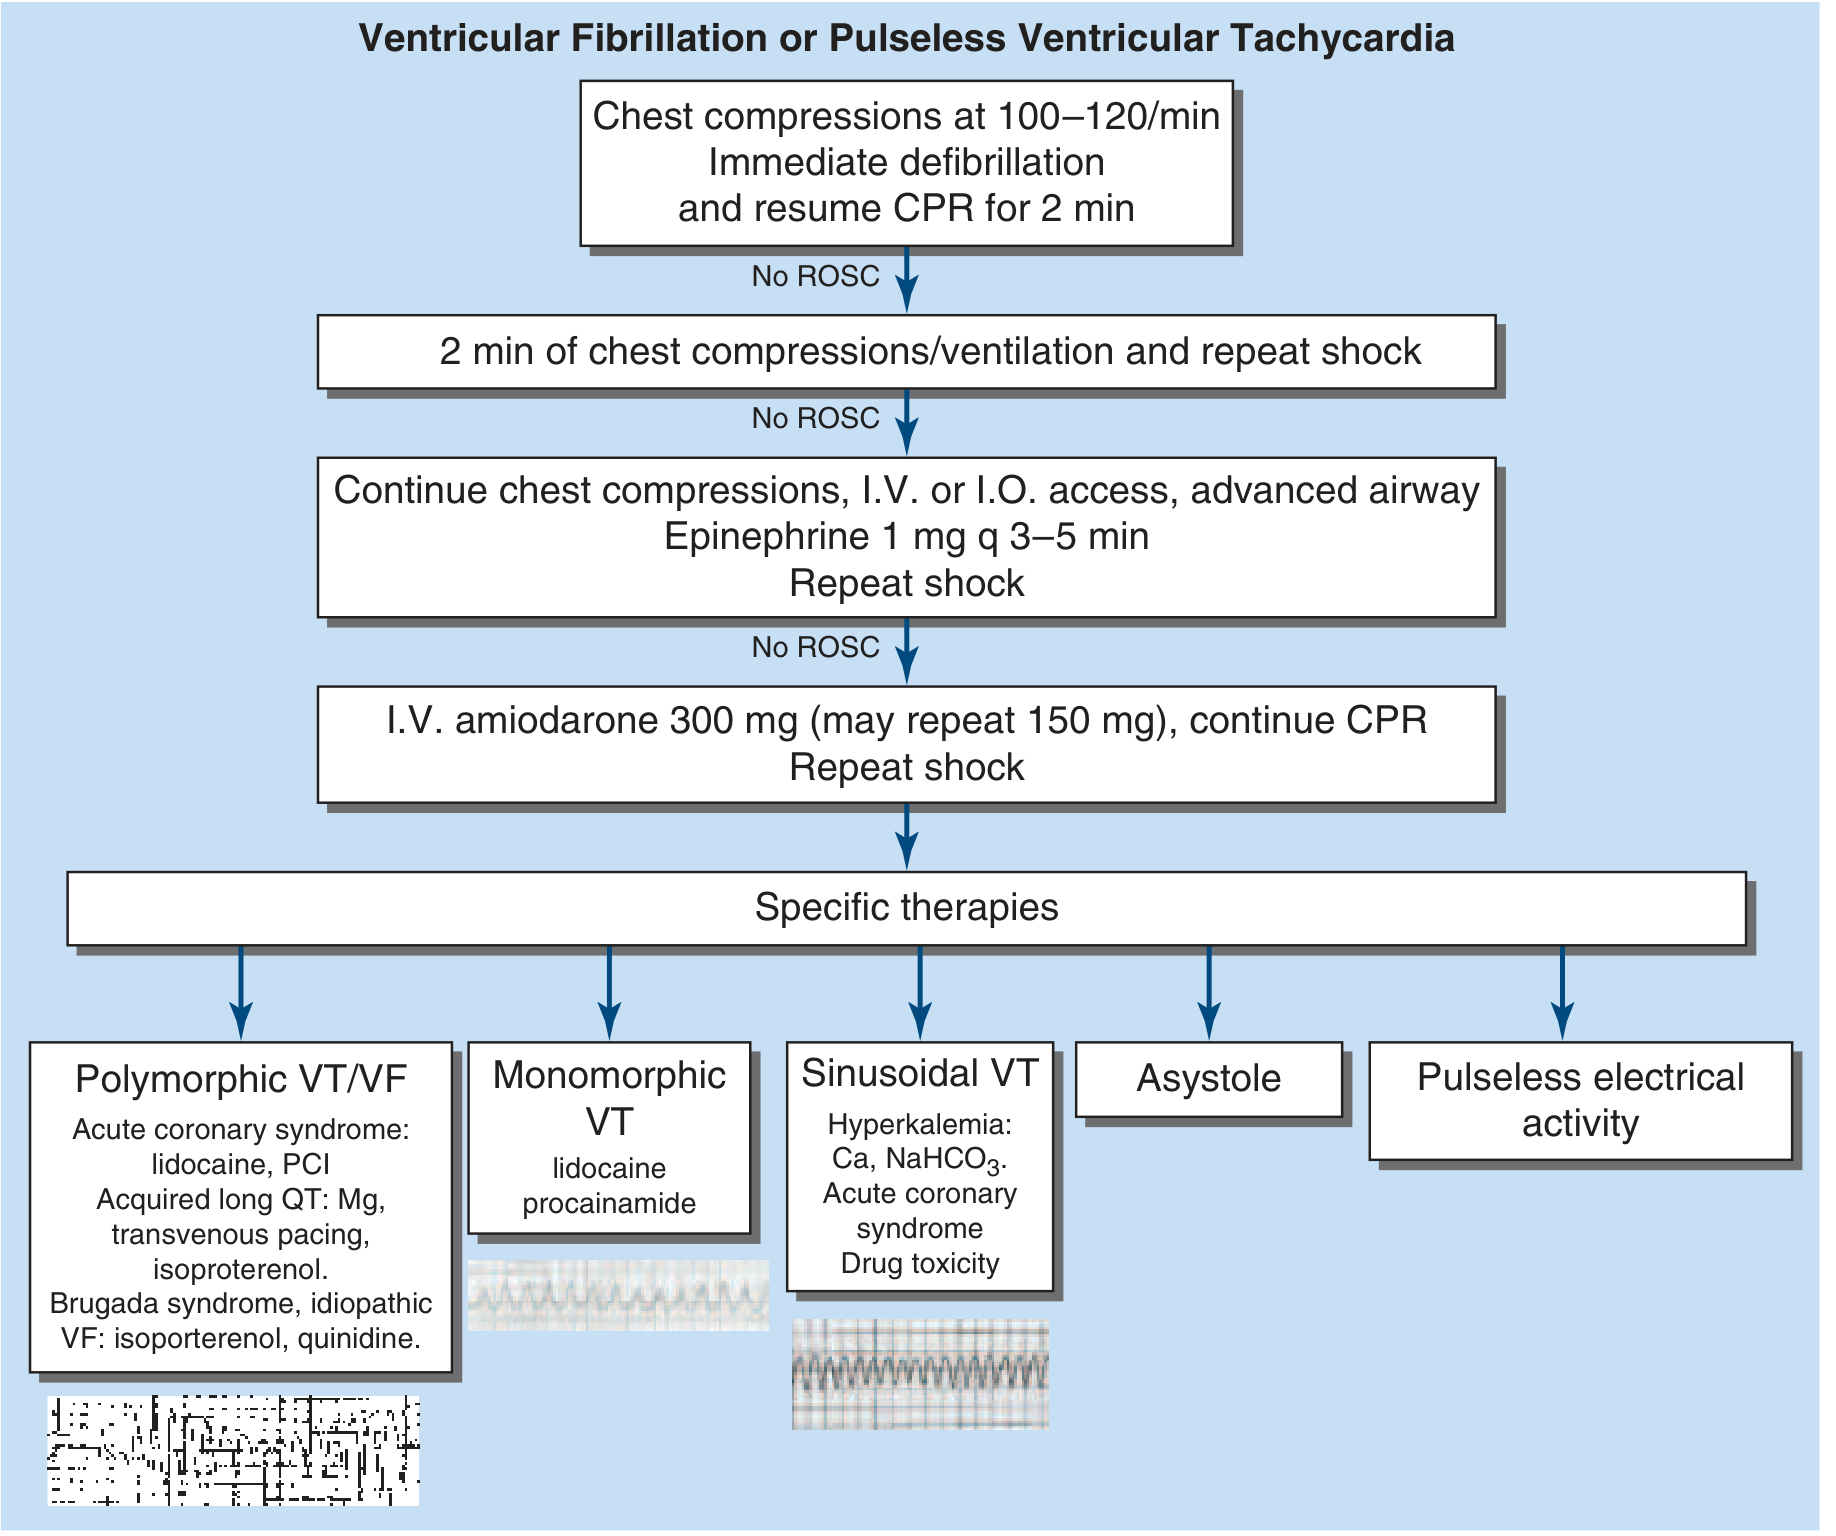
Treatment Algorithm
Step-by-Step Management
1. Immediate Recognition and CPR
- Confirm unresponsiveness, absent pulse, and VF on monitor/defibrillator
- Begin chest compressions immediately at 100-120/min, depth 5 cm (2 inches), allowing full chest recoil
- Minimize interruptions - "hands-only CPR" is acceptable for lay rescuers
- Ventilation: 2 breaths per 30 compressions if trained rescuer; continuous compressions otherwise
- Activate emergency response system (call 911/EMS)
2. Early Defibrillation (Priority #1)
- Defibrillation is the definitive treatment for VF - it is the only intervention proven to terminate VF
- Deliver a single unsynchronized shock:
- Biphasic: 120-200 J (manufacturer-recommended energy; most use 200 J initially, escalate if needed to 360 J)
- Monophasic: 360 J (fixed dose)
- Immediately resume CPR for 2 minutes after each shock - do NOT pause to check rhythm first
- Biphasic waveforms have a lower defibrillation threshold and reduce post-shock myocardial dysfunction compared to monophasic, though neither has proven superiority for ROSC or survival to discharge
3. Vascular Access and Vasopressors
- Establish IV or intraosseous (IO) access as soon as possible without interrupting CPR
- Epinephrine 1 mg IV/IO - repeat every 3-5 minutes
- Mechanism: alpha-1 vasoconstriction increases coronary perfusion pressure; allows drug to reach central circulation
- Allow at least 30-60 seconds of CPR after drug administration before the next shock
- Place defibrillation pads early so shocks can be delivered without pausing compressions
4. Antiarrhythmic Drugs (Shock-Refractory VF)
| Drug | Dose | Notes |
|---|---|---|
| Amiodarone (first-line) | 300 mg IV push, then 150 mg if needed | Class III antiarrhythmic; lowers defibrillation threshold |
| Lidocaine (alternative) | 1-1.5 mg/kg IV; repeat 0.5-0.75 mg/kg every 5-10 min (max 3 mg/kg) | Use if amiodarone unavailable or contraindicated |
| Magnesium sulfate | 1-2 g IV | Only for torsades de pointes or hypomagnesemia-associated VF |
5. Advanced Airway
- Endotracheal intubation or supraglottic airway when feasible, with minimal interruption of chest compressions
Special Situations and Cause-Specific Therapies
| Condition | Treatment |
|---|---|
| Polymorphic VT/VF + Acute Coronary Syndrome | Lidocaine, emergent PCI/coronary revascularization |
| Torsades de Pointes (acquired long QT) | Magnesium 1-2 g IV, transvenous pacing, isoproterenol |
| Brugada Syndrome / Idiopathic VF | Isoproterenol, quinidine |
| Hyperkalemia-induced VF | Calcium gluconate, sodium bicarbonate |
| WPW-related VF | Avoid AV nodal blockers; electrical cardioversion |
| Hypothermia | Active rewarming; VF may be refractory until core temp >30°C |
Refractory VF (3 or More Failed Shocks)
- Double Sequential External Defibrillation (DSED): Two sets of defibrillation pads placed (standard apex-sternum + anterior-posterior), both charged to maximum, simultaneous shock delivery. Theorized to reduce VF threshold and override the refractory period. Appropriate after quality CPR and multiple failed defibrillations.
- Address reversible causes (H's and T's):
- H's: Hypoxia, Hypovolemia, Hydrogen ion (acidosis), Hypo/Hyperkalemia, Hypothermia
- T's: Tension pneumothorax, Tamponade, Toxins, Thrombosis (PE or MI)
Post-Cardiac Arrest Care (After ROSC)
- 12-lead ECG immediately - assess for ST-elevation MI; emergent coronary angiography + PCI if STEMI present
- Hemodynamic stabilization: Target systolic BP >90 mmHg, mean arterial pressure >65 mmHg; vasopressors if needed
- Targeted Temperature Management (TTM): For comatose survivors, maintain temperature 32-36°C (evidence of neuroprotection); active prevention of fever (>37.7°C) is now the minimum standard per 2025 AHA guidelines
- Neurological monitoring: Brain injury accounts for >2/3 of post-ROSC deaths; multimodal prognostication at 72 hours
- Optimize ventilation: Avoid hypoxia and hypercapnia; target PaO2 94-98%, normocapnia
- Treat electrolyte abnormalities: Correct hypokalemia (target K >4 mEq/L), hypomagnesemia, and acidosis
Long-Term Secondary Prevention
- Implantable Cardioverter-Defibrillator (ICD) - mainstay of secondary prevention; reduces recurrent SCD
- Oral antiarrhythmics: Amiodarone as adjunct to ICD; sotalol in structural heart disease
- Treat underlying cause: Coronary revascularization for ischemic VF; guideline-directed medical therapy for cardiomyopathy; catheter ablation for channelopathy-related or scar-mediated VF
- Genetic evaluation if no structural heart disease is found (long QT, Brugada, CPVT, HCM screening)
Recent Evidence (2025 AHA Guidelines)
Types of Myocardial infarction
types of myocardial infarction classification STEMI NSTEMI universal definition pathology
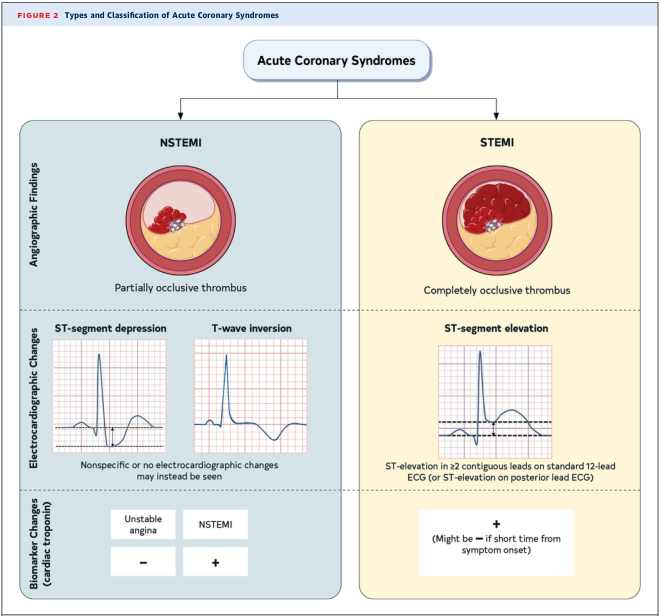
Summary : This figure presents the types and classification of Acute Coronary Syndromes, contrasting NSTEMI (Non-ST-Elevation Myocardial Infarction) and STEMI (ST-Elevation Myocardial Infarction) based on angiographic findings, electrocardiographic changes, and cardiac biomarker changes. flowchart: # Main Categories : • Acute Coronary Syndromes (central node) – Branches into: NSTEMI (left), STEMI (right) # NSTEMI : ## Angiographic Findings : • Illustration of a coronary artery with a partially occlusive thrombus. • Label: "Partially occlusive thrombus" ## Electrocardiographic Changes : • ST-segment depression (example ECG tracing) • T-wave inversion (example ECG tracing) • Note: "Nonspecific or no electrocardiographic changes may instead be seen" ## Biomarker Change (cardiac troponin) : • Unstable angina: negative (–) • NSTEMI: positive (+) # STEMI : ## Angiographic Findings : • Illustration of a coronary artery with a completely occlusive thrombus. • Label: "Completely occlusive thrombus" ## Electrocardiographic Changes : • ST-segment elevation (example ECG tracing) • Note: "ST-elevation in ≥2 contiguous leads on standard 12-lead ECG (or ST-elevation on posterior lead ECG)" ## Biomarker Change (cardiac troponin) : • Positive (+) • Note: "Might be – if short time from symptom onset" # Layout : • Two-column comparison: NSTEMI (blue background, left), STEMI (yellow background, right) • Each column subdivided into three horizontal sections: Angiographic Findings, Electrocardiographic Changes, Biomarker Change # Analysis : • NSTEMI is characterized by partial thrombus occlusion, ST-segment depression or T-wave inversion (or nonspecific ECG changes), and positive cardiac troponin. • STEMI is defined by complete thrombus occlusion, ST-segment elevation on ECG, and positive cardiac troponin (may be negative early after symptom onset). • The figure visually distinguishes the pathophysiology, ECG findings, and biomarker profiles of NSTEMI and STEMI, aiding in clinical differentiation.
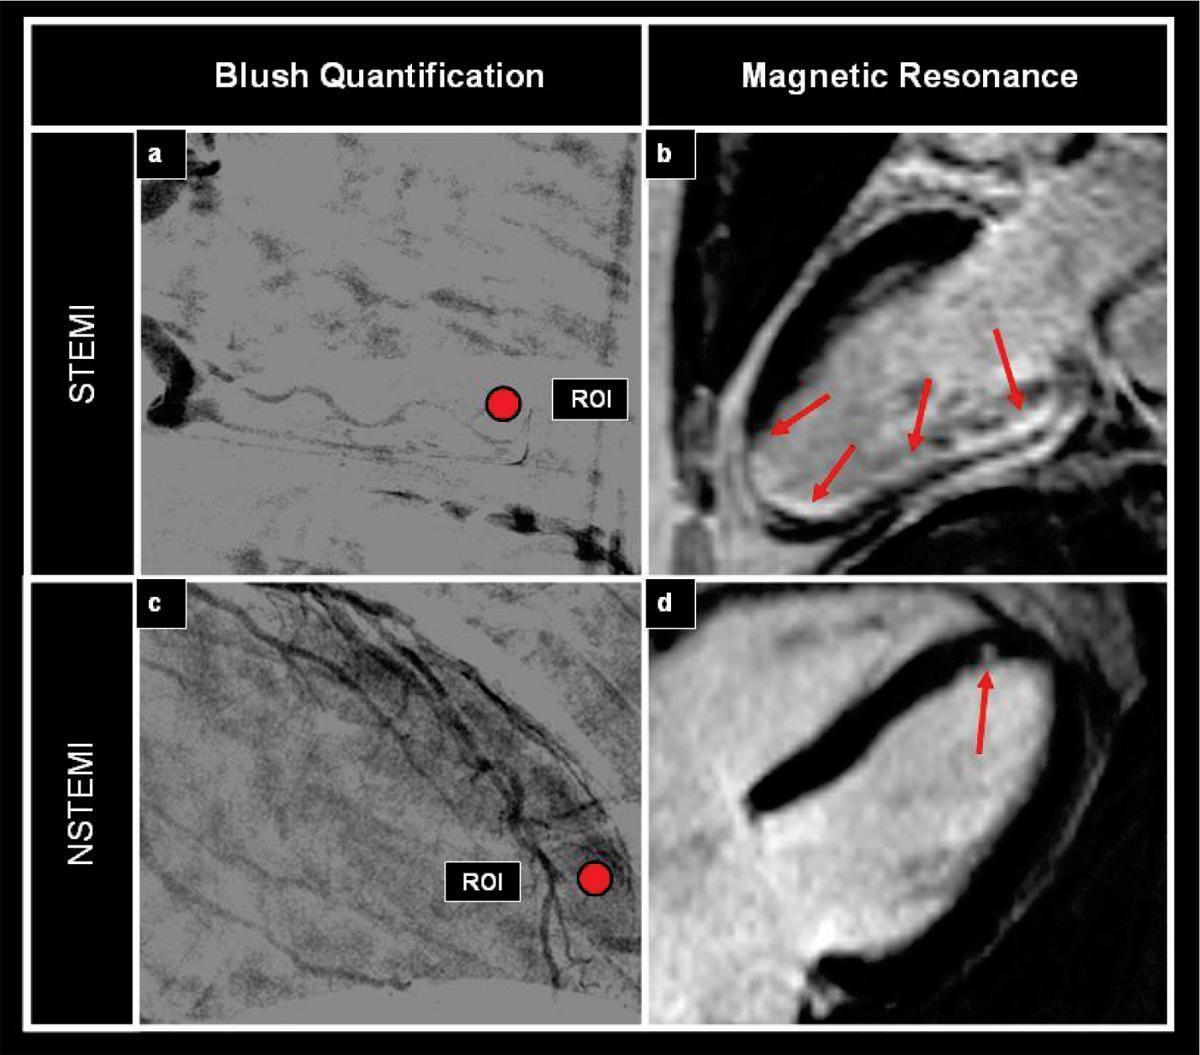
A comparative diagnostic image panel illustrating differences between ST-elevation myocardial infarction (STEMI) and non-ST-elevation myocardial infarction (NSTEMI) using angiographic blush quantification and cardiac magnetic resonance (CMR). The top row (a, b) displays STEMI findings: (a) an angiographic frame with a circular red Region of Interest (ROI) showing reduced myocardial blush, and (b) a delayed-enhancement CMR image showing extensive hyperenhancement (red arrows) indicating a large transmural inferior wall infarct. The bottom row (c, d) displays NSTEMI findings: (c) an angiographic frame with higher myocardial blush density within the ROI, and (d) a delayed-enhancement CMR image showing a small, localized area of subendocardial hyperenhancement (red arrow) in the anterior wall. The visual comparison highlights the greater infarct size and transmurality associated with STEMI compared to the smaller, non-transmural nature of NSTEMI, as well as the corresponding differences in microvascular perfusion (blush) between the two clinical presentations.
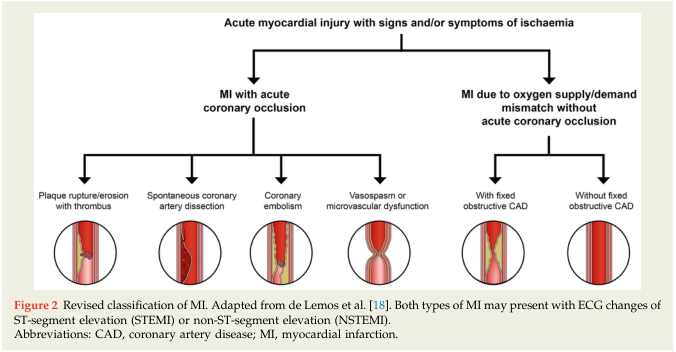
Summary : This flowchart presents a revised classification of myocardial infarction (MI) based on the presence or absence of acute coronary occlusion and the underlying mechanisms, as adapted from de Lemos et al. It visually distinguishes between MI with acute coronary occlusion and MI due to oxygen supply/demand mismatch without acute coronary occlusion, further subdividing each category by specific pathophysiological causes. flowchart: # Main Categories : • Acute myocardial injury with signs and/or symptoms of ischaemia (top-level node). • Two primary branches: – MI with acute coronary occlusion. – MI due to oxygen supply/demand mismatch without acute coronary occlusion. # MI with Acute Coronary Occlusion (Left Branch) : • Plaque rupture/erosion with thrombus (circular illustration showing narrowed artery with thrombus). • Spontaneous coronary artery dissection (circular illustration showing dissection in artery wall). • Coronary embolism (circular illustration showing embolic obstruction). • Vasospasm or microvascular dysfunction (circular illustration showing narrowed vessel due to spasm). # MI Due to Oxygen Supply/Demand Mismatch Without Acute Coronary Occlusion (Right Branch) : • With fixed obstructive CAD (circular illustration showing narrowed artery with stable plaque). • Without fixed obstructive CAD (circular illustration showing normal or non-obstructed artery). # Connectors : • Downward arrows from the top node to the two main branches. • Further downward arrows from each main branch to their respective subcategories. # Layout : • Hierarchical, top-down structure. • Two main branches split horizontally, each with multiple subcategories depicted with icons/illustrations. # Technical Details : • Figure legend notes that both MI types may present with ECG changes of ST-segment elevation (STEMI) or non-ST-segment elevation (NSTEMI). • Abbreviations: CAD = coronary artery disease; MI = myocardial infarction. Analysis : • The flowchart clarifies that MI can result from either acute coronary occlusion (with several distinct mechanisms) or from an imbalance in oxygen supply and demand without acute occlusion, with or without underlying coronary artery disease. • Visual icons help differentiate the pathophysiological processes, emphasizing the heterogeneity of MI causes. • The structure supports clinical differentiation for diagnosis and management.
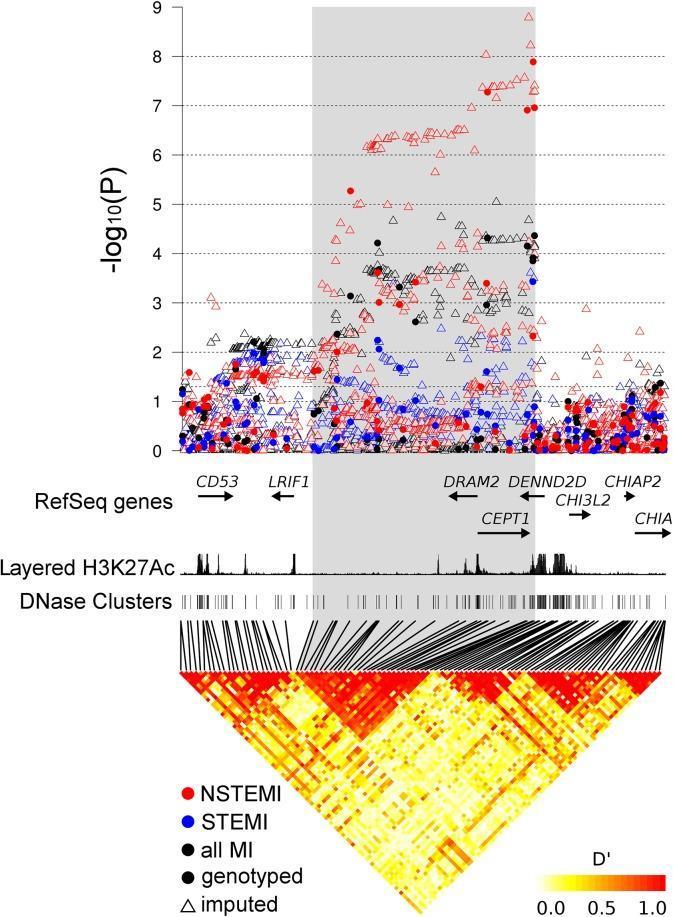
A multi-track genomic visualization showing the association of genetic variants at the 1p13.3 locus with myocardial infarction (MI) phenotypes. The top panel is a regional Manhattan-style plot displaying -log10(P) values for NSTEMI (red), STEMI (blue), and all MI (black) cases, distinguishing between genotyped (filled circles) and imputed (hollow triangles) variants. A gray shaded region highlights a cluster of high significance specifically for NSTEMI, with P-values reaching nearly 10^-9. Below the association plot, tracks display RefSeq genes including CD53, LRIF1, DRAM2, CEPT1, and DENND2D, alongside ENCODE regulatory annotations: Layered H3K27Ac peaks (marker of active enhancers/promoters) and DNase I hypersensitivity clusters (marker of open chromatin). The bottom track presents a Linkage Disequilibrium (LD) heat map using the D' statistic, revealing a distinct red block of high LD that corresponds spatially with the NSTEMI-associated variants and the DRAM2/CEPT1 gene region. This visual integration suggests a potential regulatory role of the identified variants in the pathogenesis of non-ST-elevation myocardial infarction.
"myocardial infarction"[MeSH Terms] AND "classification"[MeSH Terms]
Types of Myocardial Infarction
Framework 1: ECG-Based Classification (Clinical Presentation)
STEMI (ST-Elevation Myocardial Infarction)
- Pathology: Complete, total occlusion of an epicardial coronary artery by atherosclerotic plaque rupture/erosion + thrombus
- ECG: ST-segment elevation in ≥2 contiguous leads (or new LBBB)
- Extent: Typically transmural ischemia (full thickness of myocardial wall)
- Biomarkers: Troponin positive (may be negative in the very early hours)
- Treatment priority: Emergency reperfusion (primary PCI within 90 minutes, or thrombolytics within 30 minutes if PCI unavailable)
NSTEMI (Non-ST-Elevation Myocardial Infarction)
- Pathology: Partial/incomplete coronary occlusion; partially occlusive thrombus
- ECG: ST-segment depression, T-wave inversion, or nonspecific/no ECG changes
- Extent: Typically subendocardial (inner layers of myocardium)
- Biomarkers: Troponin positive (distinguishes NSTEMI from unstable angina, where troponin is negative)
- Treatment: Early invasive strategy; urgent PCI within 24-72 hours
Unstable Angina (UA)
- Ischemic symptoms at rest or with minimal exertion
- No troponin elevation (no myocyte necrosis)
- Managed similarly to NSTEMI but without confirmed infarction
Note: Previous terms "Q-wave MI" and "non-Q-wave MI" or "transmural" vs "subendocardial" MI have been abandoned - they did not adequately describe coronary pathophysiology or predict outcomes. STEMI and NSTEMI are the current standard. - Harrison's Principles of Internal Medicine 22e; Rosen's Emergency Medicine
Framework 2: Fourth Universal Definition - 5 Etiological Types
Type 1 - Spontaneous MI (Atherothrombotic)
- Mechanism: Atherosclerotic plaque rupture, ulceration, fissuring, erosion, or dissection → intraluminal thrombosis → decreased myocardial blood flow or distal platelet emboli → myocyte necrosis
- Coronary status: Usually severe CAD, but occasionally nonobstructive or no CAD (MINOCA - MI with Non-Obstructive Coronary Arteries)
- Management: Invasive strategy, PCI; MINOCA managed medically
- The most common type; classic "heart attack"
Type 2 - MI Secondary to Ischemic Imbalance
- Mechanism: Supply-demand mismatch - NOT due to primary atherothrombosis, but a condition that either reduces myocardial oxygen supply or increases demand
- Causes include:
- Coronary artery spasm / vasospasm
- Coronary embolism
- Spontaneous coronary artery dissection (SCAD)
- Tachyarrhythmia or bradyarrhythmia
- Anemia
- Respiratory failure / hypoxia
- Hypotension or hypertension (with/without LV hypertrophy)
- Coronary endothelial dysfunction
- Key point: Management depends entirely on the underlying cause, not on the same protocol as Type 1
- - Tietz Textbook of Laboratory Medicine 7e; Fuster and Hurst's The Heart 15e
Type 3 - MI Resulting in Death When Biomarkers Are Unavailable
- Cardiac death with symptoms suggestive of myocardial ischemia AND presumed new ischemic ECG changes or new LBBB
- Death occurs before blood samples could be obtained OR before cardiac biomarkers could rise
- In rare cases, biomarkers were not collected at all
- A diagnosis made retrospectively or at autopsy
Type 4 - PCI-Related MI
| Subtype | Definition |
|---|---|
| Type 4a - PCI-related | Troponin elevation >5× the 99th percentile URL (in patients with normal baseline), PLUS at least one of: ischemic symptoms, new ECG changes/LBBB, angiographic loss of patency/slow flow/embolism, or imaging evidence of new infarction |
| Type 4b - Stent thrombosis | MI detected by angiography or autopsy in the setting of ischemia, with troponin rise/fall with at least one value above 99th percentile URL |
| Type 4c - Restenosis | MI associated with focal restenosis or diffuse in-stent restenosis on angiography |
Type 5 - CABG-Related MI
- Criterion: Troponin elevation >10× the 99th percentile URL in patients with normal baseline values, PLUS at least one of:
- New pathologic Q waves or new LBBB
- Angiographically documented new graft or new native coronary artery occlusion
- Imaging evidence of new loss of myocardium or new regional wall motion abnormality
- The very high troponin threshold accounts for the fact that cardiac surgery invariably causes some degree of myocardial injury
Framework 3: Pathological/Anatomical Classification
| Category | Description |
|---|---|
| Transmural MI | Necrosis spanning the full thickness of the ventricular wall; usually associated with complete coronary occlusion; classically produces pathologic Q waves |
| Subendocardial MI | Necrosis confined to the inner 1/3 to 1/2 of myocardial wall; associated with partial occlusion or supply-demand mismatch; usually no Q waves |
| Q-wave MI | Historical term; correlates roughly with transmural infarction; Q waves may disappear over time |
| Non-Q-wave MI | Historical term; correlates roughly with subendocardial infarction; now replaced by NSTEMI |
Note: These older terms are imprecise - Q waves can appear in NSTEMI and be absent in STEMI. Modern CMR imaging has shown that transmurality and Q-wave presence do not always correlate. - Harrison's Principles of Internal Medicine 22e
By Territory / Location
| Location | Culprit Artery | Leads Affected |
|---|---|---|
| Anterior MI | LAD (Left Anterior Descending) | V1-V4 |
| Anteroseptal MI | Proximal LAD | V1-V3 |
| Lateral MI | LCx (Left Circumflex) | I, aVL, V5-V6 |
| Inferior MI | RCA (Right Coronary Artery) | II, III, aVF |
| Posterior MI | RCA or LCx | Tall R in V1-V2; ST depression V1-V3 (reciprocal); ST elevation in V7-V9 |
| Right Ventricular MI | Proximal RCA | ST elevation in right-sided leads (V3R, V4R) |
Summary Table: Universal Classification
| Type | Name | Key Feature | Troponin Threshold |
|---|---|---|---|
| 1 | Spontaneous | Plaque rupture/thrombus | >99th percentile URL |
| 2 | Ischemic imbalance | Supply-demand mismatch | >99th percentile URL |
| 3 | Death before biomarkers | Presumed ischemic death | N/A (unavailable) |
| 4a | PCI-related | Procedure complication | >5× URL |
| 4b | Stent thrombosis | Confirmed by angiography | >99th percentile URL |
| 5 | CABG-related | Surgery complication | >10× URL |
Clinical Relevance: Why Type Matters
- Type 1 → Antiplatelet therapy (aspirin + P2Y12 inhibitor), anticoagulation, PCI
- Type 2 → Treat the underlying cause (control rate in arrhythmia, transfuse for anemia, relieve bronchospasm, etc.) - antiplatelet therapy may not be indicated
- Type 3 → Autopsy/forensic context; presumptive treatment if any resuscitation attempted
- Types 4-5 → Peri-procedural monitoring and prevention; different biomarker thresholds prevent over-diagnosis from normal surgical myocardial injury
- MINOCA (a subset of Type 1/2) → Requires coronary angiography, ventriculography, and cardiac MRI to identify the mechanism; managed differently from obstructive CAD