
Osmosis
What aspect of osmosis are you interested in?
osmosis diagram semipermeable membrane water movement
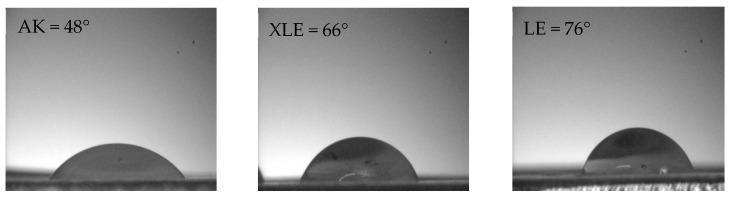
This diagnostic comparison image illustrates the surface hydrophilicity of three different loose reverse osmosis (RO) membranes—AK, XLE, and LE—via water contact angle measurements. The content consists of three grayscale goniometer frames showing water droplets on flat-sheet membrane surfaces. 1. The AK membrane displays a contact angle of 48°, showing the most significant droplet spreading and a flatter morphology, indicating the highest degree of hydrophilicity among the set. 2. The XLE membrane exhibits an intermediate contact angle of 66°, with the droplet showing a more defined hemispherical shape. 3. The LE membrane demonstrates the largest contact angle at 76°, where the droplet appears most spherical, reflecting lower wetting and relatively lower hydrophilicity. In biomedical engineering and laboratory medicine contexts, these measurements are critical for assessing membrane fouling resistance and permeability during the separation of clinical analytes, such as lactic acid or salts, from biological fluids.
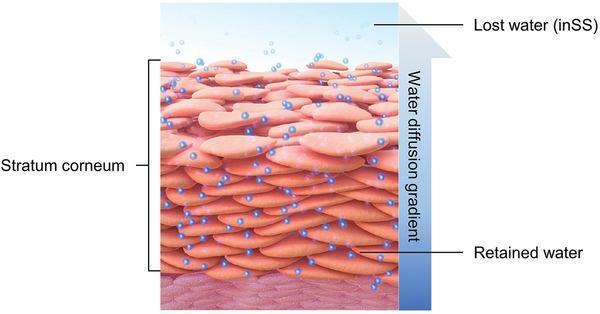
This medical pathophysiology diagram provides a schematic representation of the stratum corneum and the mechanisms of skin hydration. The stratum corneum is depicted as a series of stacked, flattened, pinkish-orange corneocytes arranged in a 'bricks-and-mortar' fashion to form the primary epidermal barrier. Small blue spheres represent water molecules, illustrating the concept of insensible sweat (inSS). At the base of the stratum corneum, adjacent to the deeper epidermis, there is a high concentration of spheres labeled 'Retained water.' A blue vertical arrow on the right side, labeled 'Water diffusion gradient,' indicates the upward movement of water. The concentration of water molecules decreases as they move toward the surface, where they are labeled as 'Lost water (inSS)' as they evaporate into the environment. The diagram highlights the semipermeable nature of the skin barrier and the physiological process of transepidermal water loss, essential for understanding dermatological health, barrier function, and skin hydration maintenance.
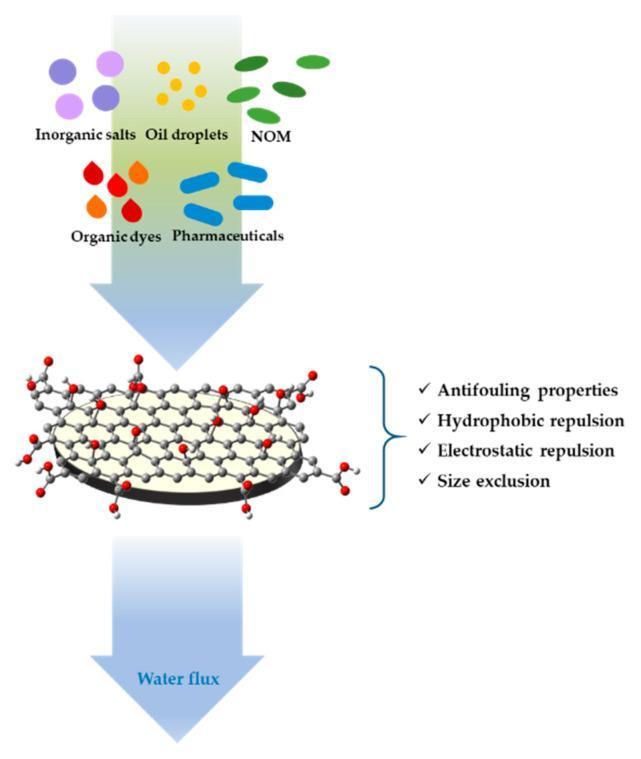
A schematic diagram illustrating the mechanism of water purification and contaminant retention using a Graphene Oxide (GO) coated Ultrafiltration (UF) membrane. The illustration shows a vertical flow process where untreated water containing various contaminants is directed toward the membrane. The contaminants are categorized and visually represented as follows: inorganic salts (purple circles), oil droplets (yellow spheres), Natural Organic Matter (NOM, green ovals), organic dyes (red and orange droplets), and pharmaceuticals (blue capsule-shaped icons). The membrane is depicted as a molecular lattice of graphene oxide, characterized by functionalized carbon rings. The right side of the diagram highlights four key mechanisms of the GO coating: antifouling properties, hydrophobic repulsion, electrostatic repulsion, and size exclusion. A downward arrow beneath the membrane signifies the resulting 'Water flux,' representing the purified filtrate. This diagram demonstrates the application of nanotechnology and smart materials in environmental health and biomedical engineering for the removal of complex chemical and pharmaceutical impurities.
Osmosis - Basic Concept & Mechanism
Definition
The Core Mechanism
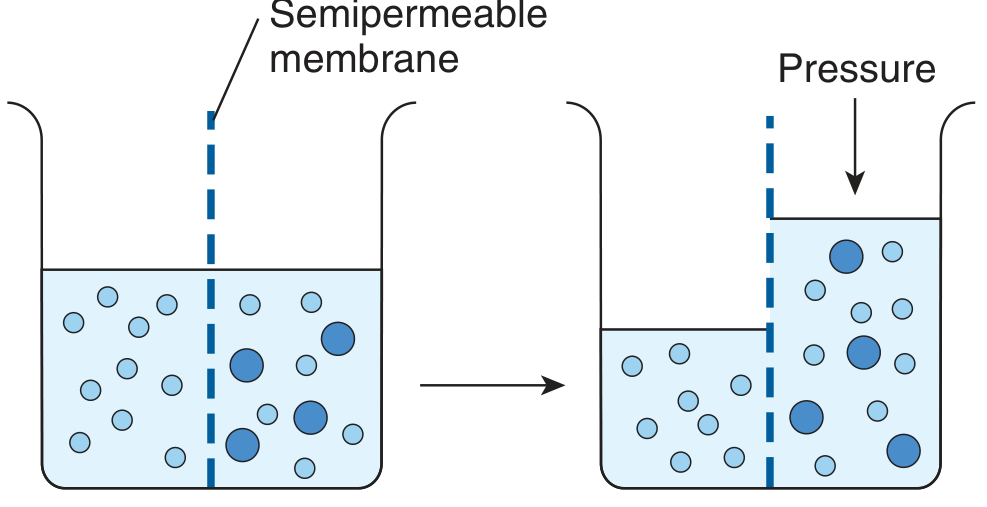
Step-by-step:
- Selective permeability: The membrane is freely permeable to water but NOT to solutes (e.g., NaCl, glucose).
- Reduced water concentration: Adding solute to one side displaces water molecules, reducing their effective concentration on that side.
- Net water flux: More water molecules strike (and pass through) the channel on the pure-water side than on the solute side - so net movement is toward the solute side.
- Equilibrium: Water moves until concentrations equalize OR until back-pressure opposes further movement.
Osmotic Pressure
P = nRT/V (or equivalently, P = CRT)
- P = osmotic pressure
- n = number of osmotically active particles
- R = gas constant (0.082 L·atm/mol·K)
- T = absolute temperature (Kelvin)
- V = volume of solution
Osmoles and Osmolarity
| Term | Definition |
|---|---|
| Osmole (Osm) | Gram-molecular weight of a substance / number of freely moving particles it releases in solution |
| Osmolarity | Osmoles per liter of solution (Osm/L or mOsm/L) |
| Osmolality | Osmoles per kilogram of water (Osm/kg) |
Key example - NaCl dissociation:
- NaCl (MW = 58.5 g/mol) dissociates into Na⁺ + Cl⁻ = 2 osmoles per mole
- A 0.9% NaCl solution = 9 g/L ÷ 58.5 g/mol × 2 = ~308 mOsm/L (potential)
- After correcting with the osmotic coefficient (~0.93 for NaCl): ~286 mOsm/L actual
Osmolarity of Body Fluids
| Compartment | Approximate Osmolarity | Major Contributors |
|---|---|---|
| Plasma | ~300 mOsm/L | Na⁺, Cl⁻ (~80% of total) |
| Interstitial fluid | ~300 mOsm/L | Na⁺, Cl⁻ |
| Intracellular fluid | ~300 mOsm/L | K⁺ (~half), + many other substances |
Key Points to Remember
- Water moves toward higher solute concentration (down its own concentration gradient)
- Cell membranes are highly permeable to water but relatively impermeable to most solutes
- Enormous amounts of water cross cell membranes constantly (~100x cell volume/second in red blood cells) - but net flux is zero under normal conditions
- If extracellular NaCl rises, water leaves cells → cells shrink
- If extracellular NaCl falls, water enters cells → cells swell
- The osmotic pressure of normal body fluids is approximately 5,944 mm Hg (potential) - enormous, which is why even small osmolarity changes drive significant water shifts - Guyton and Hall