
Ecg intruption with pictures
Reading File
Now let me search the medical library for ECG interpretation content with images.
Finding Sources
Finding Sources
Finding Sources
Reading File
Reading File
Finding Sources
Reading File
Reading File
Now let me fetch the key ECG images from Harrison's and Ganong's to display them visually.
Loading Image
Loading Image
Loading Image
Reading File
Loading Image
Reading File
Loading Image
Loading Image
Reading File
Reading File
Loading Image
Loading Image
Now I have all the key images and content. Let me compile a comprehensive, well-illustrated ECG interpretation guide.
ECG Interpretation - A Complete Visual Guide
Sources: Harrison's Principles of Internal Medicine 22E (2025) & Ganong's Review of Medical Physiology
1. What is an ECG?
An electrocardiogram (ECG) records the electrical activity of the heart from 12 different viewpoints (leads). Each lead "looks" at the heart from a different angle, which is why the same beat looks different in each lead. The standard 12-lead ECG includes:
- Limb leads: I, II, III (bipolar) and aVR, aVL, aVF (augmented unipolar)
- Precordial leads: V1-V6 (chest leads, shown in the diagram below)
2. Lead Placement & Normal ECG Appearance
The precordial leads (V1-V6) are placed across the chest wall. Each electrode sees a different face of the heart, and the resulting waveform shape changes progressively from V1 to V6:
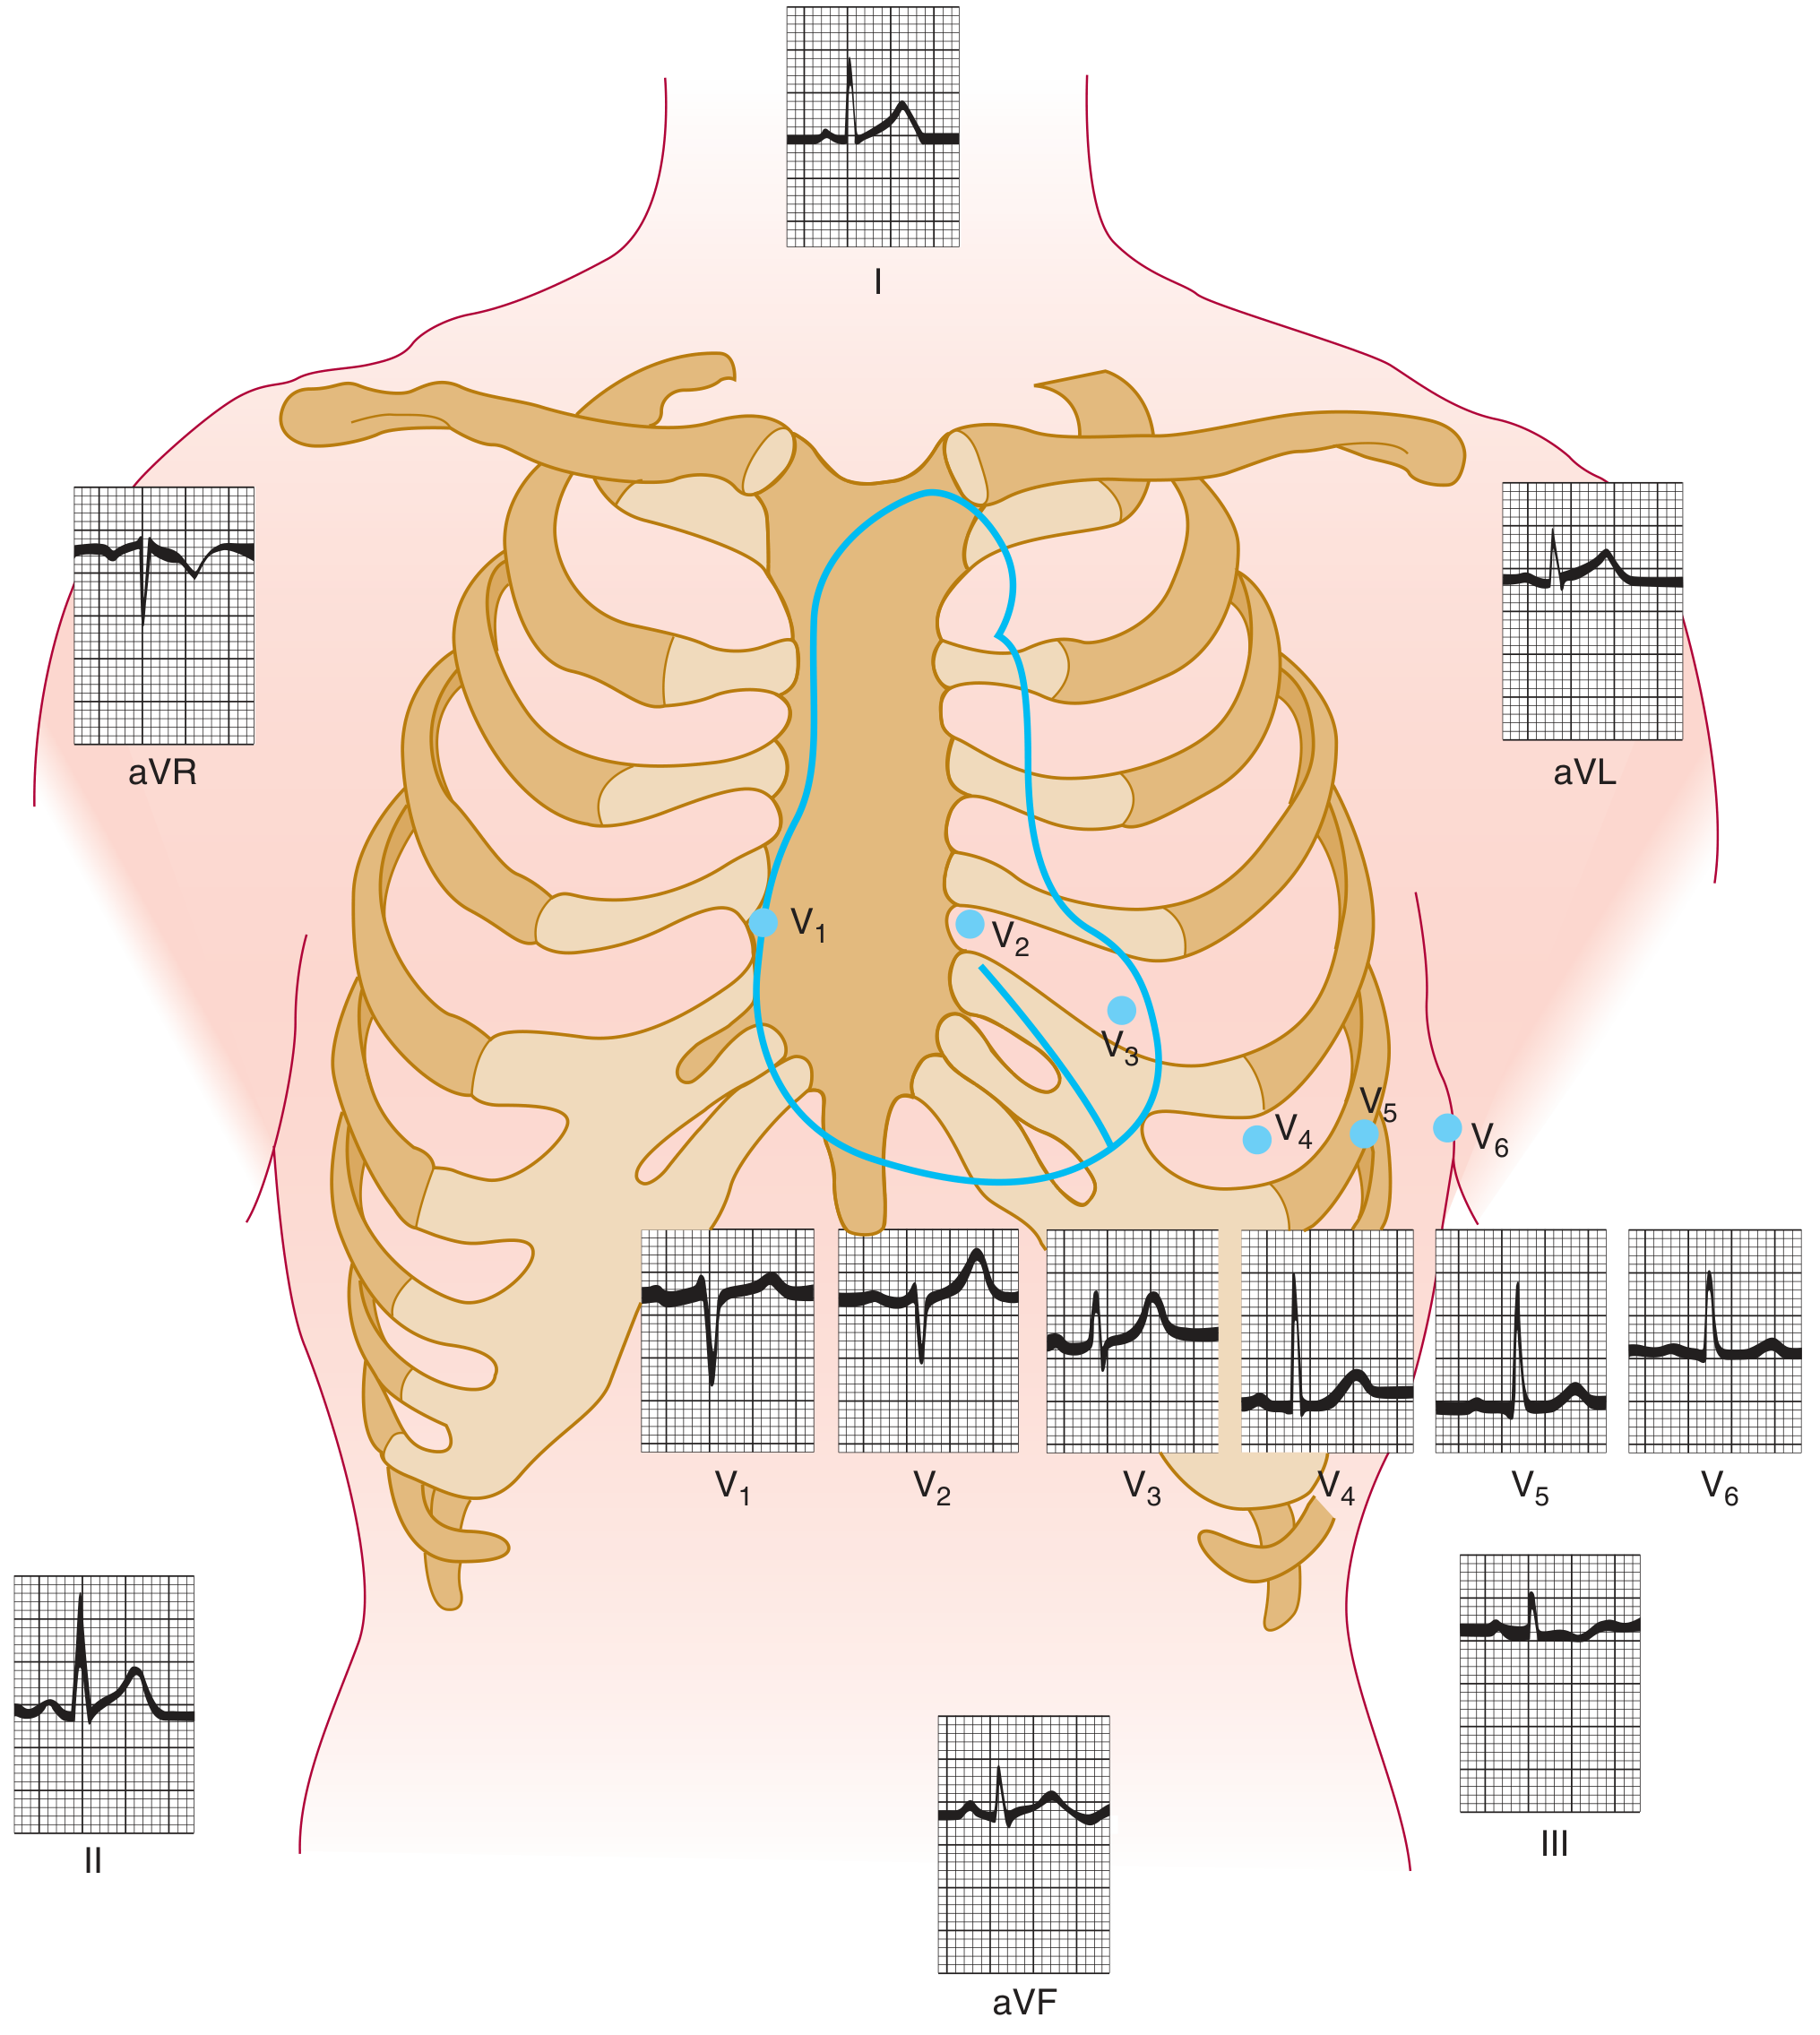
Normal ECG tracings showing each lead position and the corresponding waveform. Note how the QRS morphology transitions from a small r-wave in V1 to a dominant R-wave in V5-V6 (the "R-wave progression").
3. The Cardiac Axis (Einthoven's Triangle)
The mean QRS axis describes the overall direction of ventricular electrical spread in the frontal plane. Normal axis is -30° to +100°.
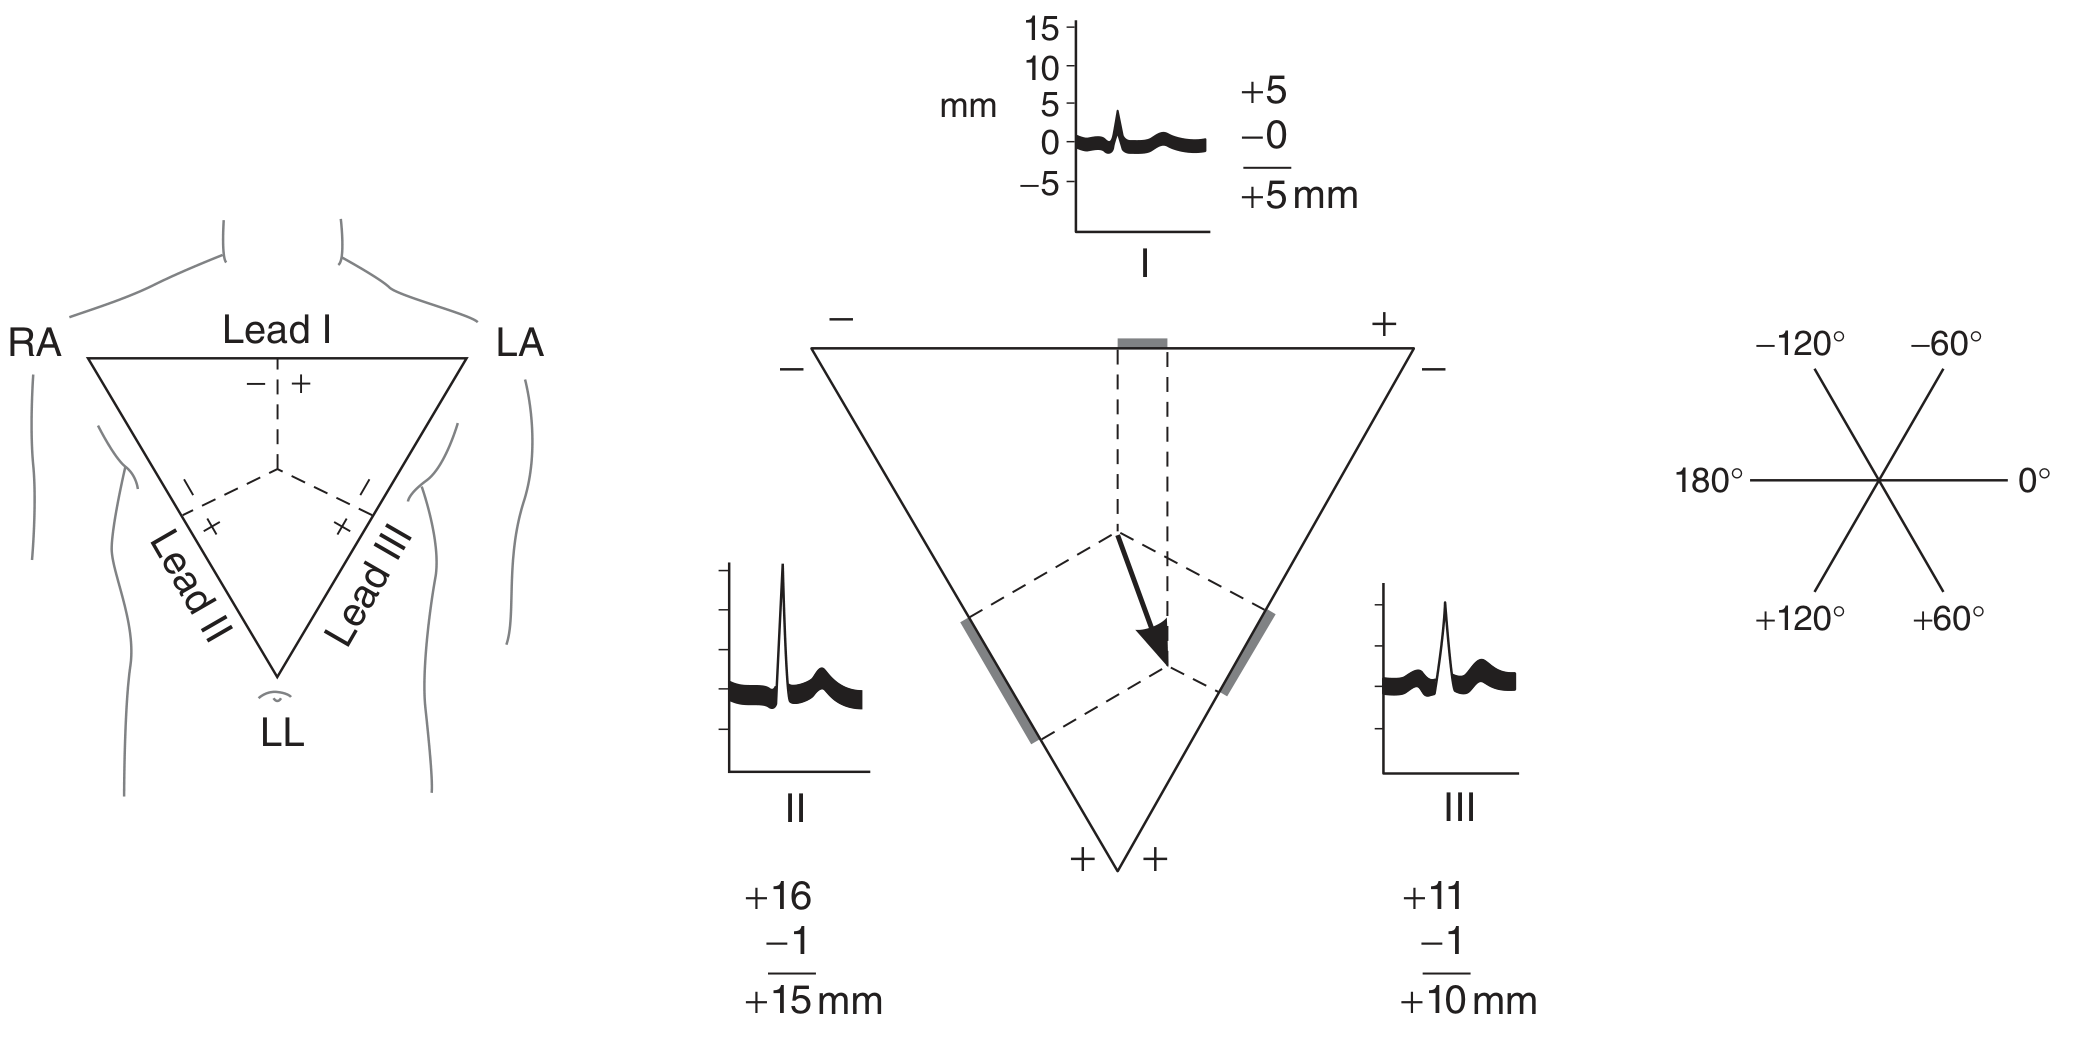
Left: Einthoven's triangle with leads I, II, III. Center: How the mean QRS vector is calculated by measuring R-wave minus negative deflection amplitudes in each lead. Right: Reference axes (hexaxial system) for axis determination.
| Axis | Value | Common Causes |
|---|---|---|
| Normal | -30° to +100° | - |
| Left axis deviation | More negative than -30° | LVH, left anterior fascicular block, inferior MI |
| Right axis deviation | More positive than +90-100° | RVH, lateral MI, left posterior fascicular block |
4. ECG Waveforms: P-QRS-T
Each cardiac cycle produces a characteristic pattern of deflections:
| Component | Represents | Normal Duration |
|---|---|---|
| P wave | Atrial depolarization | <120 ms, upright in II, negative in aVR |
| PR interval | AV conduction time | 120-200 ms |
| QRS complex | Ventricular depolarization | <120 ms |
| ST segment | Early ventricular repolarization | At baseline (isoelectric) |
| T wave | Ventricular repolarization | Concordant with QRS polarity |
| QT interval | Total ventricular systole | Corrected QTc <450 ms (men), <460 ms (women) |
| U wave | Late repolarization | Small, same polarity as T wave |
Ventricular Depolarization - Two Phases
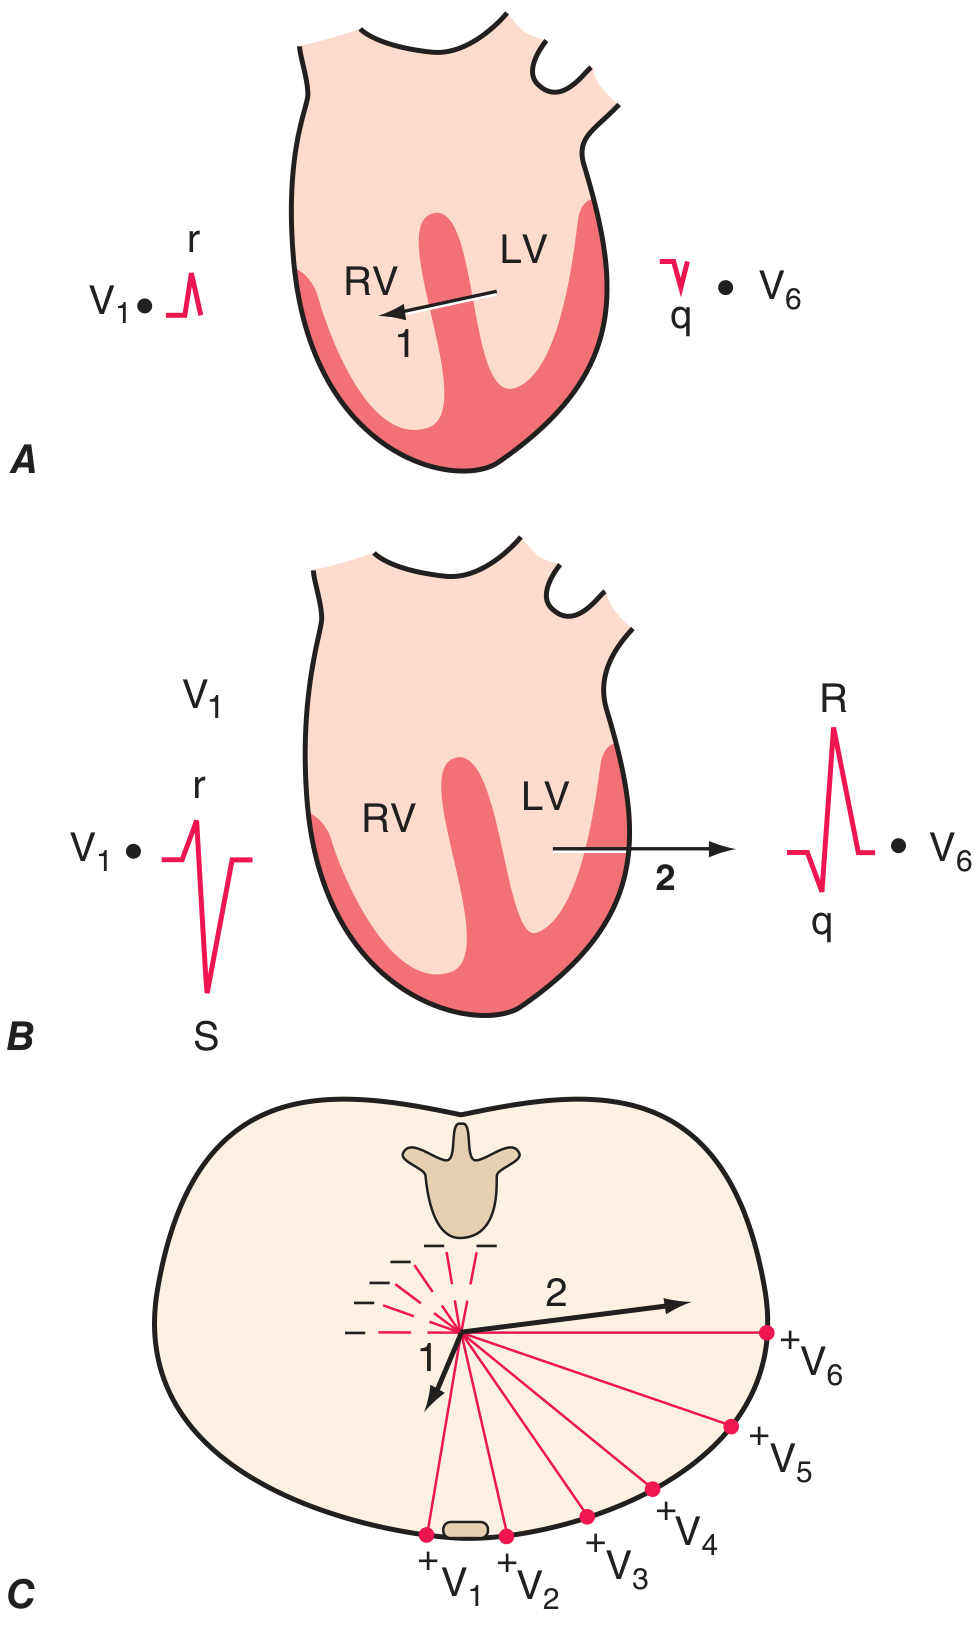
Phase 1: Septal depolarization goes left-to-right (small r in V1, small q in V6). Phase 2: Left ventricular depolarization dominates, with the vector pointing left/posterior (deep S in V1, tall R in V6).
5. A Real Normal ECG
The ECG below is from a healthy male with sinus rhythm at 75 bpm, PR interval 160 ms, QRS duration 80 ms, QTc ~390 ms, and axis ~+70°:
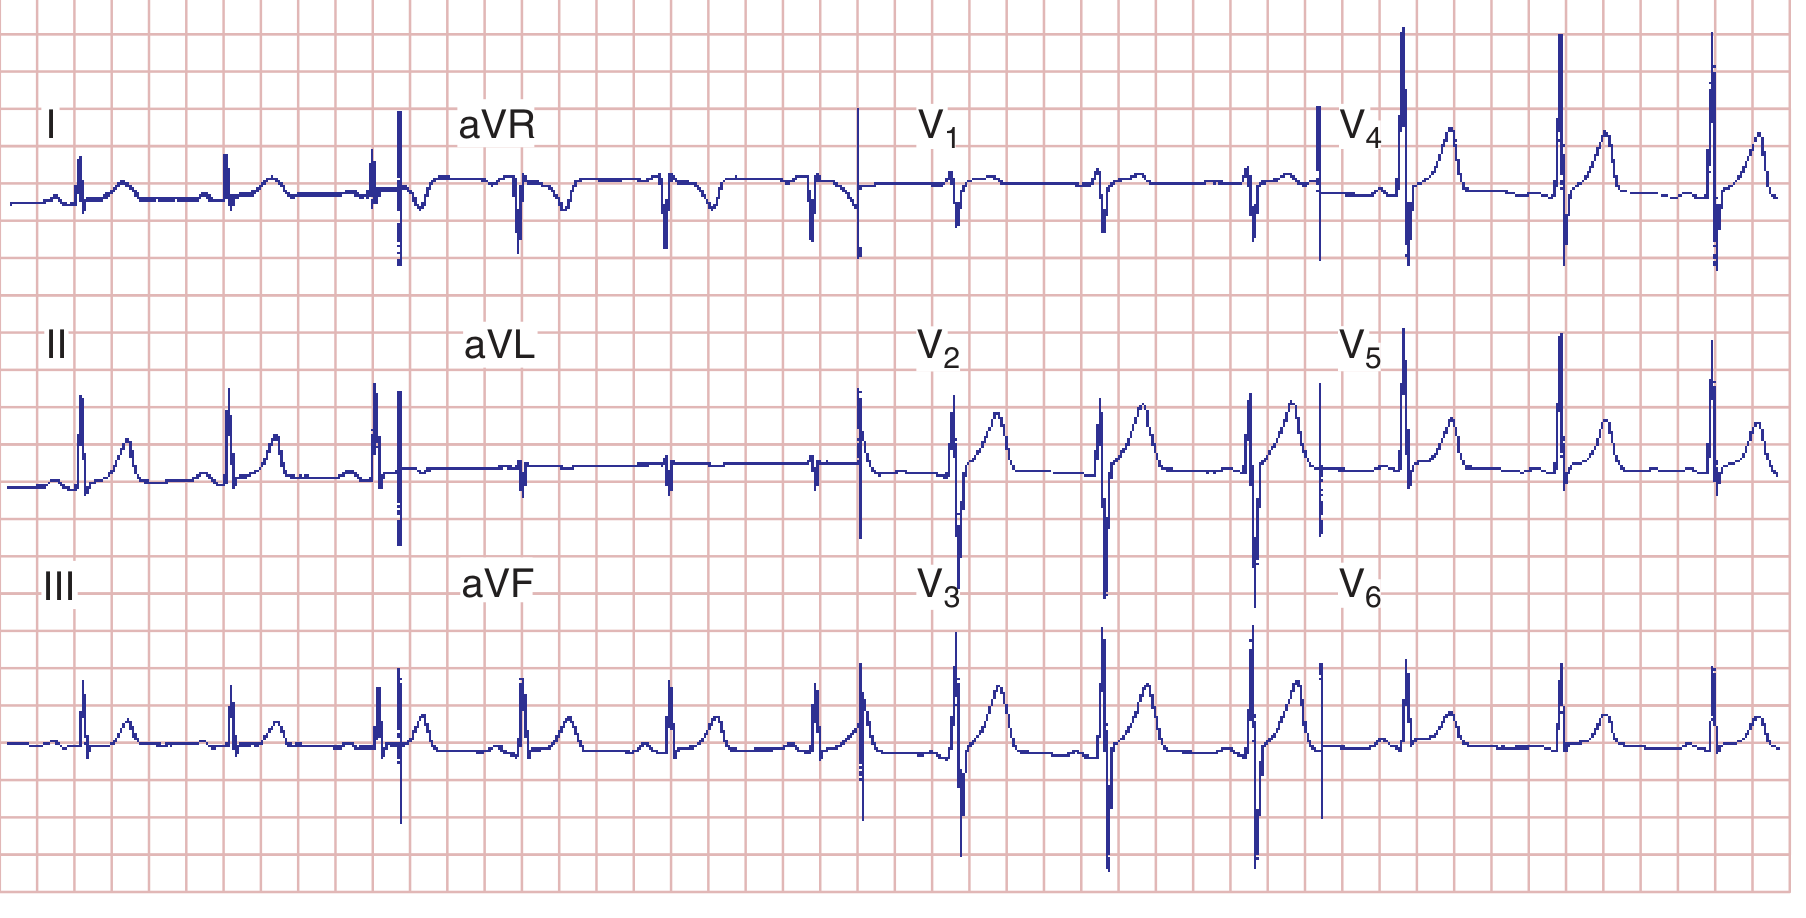
Key features: Regular P waves before every QRS, narrow QRS, normal R-wave progression V1→V6, flat ST segments, upright T waves in lateral leads. - Harrison's Principles of Internal Medicine 22E, Figure 247-7
6. Systematic Approach to ECG Reading (Harrison's 14-step method)
Every ECG should be analyzed in this order:
- Calibration/standardization and technical quality
- Rhythm
- Heart rate
- PR interval / AV conduction
- QRS interval (duration)
- QT/QTc interval
- Mean QRS electrical axis
- P waves (morphology)
- QRS voltages
- Precordial R-wave progression
- Abnormal Q waves
- ST segments
- T waves
- U waves
7. Atrial Abnormalities (P Wave Changes)
The P wave is the first clue to atrial pathology:
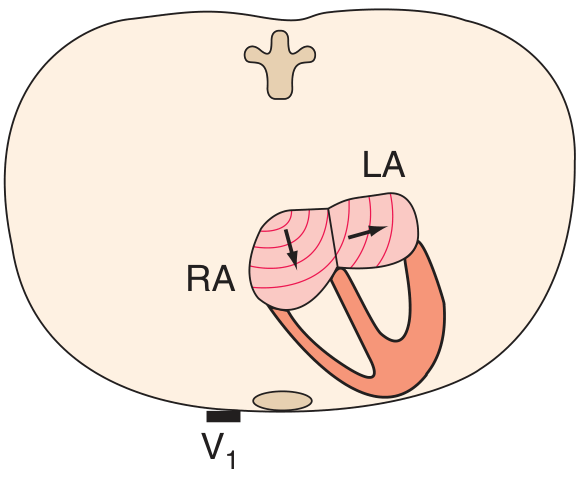
- Right atrial overload (P-pulmonale): Tall, peaked P waves (≥2.5 mm) - the two atria are shown here with their depolarization vectors
- Left atrial abnormality (P-mitrale): Broad (≥120 ms), notched P wave in limb leads; biphasic P in V1 with prominent negative terminal component
8. Ventricular Hypertrophy
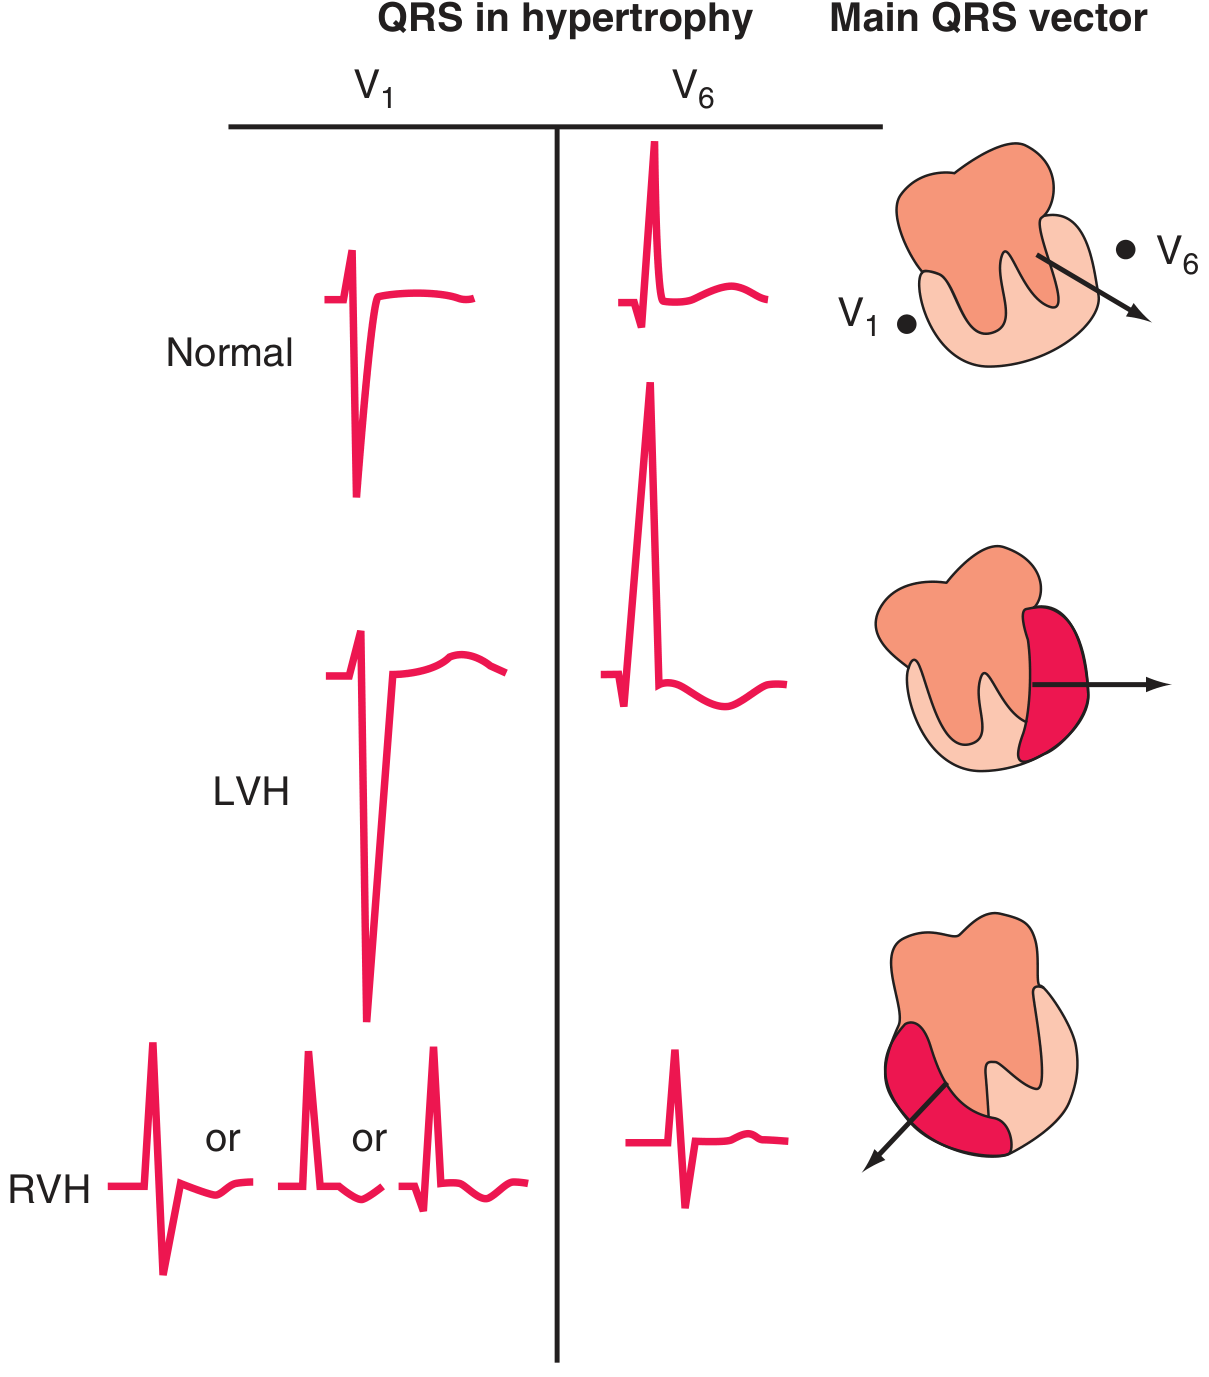
Left Ventricular Hypertrophy (LVH):
- Tall R wave in V5-V6, deep S wave in V1 (Sokolow-Lyon: SV1 + RV5 ≥35 mm)
- ST depression + T-wave inversion in lateral leads ("strain pattern")
Right Ventricular Hypertrophy (RVH):
- Tall R wave in V1 (R ≥ S), right axis deviation
- T-wave inversions in right precordial leads (V1-V3)
- qR or rSR' pattern in V1
9. Ischemia and Infarction (The Most Important ECG Application)
Currents of Injury
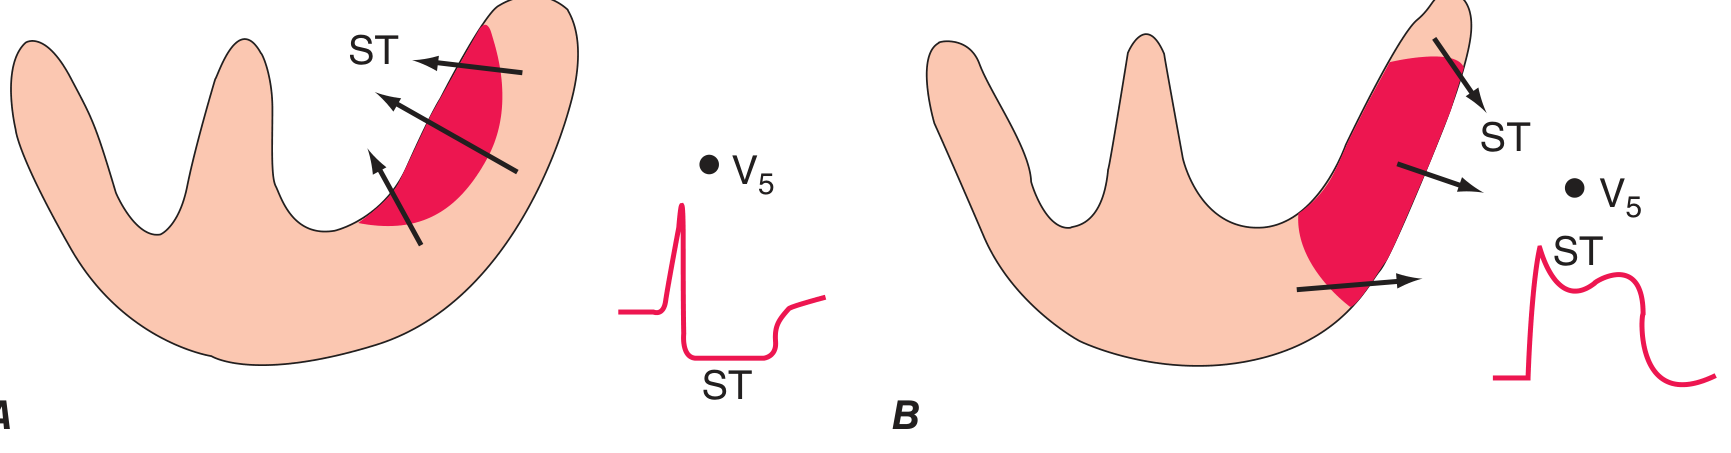
- Subendocardial ischemia (A): ST vector points inward → ST depression in overlying leads
- Transmural/epicardial ischemia (B): ST vector points outward → ST elevation in overlying leads
ST Elevation MI - Localizing the Territory
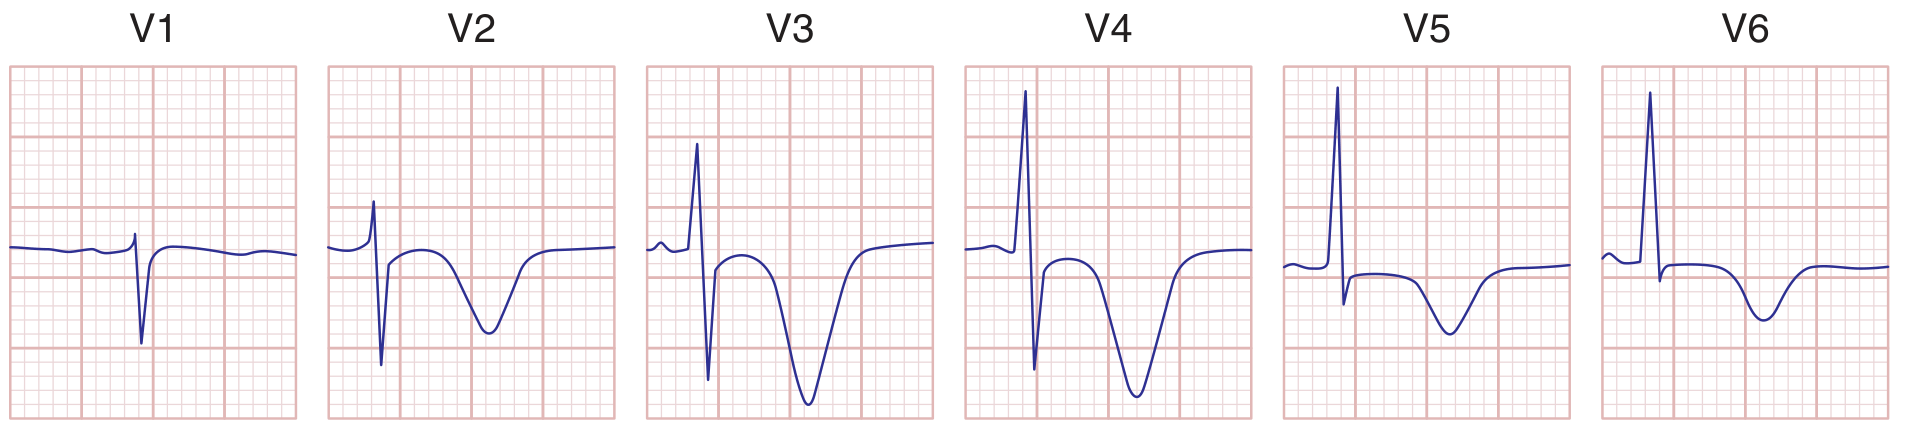
Anterior STEMI: Diffuse ST elevations across V1-V6, with deep S waves and prominent T-wave changes. This represents LAD territory occlusion.
| Territory | Leads with Changes | Artery |
|---|---|---|
| Anterior | V1-V6, I, aVL | LAD |
| Inferior | II, III, aVF | RCA or LCx |
| Lateral | I, aVL, V5-V6 | LCx |
| Posterior | Reciprocal ST↓ in V1-V3 | RCA or LCx |
| Right ventricle | V1, V3R-V4R | RCA (proximal) |
ECG Evolution in STEMI
- Hyperacute T waves (minutes) - tall, peaked T waves
- ST elevation (minutes to hours) - "tombstone" pattern
- Q waves form (hours to days) - pathological if >40 ms wide, >25% of R wave
- T-wave inversion (hours to weeks) - symmetric, deep
- Q waves persist (permanent marker of old infarct)
10. Bundle Branch Blocks
- Right Bundle Branch Block (RBBB): Wide QRS (≥120 ms), rSR' ("rabbit ears") in V1, wide S wave in V6, I
- Left Bundle Branch Block (LBBB): Wide QRS, broad monophasic R in I, aVL, V5-V6; QS or rS in V1. Important: LBBB makes ST changes unreliable for ischemia diagnosis.
- Secondary T-wave changes (T wave opposite to terminal QRS deflection) are expected with bundle branch blocks - they are not independently meaningful.
11. Quick Summary Table
| ECG Finding | Think of... |
|---|---|
| Short PR (<120 ms) | WPW, AV junctional rhythm |
| Long PR (>200 ms) | First-degree AV block |
| Wide QRS (>120 ms) | BBB, hyperkalemia, WPW, pacemaker |
| ST elevation | STEMI, pericarditis, Brugada, early repolarization |
| ST depression | Subendocardial ischemia, digoxin, hypokalemia |
| Peaked P waves | Right atrial overload (e.g., cor pulmonale) |
| Broad notched P | Left atrial abnormality (e.g., mitral stenosis) |
| Long QTc | Hypokalemia, drugs (amiodarone, sotalol, TCAs) |
| Prominent U waves | Hypokalemia |
| Electrical alternans | Pericardial effusion / tamponade |
| Delta wave + short PR | Wolff-Parkinson-White |
Sources: Harrison's Principles of Internal Medicine 22E (2025), Chapter 247 (Electrocardiography) | Ganong's Review of Medical Physiology 26E, Chapter 29
This is a shared conversation. Sign in to Orris to start your own chat.