

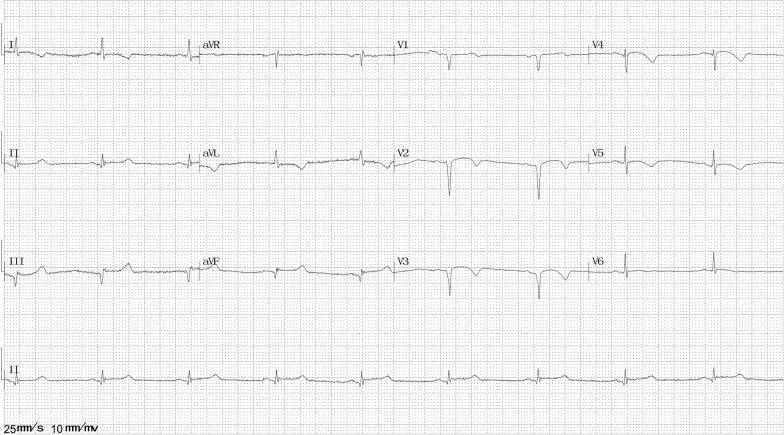
What could be diagnose or ecg changes?
left ventricular hypertrophy ECG 12 lead prominent QRS tall R waves
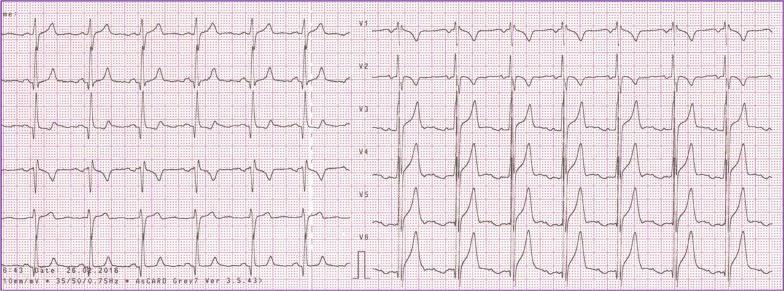
Diagnostic image showing a standard 12-lead electrocardiogram (ECG) recorded at a speed of 25 mm/s and calibration of 10 mm/mV. The tracing demonstrates features of biventricular hypertrophy. Key findings include tall R-waves in the mid-to-left precordial leads (V3-V6) with very high amplitude, suggestive of left ventricular hypertrophy, and a slight right-axis deviation in the frontal plane. Lead V1 exhibits a fractionated QRS complex and prominent S-waves. Secondary repolarization abnormalities are present, characterized by ST-segment depression and T-wave inversion across the precordial leads V3-V6 and in lead III, indicating ventricular strain. The rhythm is sinus with a regular rate; P-waves are visible and positive in leads I and II. This ECG provides a classic clinical example of biventricular enlargement often associated with congenital heart diseases like ventricular septal defects with significant shunting.
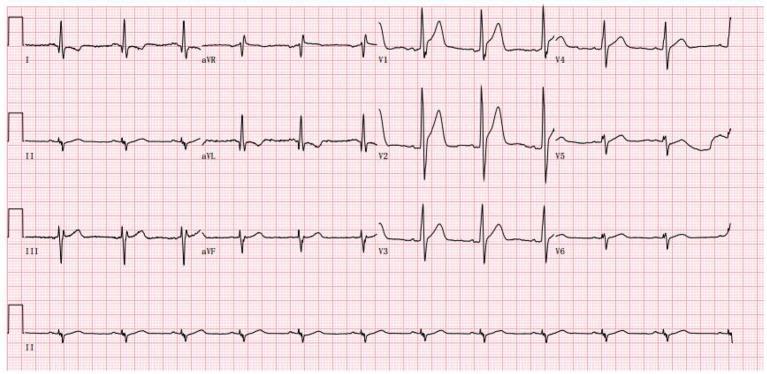
A standard 12-lead electrocardiogram (ECG) recorded on pink grid paper, showing a sinus rhythm. The tracing demonstrates several abnormal waveform morphologies characteristic of cardiac involvement in Duchenne Muscular Dystrophy (DMD). Notable features include significantly tall R waves in the right precordial leads (V1, V2, and V3), with an R/S ratio greater than 1 in V1, which may mimic right ventricular hypertrophy or posterior wall involvement. The limb leads reveal a left axis deviation consistent with a left anterior fascicular block (LAFB), characterized by small q waves with tall R waves in leads I and aVL, and small r waves with deep S waves in leads II, III, and aVF. There is poor R-wave progression across the precordial leads, and the QRS complexes in V4–V6 show relatively lower voltages compared to the prominent right precordial R waves. These findings are clinically significant for identifying cardiomyopathy and conduction system abnormalities in patients with progressive muscular dystrophies.
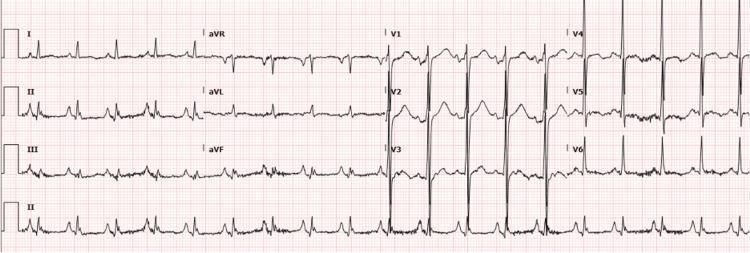
A standard 12-lead electrocardiogram (ECG) displayed in a traditional 3x4 grid layout with a rhythm strip (Lead II) at the bottom. The tracing exhibits sinus tachycardia, characterized by a rapid heart rate with narrow QRS complexes and visible P-waves preceding each complex. Key morphological findings include prominent Q-waves in the inferior leads (II, III, and aVF), consistent with an old inferior wall myocardial infarction. There are signs of left ventricular hypertrophy (LVH), indicated by high QRS voltage in the precordial leads (specifically tall R-waves in V4-V6 and deep S-waves in V1-V3). The QTc interval is prolonged, measured at 484 ms. The P-waves in the inferior leads show increased amplitude, suggesting right atrial enlargement. These findings provide critical clinical context for evaluating cardiovascular pathology, including prior ischemia, structural chamber remodeling, and repolarization abnormalities.
ECG Analysis
Technical Details
- Paper speed: 25 mm/s | Calibration: 10 mm/mV (standard)
- Patient info visible: K9, Smoker (+), HR ~5.10 noted on strip
Key ECG Findings
1. Rhythm & Rate
- Sinus rhythm - P waves are present and precede each QRS
- Rate appears normal to slightly elevated (approximately 75-90 bpm)
2. QRS Morphology - Most Prominent Finding
- Tall R waves in V4-V6 (left precordial leads)
- Deep S waves in V1-V3 (right precordial leads)
- QRS complexes appear narrow (< 120 ms) - no bundle branch block pattern
3. ST-T Wave Changes
- ST segment depression in precordial leads V3-V6
- T wave inversion/flattening in lateral leads
- These repolarization changes represent a "strain pattern"
4. Limb Leads
- Lead I and aVL show dominant R waves
- Inferior leads (II, III, aVF) show smaller complexes
Most Likely Diagnosis: Left Ventricular Hypertrophy (LVH) with Strain
Voltage Criteria Met (likely):
| Criterion | Finding |
|---|---|
| Sokolow-Lyon | S in V1 + R in V5/V6 > 35 mm |
| Cornell | R in aVL + S in V3 > 28 mm (male) |
| Repolarization (strain) | ST depression + T inversion in I, aVL, V4-V6 |
Differential Diagnoses to Consider
| Diagnosis | Supporting Features |
|---|---|
| LVH with strain | High voltage + ST-T changes in lateral leads (most likely) |
| Hypertensive heart disease | Patient is a smoker - high cardiovascular risk |
| Hypertrophic cardiomyopathy (HCM) | Can show similar voltage + deep Q waves |
| Athletic heart | High voltage but usually WITHOUT strain pattern |
| Anterolateral ischemia | ST changes in V3-V6 - cannot exclude without clinical context |
Clinical Correlation Required
- Check blood pressure - LVH is most often due to hypertension
- Echocardiogram is the gold standard to confirm LVH and assess wall thickness, function
- Troponin / cardiac enzymes if ischemia is suspected (chest pain, dyspnea)
- Coronary evaluation if ST changes are new or symptomatic
Reference ECG for Comparison
Important disclaimer: This ECG interpretation is AI-assisted and for educational purposes only. A board-certified cardiologist or physician must review the original tracing in the context of the patient's clinical presentation before any management decisions are made.
What is strain pattern in ecg?
ECG strain pattern ST depression T wave inversion left ventricular hypertrophy
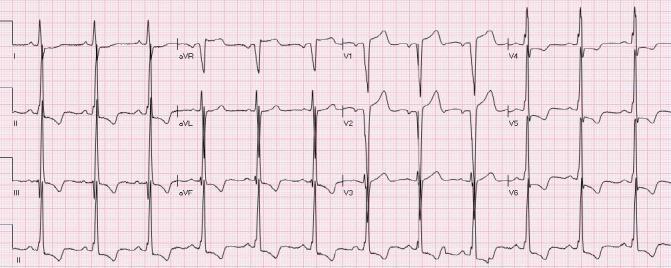
This diagnostic image is a 12-lead electrocardiogram (ECG) demonstrating secondary repolarization abnormalities associated with Left Ventricular Hypertrophy (LVH). Key diagnostic findings include voltage criteria for LVH, characterized by high-amplitude QRS complexes in the precordial leads. Distinct ST-segment and T-wave changes are present: non-ischemic ST elevation (STE) is visible in lead aVR and the right precordial leads V1-V3. Conversely, prominent ST-segment depression with concomitant T-wave inversion (strain pattern) is observed in the lateral and inferior leads, specifically leads I, II, III, aVF, and V4-V6. These findings illustrate the 'strain pattern' of LVH, which is a critical differential diagnosis for ST-segment elevation myocardial infarction (STEMI). The tracing serves as an educational example of how chronic structural heart changes can mimic or mask acute coronary syndromes, emphasizing the importance of recognizing voltage criteria and the distribution of repolarization deviations in clinical cardiology.
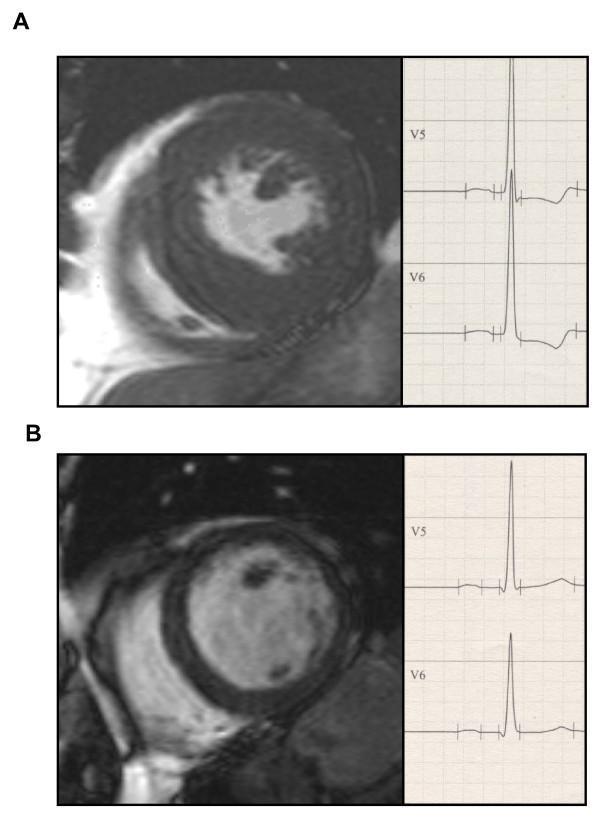
This comparative medical illustration presents short-axis Cardiac Magnetic Resonance (CMR) images and corresponding Electrocardiogram (ECG) tracings for two types of Left Ventricular Hypertrophy (LVH). Panel A demonstrates concentric LVH, characterized by a significantly thickened myocardial wall and a reduced left ventricular (LV) end-diastolic cavity diameter (42 mm). The adjacent ECG shows high-voltage R waves in leads V5 and V6 with accompanying ST-segment depression and T-wave inversion, consistent with a left ventricular strain pattern. Panel B illustrates eccentric LVH, featuring a dilated LV cavity (end-diastolic diameter 60 mm) and relatively thinner myocardial walls compared to the concentric model. The corresponding ECG in panel B shows high-voltage R waves but with upright T waves and less pronounced ST-segment changes. The visual comparison highlights the structural differences between pressure-overload (concentric) and volume-overload (eccentric) remodeling and their respective electrophysiological manifestations, facilitating the study of cardiac morphology and ECG-LVH correlation criteria.
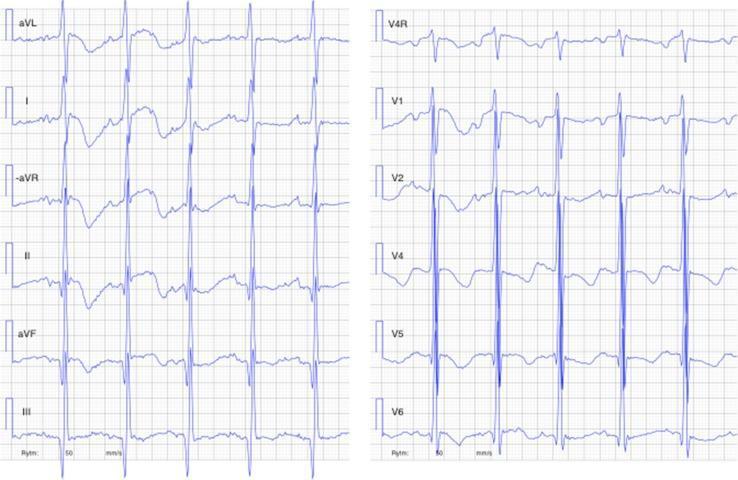
This diagnostic image is a 12-lead electrocardiogram (ECG) including right-sided lead V4R, obtained from a 4-month-old infant with dilated cardiomyopathy. The tracing demonstrates sinus tachycardia with a high ventricular rate. Key pathological features include markedly enlarged QRS amplitudes, particularly evident in the precordial leads (V1-V6) and limb leads (I, aVL), consistent with severe left ventricular hypertrophy. There are widespread ST-segment abnormalities characterized by down-sloping ST-segment depression and T-wave inversion/flattening in the lateral and inferior leads (I, aVL, II, aVF, V4-V6), representing a ventricular strain pattern. The P-waves are enlarged, suggesting atrial enlargement. Additionally, the QT interval is corrected (QTc) and appears prolonged. This ECG illustrates significant myocardial stress and structural remodeling associated with severe heart failure and pediatric cardiomyopathy.
ECG Strain Pattern
Definition
Downsloping (asymmetric) ST-segment depression + T-wave inversion in leads that face the hypertrophied ventricle
Morphology - What It Looks Like
| Feature | Description |
|---|---|
| ST segment | Downsloping depression (concave up, or "sagging") |
| T wave | Inverted, asymmetric - slow upstroke, rapid return to baseline |
| QRS | Tall R wave (high voltage) in the same leads |
| Shape | The upstroke of the T wave is gradual, and the downstroke is steep - opposite of ischemia |
Left Ventricular Strain (LV Strain)
- Hypertension (most common cause)
- Aortic stenosis
- Hypertrophic cardiomyopathy
- Coarctation of aorta
Right Ventricular Strain (RV Strain)
- Pulmonary hypertension
- Pulmonary embolism (acute)
- Pulmonary stenosis
- Cor pulmonale
"This pattern, formerly called right ventricular 'strain,' is attributable to repolarization abnormalities in acutely or chronically overloaded muscle."
Mechanism - Why Does It Occur?
Pressure/Volume overload
        ↓
Ventricular wall hypertrophy
        ↓
Subendocardial ischemia (inner layers get less perfusion)
        ↓
Abnormal repolarization sequence
        ↓
ST depression + T wave inversion = STRAIN PATTERN
- It receives blood last in the coronary circulation
- In a thick hypertrophied wall, perfusion pressure is needed across a longer distance
- Wall tension is very high (LaPlace's law)
Strain Pattern vs. Ischemia - Key Differences
| Feature | Strain Pattern | Ischemic T-wave Inversion |
|---|---|---|
| T-wave shape | Asymmetric (gradual up, steep down) | Symmetric (both limbs equal) |
| ST segment | Downsloping, "sagging" | Horizontal or upsloping |
| QRS voltage | HIGH (LVH criteria met) | Normal or low |
| Distribution | Lateral leads (LVH) | Follows coronary territory |
| Dynamic change | Chronic, stable | Acute or evolving |
| Clinical setting | Hypertension, known LVH | ACS, chest pain |
Concentric vs. Eccentric LVH and Strain
- Concentric LVH (pressure overload - hypertension, aortic stenosis): More likely to show strain
- Eccentric LVH (volume overload - aortic regurgitation, dilated cardiomyopathy): Strain less prominent
Clinical Significance
- Confirms true LVH - increases specificity of voltage criteria alone
- Indicates end-organ damage from hypertension (target organ damage)
- Raises cardiovascular risk - associated with worse prognosis than LVH without strain
- Complicates stress test interpretation - can cause false-positive exercise ECG tests (ST changes at baseline make stress ECG non-diagnostic)
- Must not be confused with STEMI - reciprocal ST elevation in V1-V2 from LV strain can mimic posterior STEMI
Quick Summary
The strain pattern = high voltage QRS + downsloping ST depression + asymmetric T inversion in leads facing the hypertrophied ventricle. It represents secondary (non-ischemic) repolarization abnormality due to chronic pressure/volume overload of the ventricle.
Can you tell me more about ecg changes in v3 lead
ECG V3 lead anterior ischemia ST elevation R wave poor progression precordial
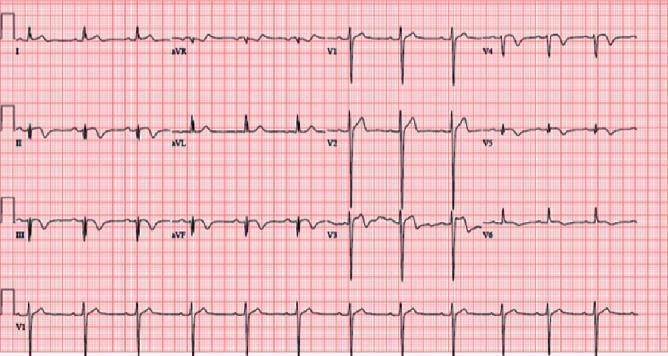
This diagnostic image is a standard 12-lead electrocardiogram (ECG) displayed on a red grid background, illustrating significant ischemic changes. The tracing demonstrates a sinus rhythm with a normal heart rate. Pathological findings include diffuse ST-segment and T-wave abnormalities across multiple leads. Specifically, deep T-wave inversions are evident in the lateral leads (I, aVL, V4-V6), inferior leads (II, III, aVF), and anterior leads (V2-V3). ST-segment depression is visible in leads I, aVL, and V4-V6, while slight ST-segment elevation is noted in lead V2. Additionally, the precordial leads (V1-V6) show poor R-wave progression, characterized by low R-wave amplitude in V1-V3 that does not appropriately increase toward the lateral leads. These findings are clinically significant for suggesting myocardial ischemia or injury, often associated with coronary artery pathology such as a left anterior descending (LAD) artery lesion. The ECG serves as a critical educational tool for identifying widespread ischemic patterns and abnormal ventricular depolarization.
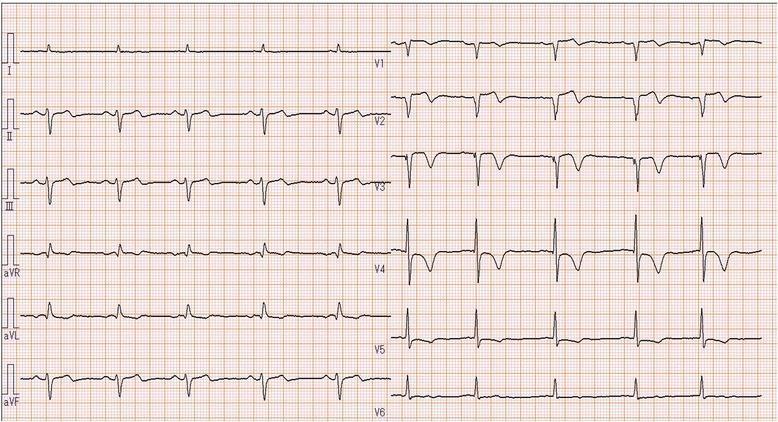
A standard 12-lead preoperative electrocardiogram (ECG) printed on grid paper, displaying limb leads (I, II, III, aVR, aVL, aVF) and precordial leads (V1-V6). The tracing demonstrates several ischemic findings. In the anterior precordial leads (V1-V3), there is a slight elevation of the ST segment above the isoelectric baseline. The morphology of the T-waves in these leads appears flattened or slightly inverted. In the lateral leads (V4-V6), the ST segment becomes more isoelectric, though abnormal ST-T wave morphology persists across V2-V6. Additionally, lead aVL shows a prominent T-wave inversion. The limb leads (II, III, aVF) demonstrate minor ST-segment abnormalities and non-specific T-wave changes. The QRS complexes exhibit relatively normal duration and voltage, though poor R-wave progression is noted in the early precordial leads. These findings are clinically significant as they suggest possible myocardial ischemia or injury affecting the anteroseptal and lateral regions of the heart, consistent with the patient's history of coronary artery disease.
This diagnostic image is a 12-lead electrocardiogram (ECG) recorded at a standard paper speed of 25 mm/s and voltage of 10 mm/mV. The tracing demonstrates significant acute electrophysiological changes across multiple vascular territories. Notably, there is ST-segment elevation visible in the inferior leads (II, III, and aVF) and the anterior precordial leads (V1 through V4), indicating transmural myocardial injury. The precordial leads also show a pattern of poor R-wave progression and deep S-waves in V2-V3. The presence of concurrent inferior and anterior ST-segment elevation is a clinically significant finding that may suggest a large territory of ischemia or multivessel coronary artery spasm (CAS), as seen in Prinzmetal angina or Takotsubo cardiomyopathy variants. The rhythm appears to be sinus, and the visual focus is on the repolarization abnormalities that characterize the acute episode. This ECG serves as a critical educational tool for identifying extensive ST-segment elevation myocardial infarction (STEMI) patterns and differentiating coronary vasospasm from fixed atherosclerotic occlusion.
ECG Changes in Lead V3
Anatomy - What Does V3 "See"?
V1  V2  [V3]  V4  V5  V6
RV  Sep  ←→   Ant  Lat  Lat
         TRANSITION
Normal V3 Appearance
| Feature | Normal Finding |
|---|---|
| R wave | Small-to-medium positive deflection, growing from V1→V6 |
| S wave | Deep S wave (R < S in V3 is still normal) |
| Transition | R = S somewhere between V3-V4 (transition zone) |
| ST segment | At baseline or very slightly elevated (up to 1mm) |
| T wave | Upright, positive |
Abnormal ECG Changes in V3 and Their Meaning
1. Poor R-Wave Progression (PRWP)
- Anterior MI (old or new) - most important cause
- LVH (forces directed posteriorly)
- LBBB
- Lead misplacement (V3 placed too high)
- COPD / emphysema (hyperinflation pushes heart down)
- Cardiomyopathy

2. ST Elevation in V3 (Injury Pattern)
| Cause | ST Shape in V3 | Associated Leads |
|---|---|---|
| Anterior STEMI (LAD) | Convex ("tombstone"), horizontal, or oblique upward | V1-V4/V5 |
| Anteroseptal STEMI | Elevation in V1-V3 specifically | V1, V2, V3 |
| Benign Early Repolarization | Concave (scooped), notched J-point | V2-V5, young males |
| Acute pericarditis | Concave ("saddle-shaped") | Diffuse, all leads |
| LBBB | Discordant ST elevation (opposite to QRS) | V1-V3 |
| Vasospasm (Prinzmetal) | Transient, resolves spontaneously | Variable |
3. ST Depression in V3 (Ischemia / Strain)
| Cause | Pattern |
|---|---|
| Subendocardial ischemia / NSTEMI | Horizontal or downsloping ST depression ≥0.5mm |
| LVH strain | Downsloping ST depression with T inversion (as in the ECG from your previous image) |
| Posterior STEMI (mirror image) | ST depression in V1-V3 is the RECIPROCAL of posterior wall ST elevation |
| Digoxin effect | "Reversed tick" or scooped ST depression |
| RVH strain | ST depression in right-transitional leads |
Important: ST depression in V3 may actually represent a posterior wall STEMI - the posterior wall shows ST elevation, but V3 (an anterior lead) shows this as a mirror-image ST depression. This is why posterior leads (V7-V9) should be checked!
4. T-Wave Changes in V3
| T-wave appearance | Meaning |
|---|---|
| Tall, peaked, broad-based | Hyperacute T wave - very early STEMI, or hyperkalemia |
| Deep, symmetric inversion | Wellens' syndrome (critical LAD stenosis), anterior ischemia |
| Shallow inversion | Non-specific, can be normal in some, LVH strain |
| Biphasic T wave | Wellens' Type A - LAD lesion, high risk of anterior MI |
Wellens' Syndrome - Critically Important!
- Type A: Biphasic T wave (up then down) in V2-V3
- Type B: Deep symmetric T inversion in V2-V3
- Pain-free at time of ECG
- Represents a critical proximal LAD stenosis - patient at high risk for massive anterior MI
- Do NOT stress test these patients - can precipitate full infarction
5. Q Waves in V3
| Q wave type | Meaning |
|---|---|
| Small septal q (< 1mm, < 40ms) | Normal - septal depolarization |
| Pathological Q wave (≥ 1mm deep, ≥ 40ms wide) | Old anterior/anteroseptal MI |
| QS pattern (all negative, no R) | Extensive anterior infarction, or LBBB |
V3 in the Context of Your Patient's ECG
- V3 showed ST depression - in the setting of high voltage QRS (LVH) this is part of the strain pattern
- However, posterior MI must be excluded clinically (posterior leads V7-V9 may be needed)
- If the patient has chest pain, NSTEMI/ischemia involving the anterior wall cannot be ruled out by ECG alone - troponins are needed
Summary Table - V3 Changes at a Glance
| Change | Most Likely Cause |
|---|---|
| Poor R-wave progression | Old anterior MI, LVH, COPD |
| ST elevation (convex) | Anterior STEMI (LAD territory) |
| ST elevation (concave) | BER, pericarditis, LBBB |
| ST depression (horizontal) | Subendocardial ischemia / NSTEMI |
| ST depression (downsloping) | LVH strain, posterior MI mirror |
| Hyperacute tall T | Very early STEMI, hyperkalemia |
| Deep symmetric T inversion | Wellens' syndrome, anterior ischemia |
| Biphasic T | Wellens' Type A - critical LAD stenosis |
| Pathological Q wave | Old anteroseptal MI |
Bottom line: V3 is one of the most diagnostically important leads on the ECG. Any change in V3 should prompt a systematic search across V1-V6 for a broader anterior/septal/posterior pattern, and always must be interpreted alongside clinical symptoms and troponin levels.