I now have comprehensive content from Park's textbook. Let me now compile the full LAQ answer.
MATERNAL MORTALITY RATIO (MMR) & INFANT/CHILDHOOD MORTALITY RATES
Strictly from Park's Textbook of Preventive and Social Medicine
PART 1: MATERNAL MORTALITY RATIO (MMR)
Definition
According to WHO, a maternal death is defined as:
"The death of a woman while pregnant or within 42 days of termination of pregnancy, irrespective of the duration and site of pregnancy, from any cause related to or aggravated by the pregnancy or its management but not from unintentional or incidental causes."
Formula
MMR = (Total no. of female deaths due to complications of pregnancy, childbirth or within 42 days of delivery from puerperal causes in a given year / Total no. of live births in the same year) × 1,000 (or 100,000)
Types of Maternal Deaths
1. Direct Obstetric Deaths (Direct Maternal Deaths)
Deaths resulting from obstetric complications of the pregnant state (pregnancy, labour, puerperium), from interventions, omissions, incorrect treatment, or a chain of events resulting from any of the above.
- Examples: obstetric haemorrhage, hypertensive disorders, complications of anaesthesia or caesarean section.
2. Indirect Obstetric Deaths (Indirect Maternal Deaths)
Deaths resulting from pre-existing disease or disease that developed during pregnancy, not due to direct obstetric causes, but aggravated by physiological effects of pregnancy.
- Examples: death due to aggravation (by pregnancy) of existing cardiac or renal disease.
"The maternal mortality rate, the direct obstetric rate and the indirect obstetric rate are fine measures of the quality of maternity services."
3. Late Maternal Death
"The death of a woman from direct or indirect obstetric causes, after more than 42 days but less than one year after termination of pregnancy."
- Coded under ICD-10 as O96 and O97.
4. Comprehensive Maternal Death (ICD-11)
Maternal deaths + late maternal deaths are combined under this new grouping in ICD-11.
5. Pregnancy-Related Death
"Death of a woman while pregnant or within 42 days of termination of pregnancy, irrespective of the cause of death (obstetric and non-obstetric)." Includes unintentional/accidental and incidental causes.
Indicators of MMR
| Indicator | Definition |
|---|
| MMR | No. of maternal deaths per 100,000 live births |
| MMRate | No. of maternal deaths divided by person-years lived by women of reproductive age |
| Adult lifetime risk | Probability that a 15-year-old girl will eventually die from a maternal cause |
| PM (proportion) | Maternal deaths / Total deaths among women aged 15-49 years |
Categorization (WHO):
- High MMR: 300-499 per 100,000 live births
- Very high MMR: 500-999 per 100,000 live births
- Extremely high MMR: ≥1,000 per 100,000 live births
Approaches for Measuring MMR
- Civil registration systems - Routine registration of births and deaths (ideal method)
- Household survey - Alternative where civil registration data is unavailable
- Sisterhood methods - Interview a representative sample about survival of adult sisters
- Reproductive-Age Mortality Studies (RAMOS) - Identifies and investigates causes of all deaths of women of reproductive age using multiple data sources
- Verbal autopsy - Assigns cause of death through interview with family/community members, used in demographic surveillance systems
- Census - National census with addition of specific questions; eliminates sampling errors
World Scenario
- Estimated 295,000 maternal deaths globally in 2017, with an overall MMR of 211 per 100,000 live births.
- Global adult lifetime risk of maternal mortality: approximately 1 in 190 (2017).
- Sub-Saharan Africa is the only region with very high MMR - estimated at 542 with lifetime risk of 1 in 37.
- Extremely high MMR countries (2017): South Sudan (1150), Chad (1140), Sierra Leone (1120).
- Least developed countries: MMR of 415 - over 40 times higher than Europe (10).
- Between 2000-2017, South Asia achieved the greatest percentage reduction - from 384 to 157 (59%).
- Nigeria and India had the highest estimated number of maternal deaths, accounting for approximately 35% of global maternal deaths.
Vulnerable period: About 50-70% of maternal deaths occur in the postpartum period; 45% within the first 24 hours after delivery; >2/3 during the first week. 11-17% occur during childbirth itself.
India Scenario
- An estimated 44,000 mothers continue to die every year due to causes related to pregnancy, childbirth and post-partum period.
- MMR has reduced from 167 per lakh live births (2011-13) to 113 per lakh live births (2016-18).
- Lifetime risk of maternal death: 0.3% overall; higher in EAG states + Assam (0.5%) vs southern states (0.1%).
- States achieving MMR goal of 100 per lakh live births: Kerala, Maharashtra, Andhra Pradesh, Gujarat, Tamil Nadu.
- Highest MMR among EAG states: Assam (215).
- SRS uses RHIME (Representative, Re-sampled, Routine Household Interview of Mortality with Medical Evaluation) - an enhanced form of verbal autopsy from year 2000 onwards.
Causes of Maternal Mortality in India (2001-2003 SRS)
| Cause | Percentage |
|---|
| Haemorrhage | 38% |
| Other conditions | 34% |
| Anaemia (aggravating factor) | 19% |
| Abortion | 8% |
| Sepsis | 11% |
| Hypertension | 5% |
| Obstructed labour | 5% |
Determinants of Maternal Mortality in India
| Medical Causes | Social Factors |
|---|
| Obstetric causes: Toxaemias of pregnancy, haemorrhage, infection, obstructed labour, unsafe abortion | Age at childbirth, parity, too-close pregnancies, family size, malnutrition, poverty, illiteracy |
| Non-obstetric causes: Anaemia, cardiac/renal/hepatic/metabolic/infectious diseases, malignancy, accidents | Shortage of health manpower, delivery by untrained dais, poor environmental sanitation, poor communications and transport, social customs |
Prevention/Reduction of Maternal Mortality
- Increasing births attended by skilled health personnel
- Providing access to emergency obstetric care (FRUs - First Referral Units)
- Post-natal care for mothers and babies
- Janani Suraksha Yojana, Janani Shishu Suraksha Karyakram, establishment of MCH wings
- Family planning, adequate nutrition, safe water and sanitation
- Women's empowerment, higher literacy
- "Risk approach" and primary health care
- "There is an inverse relationship between lifetime risk of maternal death and the availability of the trained health worker during pregnancy and at the time of delivery."
PART 2: INFANT MORTALITY RATE (IMR) AND CHILDHOOD MORTALITY RATES
A. INFANT MORTALITY RATE (IMR)
Definition
IMR is defined as "the ratio of infant deaths registered in a given year to the total number of live births registered in the same year; usually expressed as a rate per 1000 live births."
Formula
IMR = (Number of deaths of children less than 1 year of age in a year / Number of live births in the same year) × 1000
Significance
IMR is universally regarded as:
- A most important indicator of the health status of a community
- An indicator of the level of living of people in general
- An indicator of effectiveness of MCH services in particular
Why Infant Mortality is Treated Separately
- (a) Infant mortality is the largest single age-category of mortality
- (b) Deaths at this age are due to a peculiar set of diseases and conditions to which adults are less exposed
- (c) Infant mortality is affected rather quickly and directly by specific health programmes and may change more rapidly than the general death rate
International Comparison (IMR per 1000 live births)
| Country | 1990 | 2018 |
|---|
| India | 88 | 32 |
| Bangladesh | 100 | 25 |
| Sri Lanka | 18 | 6 |
| China | 42 | 7 |
| Japan | 5 | 2 |
| UK | 8 | 4 |
| World | 63 | 29 |
- World average IMR (2018): ~29 per 1000 live births
- Developed countries: 4 per 1000; Least developed: 46 per 1000
- South Asian average: 35 per 1000
India IMR (2018)
- National average: 32 per 1000 live births
- Highest: Madhya Pradesh (48)
- Lowest: Kerala (7)
- A "critical infant mortality belt" runs through: Odisha, Madhya Pradesh, Assam, Bihar, Chhattisgarh, Uttar Pradesh, and Rajasthan
- Kerala has lowest IMR + lowest birth rate + highest literacy rate - demonstrating the inverse relationship between female literacy and IMR
Mortality Pattern of Infant Deaths
- Deaths in 0-1 year account for 10.5% of total deaths in the country
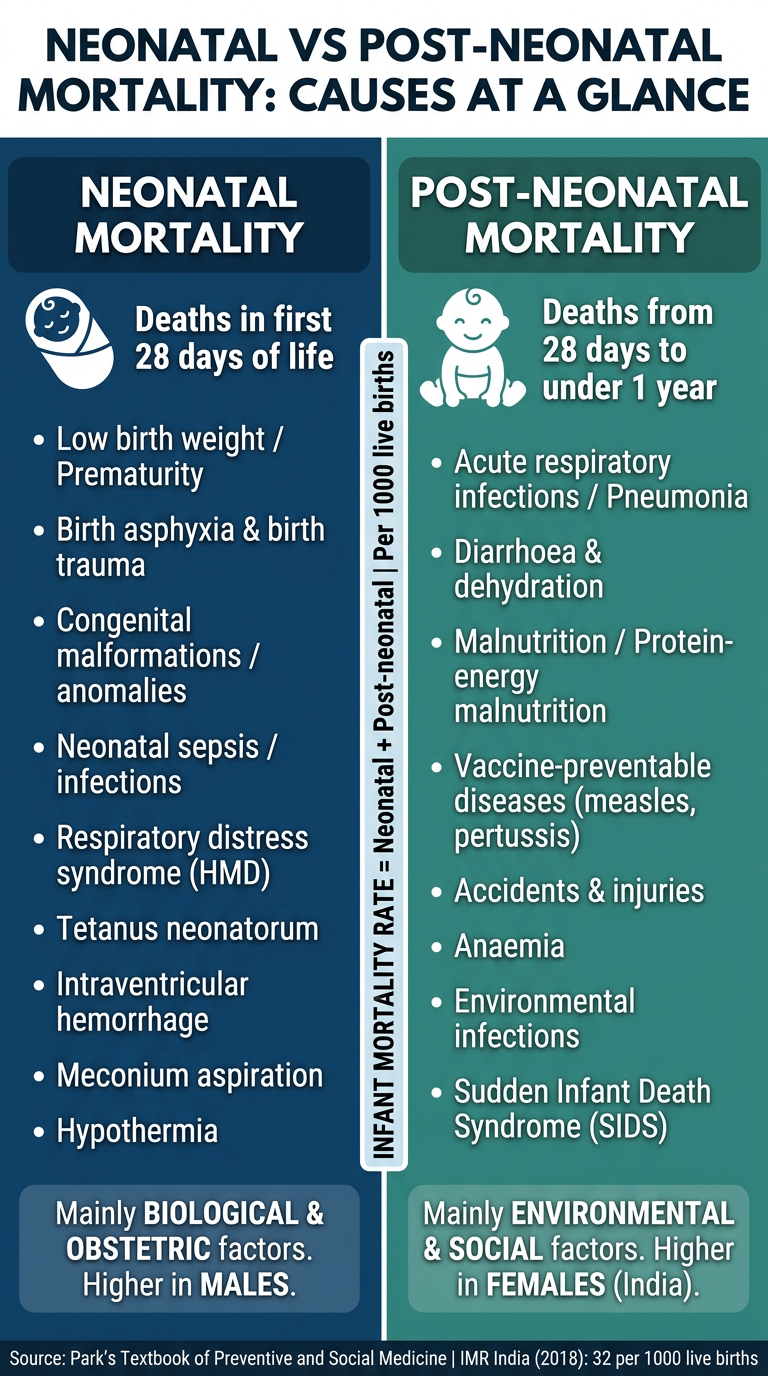
- About 71.7% of infant deaths occur within the first month (neonatal period)
- Of these, 54.6% may die during the first week of birth
Components / Sub-divisions of IMR
Infant deaths (under 1 year) = Neonatal deaths + Post-neonatal deaths
Neonatal period = first 28 days of life
- Early neonatal = first 7 days
- Late neonatal = 7-28 days
Post-neonatal period = 28 days to under 1 year
India's post-neonatal mortality rate (2018): 9 per 1000 live births
B. DETERMINANTS / FACTORS INFLUENCING IMR
1. BIOLOGICAL FACTORS
(a) Birth weight
- Birth weight is a major determinant of infant and perinatal mortality and morbidity
- Babies of low birth weight (<2.5 kg) and high birth weight (>4 kg) are at special risk
- Virtually all infants weighing less than 1000 g at birth succumb
- Poor maternal nutrition (even before pregnancy) is a major cause of LBW
(b) Age of mother
- IMR is greater when mother is either very young (<19 years) or relatively older (>30 years)
(c) Birth order
- Highest mortality among first born and 5th+ births
- Lowest among those born second
- Infant mortality from nutritional deficiencies is 3-4 times higher for 5th or higher birth order
(d) Birth spacing
- IMR highest for infants born after interval of 1 year (Khanna Study, India)
- Lower for 2-3 year interval; lowest for >4 years
- Risk of death for babies born within a year of each other is 2-4 times higher than for babies born more than 2 years apart (World Fertility Survey)
(e) Multiple births
- Greater risk of death due to higher frequency of low birth weight
(f) Family size
- IMR increases with family size
- Increased episodes of diarrhoea, malnutrition, respiratory infections with family size
- Duration of illness also increases
(g) High fertility
- High fertility and high infant mortality go together
2. ECONOMIC FACTORS
- Socio-economic status is the most important variable affecting IMR, both directly and indirectly
- IMR is highest in slums and lowest in richer residential localities
- Continuing socio-economic development is essential to decrease IMR
3. CULTURAL AND SOCIAL FACTORS
(a) Breast-feeding - Breast-fed infants have better survival than bottle-fed under poor hygienic conditions; early weaning increases risk
(b) Religion and caste - Socio-cultural patterns including habits, customs, traditions affecting cleanliness, eating, child care
(c) Early marriages - Baby of teenage mother has the highest risk for neonatal and post-neonatal mortality
(d) Sex of the child - Female infants receive far less attention in many parts of India; post-neonatal death rate is higher for female infants, while neonatal death rate is higher for males
(e) Quality of mothering - Even in extreme poverty, efficient mothers can reduce infant mortality
(f) Maternal education - Mother's education level is a key determinant of children's health (Kerala experience); educated women marry later, delay childbearing, practice family planning
(g) Quality of health care - Inadequate prenatal care, high percentage of deliveries by untrained persons/relatives especially in rural India
(h) Broken families - IMR tends to be high where mother or father has died or separated
(i) Illegitimacy - Unwanted child does not receive adequate nutrition and medical care
(j) Brutal habits and customs - Depriving baby of colostrum, frequent purgation, branding skin, application of cowdung to umbilical cord, faulty feeding practices, early weaning
(k) The indigenous dai - Untrained midwife is greatly responsible for high IMR in India; unhygienic delivery practices
C. CONTROL / REDUCTION OF IMR
- Nutrition - Good maternal nutrition is the most important determinant of birth weight and child survival; improve PEM and anaemia
- Immunization - Effective programme of immunization against vaccine-preventable diseases
- Control of diarrhoeal diseases - ORS; improvement in weaning practices
- Control of respiratory infections - Particularly pneumonia in the 1-12 month age group
- Family planning - Limitation and spacing of births; risk of death greatly enhanced if last child born less than 2 years ago or mother has 4+ children
- Sanitation - Safe water, food hygiene, better housing; "infant mortality rate is universally recognized not only as a most important indicator of the health status of the children, but also of the level of social environment"
- Provision of primary health care - Detection of high-risk mothers, special care baby units for babies <2000g, proper referral services
- Socio-economic development - Female literacy, nutrition, safe water, sanitation, housing, agriculture, commerce, communication
- Education - Higher female literacy associated with low fertility, low maternal mortality, and low IMR (Tamil Nadu experience: mid-day meal + improved healthcare reduced IMR from 90 per 1000 in 1984 to 57 in 1991)
D. OTHER CHILDHOOD MORTALITY RATES
1. Neonatal Mortality Rate
- Deaths in the first 28 days of life per 1000 live births
- About 71.7% of all infant deaths occur in the neonatal period
- 54.6% die in the first week
2. Post-Neonatal Mortality Rate
- Deaths from 28 days to under 1 year per 1000 live births
- India (2018): 9 per 1000 live births
- More influenced by environmental/socioeconomic factors vs. neonatal mortality (which is more affected by biological/congenital factors)
3. Perinatal Mortality Rate (PMR)
- Includes late fetal deaths (stillbirths) + early neonatal deaths (first 7 days)
- Major causes: low birth weight, prematurity, birth trauma, congenital malformations
4. 1-4 Year Mortality Rate (Child Death Rate)
Definition: "Number of deaths of children aged 1-4 years per 1000 children in the same age group in a given year." It thus excludes infant mortality.
Formula:
Child death rate = (No. of deaths of children aged 1-4 years during a year / Mid-year population in age group 1-4 years) × 1000
5. Under-5 Mortality Rate (Child Mortality Rate / U5MR)
Definition (UNICEF): "Annual number of deaths of children aged under 5 years, expressed as a rate per 1000 live births." More specifically, it measures the probability of dying between birth and exactly 5 years of age.
"UNICEF considers this as the best single indicator of social development and well-being rather than GNP per capita, as the former reflects income, nutrition, health care and basic education."
Formula:
Child mortality rate = (Number of deaths of children less than 5 years of age in a given year / Number of live births in the same year) × 1000
Global data:
- U5MR fell to 39 per 1000 live births in 2018, from 93 in 1990 (58% reduction)
- 1990: 1 in 11 children dying before age 5 → 2018: 1 in 26
- Total under-5 deaths dropped from 12.6 million (1990) to 5.3 million (2018); average 14,520 children/day in 2018
- Sub-Saharan Africa: highest U5MR - 78 per 1000 (1 in 13 children)
- About 30% of under-5 mortality in 2018 occurred in Southern Asia
6. Child Survival Rate
Complementary to U5MR; reflects the probability of a child surviving to age 5.
7. Stillbirth Rate
- Refers to fetal deaths after 28 weeks of gestation
- Counted per 1000 total births (live births + stillbirths)
Summary Table: Childhood Mortality Rates at a Glance
| Rate | Definition | Denominator | Multiplier |
|---|
| Neonatal MR | Deaths in first 28 days | 1000 live births | × 1000 |
| Post-neonatal MR | Deaths 28 days - <1 year | 1000 live births | × 1000 |
| IMR | Deaths <1 year | 1000 live births | × 1000 |
| 1-4 year MR | Deaths 1-4 years | Mid-year pop. 1-4 yrs | × 1000 |
| U5MR | Deaths <5 years | 1000 live births | × 1000 |
| PMR | Stillbirths + early neonatal deaths | 1000 total births | × 1000 |
| MMR | Maternal deaths | 100,000 live births | × 100,000 |
All content strictly from: Park's Textbook of Preventive and Social Medicine - Chapter on Demography and Vital Statistics.