
Approach to autoimmune encephalitis seminar with labelled images prepare best ppt wtthi proper font
autoimmune encephalitis MRI brain antibody
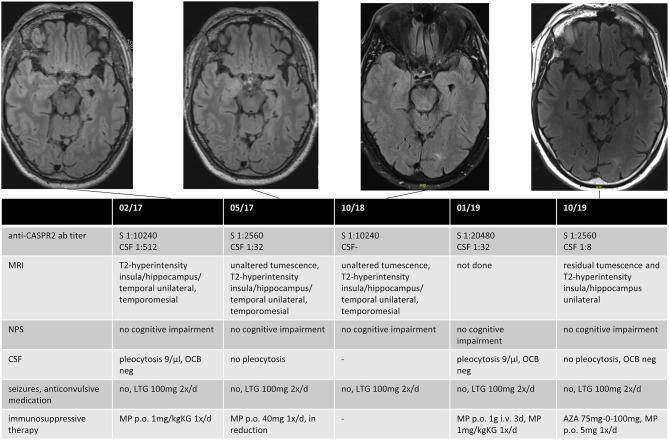
This composite educational resource demonstrates the longitudinal clinical course of a patient with anti-CASPR2 antibody-positive autoimmune encephalitis. The image consists of two primary components: a sequence of four axial brain MRI (FLAIR/T2-weighted) slices and a corresponding data table tracking clinical parameters from February 2017 to October 2019. The MRI scans illustrate the progression of unilateral (right-sided) signal abnormalities, showing initial T2-hyperintensity and tumescence in the insula, hippocampus, and mesial temporal lobe, which transitions to residual tumescence and hyperintensity over the follow-up period. The data table provides a multi-modal timeline correlating these imaging findings with anti-CASPR2 antibody titers in serum and CSF, neuropsychological testing (NPS) results, cerebrospinal fluid (CSF) analysis (pleocytosis and oligoclonal bands), seizure frequency under anticonvulsive medication (Lamotrigin), and immunosuppressive treatment regimens (Methylprednisolon and Azathioprine). This comparison chart is designed to teach the diagnostic and monitoring protocols for autoimmune encephalitis, highlighting the relationship between serological markers, clinical stability, and radiological resolution.
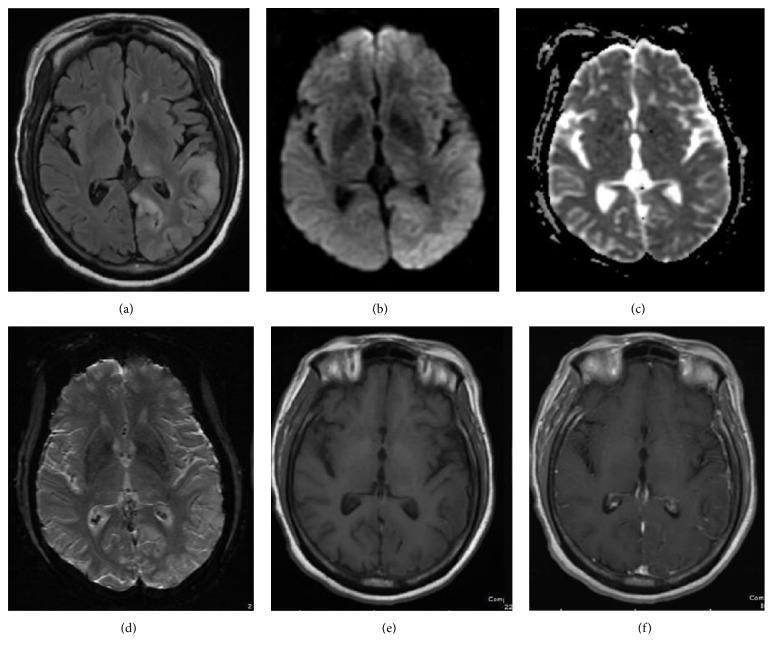
This diagnostic multi-sequence MRI of the brain illustrates a 6-panel series (a-f) used to evaluate subacute neurological changes, specifically GAD65-antibody associated autoimmune encephalitis. The axial FLAIR image (a) demonstrates hyperintense signal and gyriform swelling within the cortex and subcortical white matter of the left parieto-occipital lobe, with an additional hyperintense focus in the left thalamus. Corresponding Diffusion-Weighted Imaging (b) and Apparent Diffusion Coefficient (c) maps reveal mild restricted diffusivity in the affected cortical regions, suggesting cytotoxic edema. The susceptibility-weighted image (d) shows no evidence of hemorrhage or mineral deposition. Pre-contrast (e) and post-gadolinium T1-weighted (f) images show no significant mass effect or pathological enhancement, differentiating this inflammatory/autoimmune process from neoplastic or acute infectious etiologies. This imaging profile is characteristic of autoimmune encephalitides, where cortical signal changes occur without significant contrast enhancement or acute hemorrhagic transformation.
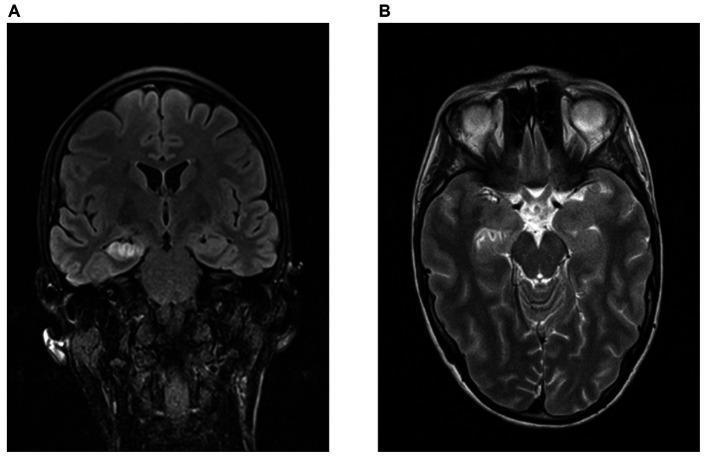
Magnetic Resonance Imaging (MRI) of the brain in a patient with GAD-antibody-associated limbic encephalitis. Panel A displays a coronal FLAIR (Fluid-Attenuated Inversion Recovery) sequence showing marked hyperintensity and swelling in the right hippocampus and mesial temporal lobe. Panel B shows a transversal T2-weighted sequence highlighting increased signal intensity in the right amygdala complex, hippocampus, and nucleus accumbens. These findings are consistent with active inflammation and space-occupying effects in the limbic system, characteristic of autoimmune encephalitis. The images illustrate the typical neuroradiological presentation used to diagnose hippocampal pathology, demonstrating asymmetrical signal changes and morphological swelling compared to the healthy contralateral left side.
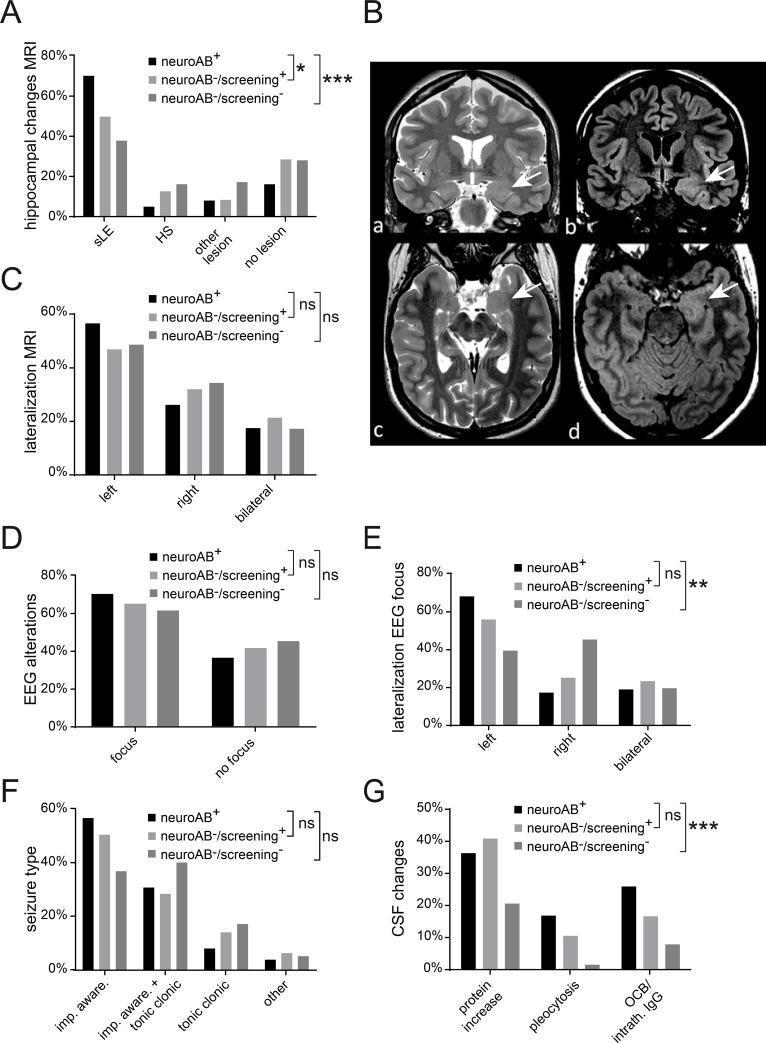
Educational medical graphic combining diagnostic imaging and comparative clinical data regarding autoimmune encephalitis. Panel B presents four MRI brain scans of a patient with anti-GAD65 limbic encephalitis. Coronal T2-weighted (a) and FLAIR (b) images, along with axial T2 (c) and FLAIR (d) images, demonstrate unilateral swelling and hyperintensity of the left hippocampus (white arrows) compared to the normal contralateral right side, signifying acute inflammatory edema. Panels A, C, D, E, F, and G consist of bar graphs stratifying patients into three groups based on neural antibody status (neuroAB+, neuroAB-/screening+, and neuroAB-/screening-). These charts compare clinical parameters including MRI hippocampal findings (sLE, HS, other), MRI and EEG lateralization, presence of EEG foci, seizure types (focal impaired awareness, tonic-clonic), and cerebrospinal fluid (CSF) inflammatory markers (protein levels, pleocytosis, oligoclonal bands). The data illustrates a higher frequency of limbic encephalitis-suspicious MRI changes and inflammatory CSF profiles in neuroAB+ patients compared to antibody-negative screening groups.
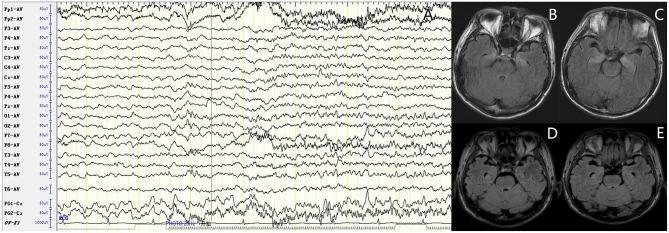
This composite image consists of an electroencephalogram (EEG) trace and comparative axial brain MRI scans, illustrating a case of LGI1 antibody-associated autoimmune encephalitis. Panel A displays a multi-channel ictal EEG showing rhythmic sharp wave discharges with progressive modulation of amplitude and frequency, localized primarily to the bilateral temporal regions, indicative of a subclinical seizure. Panels B and C are pre-treatment axial MRI slices using Fluid-Attenuated Inversion Recovery (FLAIR) sequences, demonstrating prominent hyperintense (high signal) lesions in the bilateral hippocampus, a hallmark finding in limbic encephalitis. Panels D and E show follow-up axial FLAIR MRI scans approximately three months later, following immunotherapy. These subsequent images reveal a significant resolution and reduction of the previously noted hippocampal hyperintensities, demonstrating a positive radiologic response to treatment. The collection serves to correlate neurophysiological seizure activity with structural inflammatory changes and their resolution in autoimmune encephalitis.
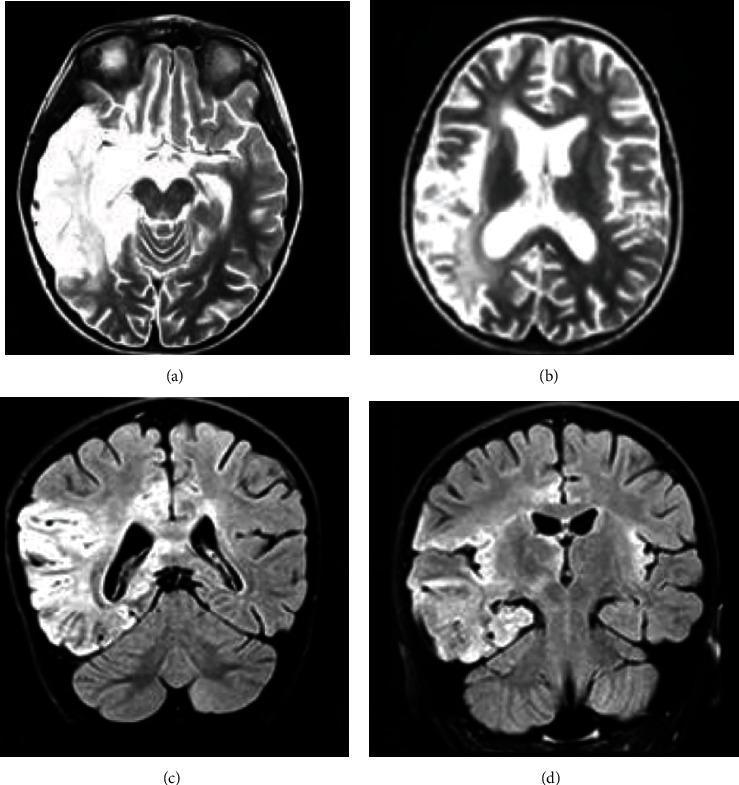
This diagnostic imaging panel consists of four brain MRI scans demonstrating findings associated with post-HSV-1 autoimmune encephalitis (NMDAR antibody-positive). The images include axial T2-weighted sequences (a, b) and coronal Fluid-Attenuated Inversion Recovery (FLAIR) sequences (c, d). All four views reveal prominent, confluent area of increased signal intensity (hyperintensity) localized to the right temporoparietal lobe. The pathology exhibits a corticosubcortical distribution, involving both the cerebral cortex and the underlying white matter. The T2 and FLAIR hyperintensities suggest significant vasogenic edema or inflammatory tissue changes within the affected region. These findings are characteristic of the neuroinflammatory processes seen in secondary autoimmune encephalitis following a viral trigger. The panel serves as a clinical example of how different MRI modalities can highlight localized inflammatory lesions in the temporal and parietal regions, essential for the diagnosis and management of complex neurological disorders.
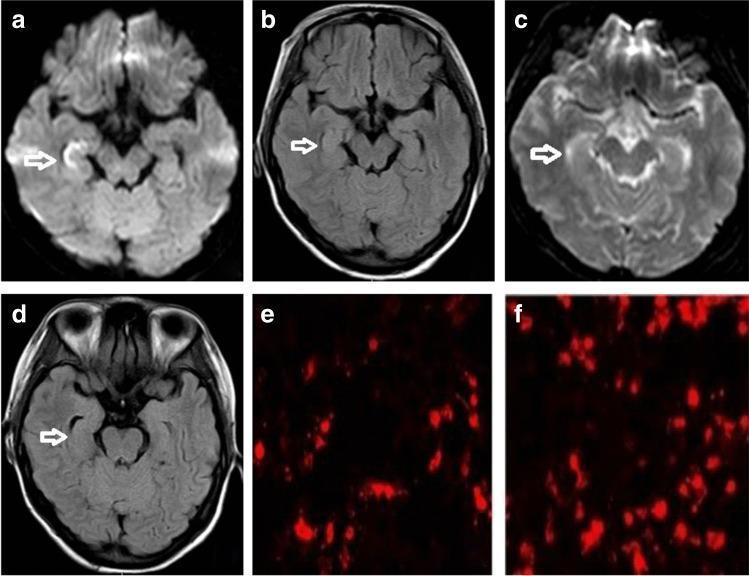
This composite image illustrates diagnostic findings for anti-NMDAR encephalitis, organized into brain MRI scans and indirect immunofluorescence microscopy. Panels (a-d) present axial brain MRI sequences. Panels (a) and (b) show Diffusion-Weighted Imaging (DWI) and Fluid-Attenuated Inversion Recovery (FLAIR) sequences, respectively, at initial presentation, highlighting hyperintense signals in the right hippocampus (marked by white arrows). Panels (c) and (d) demonstrate a follow-up MRI showing the resolution or decrease of these hyperintensities in the same anatomical region. Panels (e) and (f) display immunofluorescence assays for anti-NMDAR antibody titers. Panel (e) depicts a titer of 1:32, showing scattered red fluorescent signals against a dark background. Panel (f) shows a higher antibody titer of 1:320, characterized by a significantly increased density and clustering of red fluorescent signals. These visuals provide a clinical comparison between neuroimaging markers of limbic involvement and laboratory-confirmed antibody concentrations in autoimmune encephalitis.
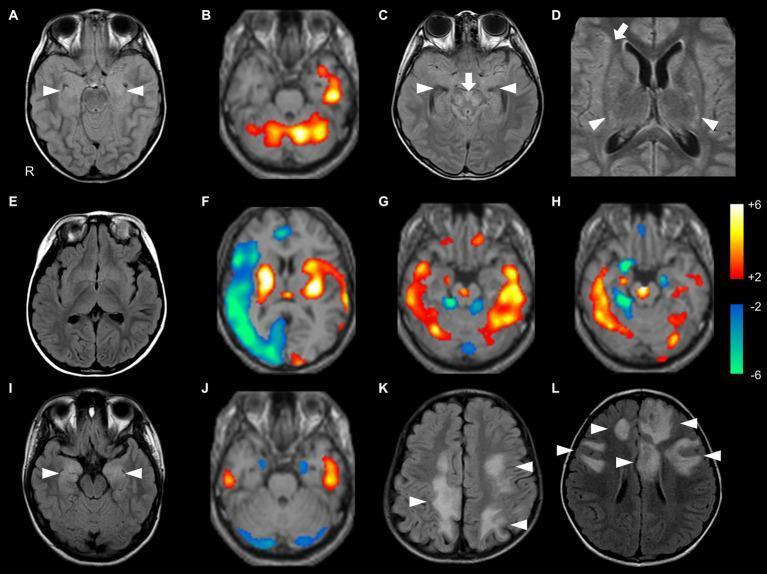
This composite figure presents brain neuroimaging findings comparing antibody-negative pediatric autoimmune encephalitis (AE), NMDA receptor encephalitis (NMDARE), and myelin oligodendrocyte glycoprotein-associated disease (MOGAD) using axial FLAIR MRI and 99mTc-ECD-SPECT. (A, C, D) FLAIR sequences in antibody-negative AE demonstrate hyperintense signals in the bilateral medial temporal lobes, brainstem, basal ganglia, and right insula. (B, F, G, H) Corresponding SPECT images utilize a Z-score color scale (range -6 to +6) to show regional perfusion abnormalities, including hyperperfusion (warm colors) in the left temporal lobe and cerebellum, and hypoperfusion (cool colors) in the right hemisphere. (I, J) NMDARE findings show medial temporal hyperintensities on FLAIR and bilateral temporal hyperperfusion on SPECT. (K, L) MOGAD is characterized by extensive, multifocal hyperintense lesions across the bilateral cerebral hemispheres on FLAIR. The collection illustrates the diagnostic utility of combining structural MRI with functional SPECT to identify metabolic and inflammatory patterns in pediatric neuroinflammatory disorders, highlighting that functional abnormalities may persist even when structural MRI appears normal (E).
NMDAR anti-NMDA receptor encephalitis clinical features psychiatric symptoms
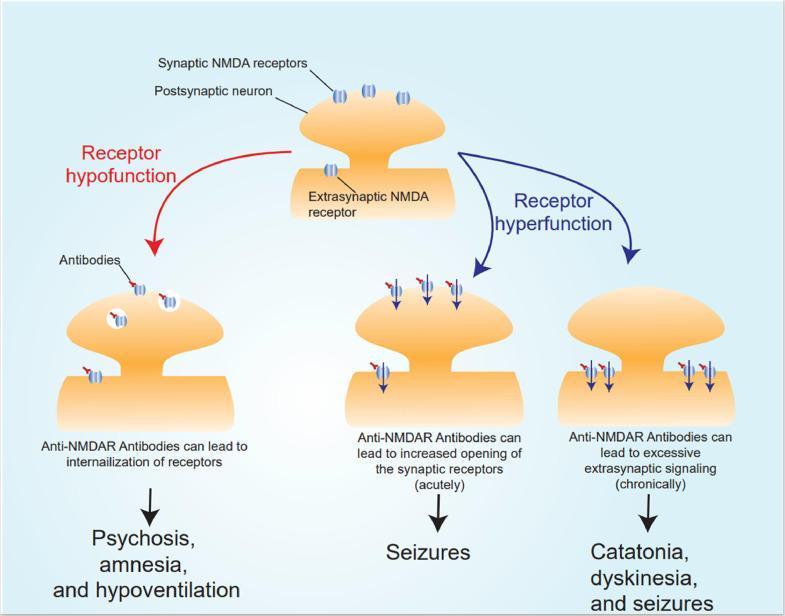
A pathophysiology diagram illustrating the cellular mechanisms and clinical manifestations of anti-NMDA receptor (NMDAr) encephalitis at the postsynaptic neuron. The illustration is divided into two primary pathological pathways: Receptor hypofunction and Receptor hyperfunction. Under 'Receptor hypofunction,' anti-NMDAR antibodies bind to synaptic NMDA receptors, leading to their internalization; this process is linked to symptoms including psychosis, amnesia, and hypoventilation. Under 'Receptor hyperfunction,' two temporal scenarios are presented: an acute phase where antibodies increase the opening of synaptic receptors, leading to seizures, and a chronic phase characterized by excessive extrasynaptic signaling, resulting in catatonia, dyskinesia, and seizures. The diagram demonstrates the relationship between antibody-mediated receptor modulation (internalization versus hyperactivation) and the diverse neuropsychiatric presentation of autoimmune encephalitis.

This diagnostic comparison chart features axial and sagittal F18-FDG-PET/MRI fusion scans illustrating the metabolic evolution of anti-NMDA receptor (NMDAR) encephalitis. The images are divided into two columns: the 'Acute phase' (Week 2) and the 'Follow-up' (Month 3). In the acute phase (A), the F18-FDG-PET shows significant glucose hypermetabolism (red/orange) in the bilateral insular and prefrontal cortices, accompanied by relative hypometabolism (cool blue/green) in the occipital and posterior parietal lobes. In the follow-up phase (B), after treatment and clinical improvement, the metabolic pattern has shifted dramatically. The previously hypermetabolic insular and hippocampal regions now exhibit marked glucose hypometabolism, while glucose uptake in the prefrontal, occipital, and parietal regions has normalized. These co-registered images demonstrate the characteristic metabolic fluctuations associated with autoimmune encephalitis, emphasizing the value of PET imaging in monitoring disease progression and response to immunotherapy beyond conventional MRI findings.
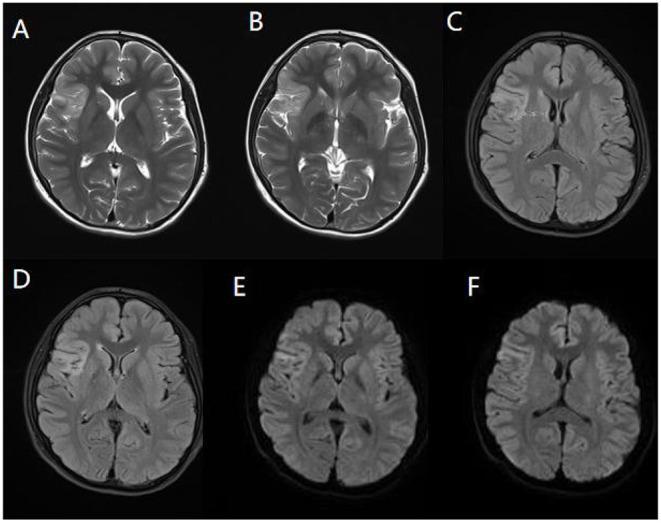
This diagnostic imaging panel consists of axial brain MRI slices from a pediatric patient, demonstrating radiological findings associated with anti-NMDA receptor encephalitis. The panel includes three sequences: T2-weighted imaging (A, B), Fluid-Attenuated Inversion Recovery (FLAIR) (C, D), and Diffusion-Weighted Imaging (DWI) (E, F). The images reveal significant hyperintense (high signal) abnormalities localized to the right temporal lobe, insula, and frontal cingulate gyrus. These lesions exhibit a characteristic lamellar morphology along the cortical and subcortical regions. T2WI (A, B) shows increased signal intensity indicative of vasogenic edema or inflammation. FLAIR images (C, D) highlight these same regions by suppressing cerebrospinal fluid signal, emphasizing the cortical involvement. DWI scans (E, F) demonstrate restricted diffusion within the affected areas, suggesting acute inflammatory cytotoxic changes. These multi-sequence findings are key diagnostic indicators for autoimmune encephalitis in clinical settings, particularly when presenting with pediatric convulsions and anti-NMDAR antibody positivity.
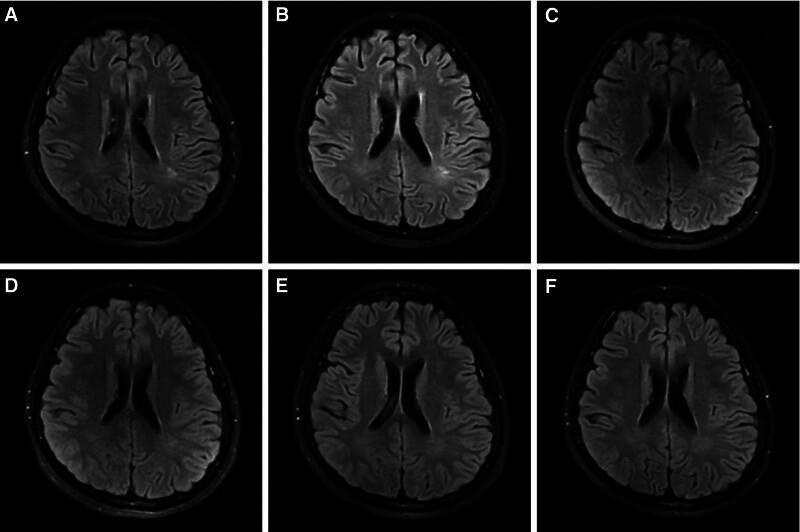
This diagnostic image series consists of six axial cranial MRI scans (labeled A to F) primarily utilizing Fluid-Attenuated Inversion Recovery (FLAIR) sequences to track the progression of Anti-NMDA receptor (NMDAR) encephalitis. In the initial scans (A and B), flaky, hyperintense (high) signal abnormalities are visible in the left parietal lobe and the periventricular white matter adjacent to the triangular regions of the lateral ventricles. Over a longitudinal timeline, scan C demonstrates a transition to speckled hyperintensities in the left parietal region. Subsequent scans (D, E, and F) illustrate a significant reduction in these signal abnormalities, showing progressive resolution of the white matter lesions. By the final follow-up scan (F), the brain parenchyma exhibits a normalized signal with no significant residual abnormal intensities. This series serves as an educational tool for neuroradiology and neurology, demonstrating the characteristic reversible white matter signal changes associated with the clinical course and treatment response of autoimmune encephalitis in a pediatric patient.
autoimmune encephalitis treatment algorithm immunotherapy flowchart
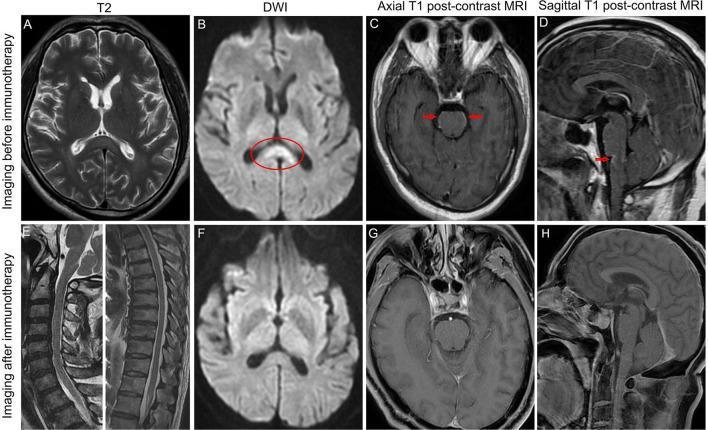
This composite of magnetic resonance imaging (MRI) scans demonstrates a case of autoimmune encephalitis (specifically anti-GFAP astrocytopathy) before and after immunotherapy. The top row (A-D) shows pre-treatment findings: (A) axial T2-weighted and (B) diffusion-weighted imaging (DWI) reveal hyperintensity in the splenium of the corpus callosum (red oval). (C) Axial and (D) sagittal post-contrast T1-weighted sequences show linear leptomeningeal enhancement along the ventral surface of the pons and medulla (red arrows). Panel (E) presents a sagittal T2-weighted view of the cervical and thoracic spinal cord showing normal signal intensity. The bottom row (F-H) illustrates the treatment response post-immunotherapy: (F) axial DWI shows complete resolution of the corpus callosum hyperintensity, and (G, H) axial and sagittal post-contrast T1-weighted sequences show the disappearance of the previously noted leptomeningeal enhancement in the brainstem. This image serves as a clinical comparison of inflammatory central nervous system changes and their radiological resolution following targeted immunosuppressive therapy.
Summary : This flowchart outlines the initial treatment algorithm for autoimmune hepatitis, detailing decision points, medication choices, and monitoring steps based on patient characteristics and adverse events. flowchart: # Nodes : • "Major concern re cosmetic AEs (and no cirrhosis)?" (rectangle) • "Yes" (rectangle) • "Major AEs" (rectangle) • "Budesonide 9 mg/day" (rectangle) • "Change" (ellipse, red) • "No" (rectangle) • "Prednisolone 30-40 mg or 1 mg/kg/day (tapered)" (rectangle) • "Major AEs" (rectangle) • "Check and update vaccination status (Section F)" (rectangle) • "Severe TPMT deficiency?" (rectangle) • "No" (rectangle) • "Add" (ellipse, red) • "Azathioprine 1 mg/kg/day" (rectangle) • "Major AEs" (rectangle) • "Change" (ellipse, red) • "Monitor (Table 9)" (rectangle) • "Slowly reduce steroids" (rectangle) • "Address bone health (Fig 3)" (rectangle) • "Adequate response:" (rectangle) • "AST/ALT fall>50% over 4 weeks and normal serum transaminases and IgG within 6 months (confirmed 2-4 weeks later)" (rectangle) • "Yes" (rectangle) • "Phase out steroids over 1-3 months; consider adrenal insufficiency (Table 13)" (rectangle) • "No" (rectangle) • "Optimise treatment (Table 11)" (rectangle) • "Alternative agents (Table 12)" (rectangle) • "Yes" (rectangle) • "Add" (ellipse, red) • "Mycophenolate 1-2 gm/day (if conception prevented)" (rectangle) • "Decompensated cirrhosis" (rectangle) • "Acute severe AIH" (rectangle) • "AIH diagnosis uncertain" (rectangle) • "Potential precipitant" (rectangle) • "Prednisolone alone 30-40 mg/day" (rectangle) # Connectors : • Arrows indicate decision flow, with branches for "Yes" and "No" responses. • "Major concern re cosmetic AEs (and no cirrhosis)?" splits to "Yes" (leading to Budesonide) and "No" (leading to Prednisolone). • "Severe TPMT deficiency?" splits to "No" (leading to Azathioprine) and "Yes" (leading to Mycophenolate). • "Major AEs" nodes trigger "Change" actions, redirecting to alternative medications. • Monitoring and response nodes lead to either phasing out steroids or optimizing treatment. • Special conditions (decompensated cirrhosis, acute severe AIH, etc.) direct to Prednisolone alone. # Layout : • The flowchart is organized in a top-down manner, starting with initial assessment and branching based on patient-specific factors. • Decision diamonds and rectangles are used for choices and actions, with red ellipses marking points of change or addition. • The chart includes feedback loops for adverse events and monitoring. # Analysis : • The flowchart provides a clear, stepwise approach to initial autoimmune hepatitis treatment, emphasizing individualized therapy based on adverse events, cosmetic concerns, and specific contraindications. • It highlights the importance of monitoring, steroid tapering, and alternative immunosuppressive agents for patients with intolerance or contraindications. • Special populations (e.g., those with cirrhosis or severe disease) are managed with simplified regimens. • The algorithm ensures safety checks (e.g., vaccination status, bone health) and adapts therapy based on response and side effects.
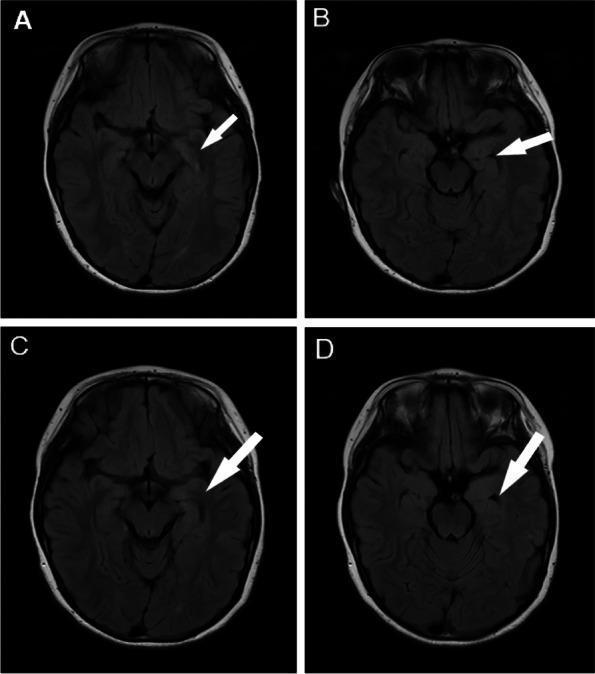
This Comparison Chart displays four axial brain MRI T2-weighted Fluid-Attenuated Inversion Recovery (FLAIR) images, labeled A through D, organized to show the progression of a pediatric patient with Anti-LGI1 autoimmune encephalitis before and after immunotherapy. Images A and B represent the pre-treatment baseline. Image A features a white arrow pointing to a localized area of hyperintensity in the left temporal pole, indicative of cortical/subcortical edema. Image B shows the associated compression of the temporal horn of the lateral ventricle. Images C and D represent the post-treatment state following intravenous immunoglobulin and corticosteroids. Image C demonstrates a slight reduction in the signal intensity and extent of the hyperintensity in the left temporal pole compared to Image A. Image D shows an enlarged left temporal horn (indicated by a white arrow) relative to Image B, signaling the resolution of local mass effect as the edema subsides. This clinical imaging series illustrates the radiological response of limbic encephalitis to immunosuppressive therapy.
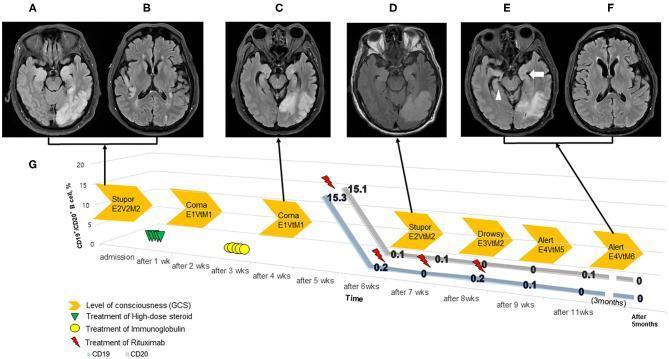
Educational infographic illustrating the clinical course of autoimmune encephalitis through a longitudinal timeline and corresponding neuroimaging. Panels A-F show axial T2-FLAIR brain MRI images at different stages. Initial images (A, B) demonstrate significant hyperintensity and swelling (edema) in the hippocampi, temporal cortex, thalami, and parietal lobes. Intermediate and follow-up images (C-F) show the regression of these lesions following immunotherapy. Panel E highlights residual hyperintensity and evolving atrophy in the medial temporal lobes, indicated by a white arrow (left) and arrowhead (right). Panel G presents a timeline over five months, correlating Glasgow Coma Scale (GCS) scores with treatment interventions—including high-dose steroids (green triangles), IVIg (yellow circles), and Rituximab (red lightning bolts)—and CD19+/CD20+ B-cell counts. The graph visualizes the depletion of B-cells following Rituximab administration and the subsequent improvement in the patient's neurological status from coma/stupor to an alert state.
LGI1 CASPR2 GABA encephalitis EEG seizure
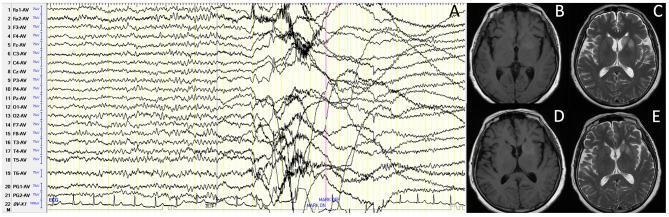
This composite educational graphic displays diagnostic findings from a 63-year-old female with LGI1 antibody-associated autoimmune encephalitis. Panel A shows an ictal EEG recording of a faciobranchial dystonia seizure (FBDS). The tracing demonstrates a 1-second electrodecremental event (amplitude suppression) across all leads immediately preceding clinical onset, followed by high-amplitude movement artifacts and a return to background rhythm. Panels B through E present axial brain MRI scans focusing on the basal ganglia. Images B (T1-weighted) and C (T2-weighted) were captured 19 days after symptom onset, revealing hyperintense signals in the left caudate and lenticular nuclei. Images D (T1-weighted) and E (T2-weighted) show follow-up imaging 33 days after onset (10 days post-immunotherapy), demonstrating significant radiological improvement with resolution of the previously seen signal abnormalities. The content illustrates the characteristic electroclinical and neuroimaging features of LGI1-AE and its responsiveness to treatment.
This composite image consists of an electroencephalogram (EEG) trace and comparative axial brain MRI scans, illustrating a case of LGI1 antibody-associated autoimmune encephalitis. Panel A displays a multi-channel ictal EEG showing rhythmic sharp wave discharges with progressive modulation of amplitude and frequency, localized primarily to the bilateral temporal regions, indicative of a subclinical seizure. Panels B and C are pre-treatment axial MRI slices using Fluid-Attenuated Inversion Recovery (FLAIR) sequences, demonstrating prominent hyperintense (high signal) lesions in the bilateral hippocampus, a hallmark finding in limbic encephalitis. Panels D and E show follow-up axial FLAIR MRI scans approximately three months later, following immunotherapy. These subsequent images reveal a significant resolution and reduction of the previously noted hippocampal hyperintensities, demonstrating a positive radiologic response to treatment. The collection serves to correlate neurophysiological seizure activity with structural inflammatory changes and their resolution in autoimmune encephalitis.
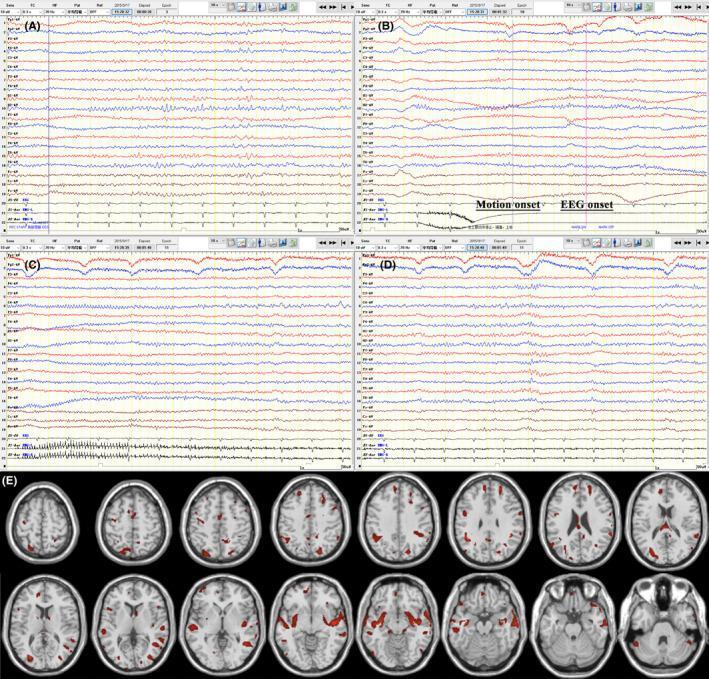
Educational composite image illustrating electroencephalogram (EEG) findings and brain PET imaging in a patient with anti-LGI1 autoimmune encephalitis. Panels A–D present longitudinal EEG traces: (A) shows the interictal phase with stable baseline activity; (B) marks the ictal transition with annotations for 'Motion onset' and 'EEG onset,' characterized by low-amplitude fast rhythms in the right central leads; (C) and (D) demonstrate the evolution of the seizure, showing progressive increases in signal amplitude and rhythmic discharges. Panel E displays axial 18F-FDG-PET scan slices with z-score metabolic mapping overlaid on a structural MRI template. The PET images reveal multifocal, scattered areas of hypermetabolism (indicated by red clusters) involving the bilateral frontal, parietal, temporal, and occipital cortices, as well as the basal ganglia, cingulate gyrus, and cerebellum. This visual synthesis demonstrates the correlation between focal electrical seizure activity and widespread cortical/subcortical metabolic dysfunction characteristic of autoimmune-mediated epilepsy.
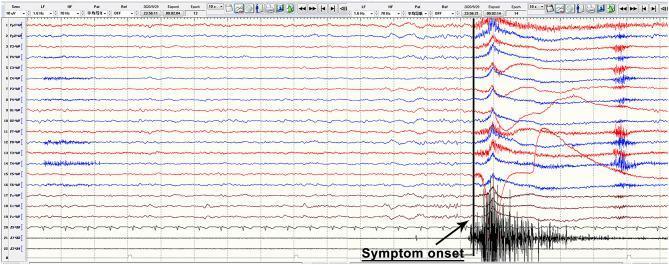
This diagnostic image shows a continuous 22-channel scalp electroencephalogram (EEG) recording from a patient with anti-LGI1 encephalitis during a faciobrachial dystonic seizure (FBDS). The tracing is divided into two distinct phases by a vertical black line marked 'Symptom onset'. Prior to the marker, the EEG demonstrates a relatively stable, low-to-moderate amplitude rhythmic background without clear epileptiform discharges or focal slowing. Following the 'Symptom onset' marker, there is a notable absence of typical ictal rhythmic evolution; instead, the tracing is dominated by prominent high-amplitude, irregular movement artifacts. These artifacts are most severe in the lower channels (specifically channels 18–22), likely representing muscle activity (EMG) and movement related to the clinical manifestation of the seizure, such as twitching of the arm or face. The image serves as a clinical example of how FBDS often presents with movement-induced artifacts on EEG rather than clear electrographic ictal patterns, highlighting the diagnostic challenges in autoimmune epilepsy.
mkdir -p /tmp/workspace/autoimmune-encephalitis-ppt && ls /tmp/workspace/
~/autoimmune-encephalitis-ppt/build_ppt.py
import subprocess, json, base64, sys
from io import BytesIO
from pptx import Presentation
from pptx.util import Inches, Pt, Emu
from pptx.dml.color import RGBColor
from pptx.enum.text import PP_ALIGN, MSO_ANCHOR
from pptx.oxml.ns import qn
from lxml import etree

# ── Colour palette (deep medical navy + accent) ──────────────────────────────
NAVY   = RGBColor(0x0D, 0x2B, 0x55)   # deep navy – slide backgrounds
TEAL   = RGBColor(0x00, 0x7B, 0x8E)   # teal accent
GOLD   = RGBColor(0xF5, 0xA6, 0x23)   # gold highlight
WHITE  = RGBColor(0xFF, 0xFF, 0xFF)
LGREY  = RGBColor(0xF0, 0xF4, 0xF8)   # light bg for content slides
DGREY  = RGBColor(0x33, 0x33, 0x44)   # dark text
RED    = RGBColor(0xD6, 0x2B, 0x2B)
GREEN  = RGBColor(0x1A, 0x7A, 0x3C)

W = Inches(13.333)
H = Inches(7.5)

# ── Helper: fetch images ─────────────────────────────────────────────────────
def fetch_images(urls):
    result = subprocess.check_output(
        ["python", "/tmp/skills/shared/scripts/fetch_images.py"] + urls
    )
    return json.loads(result)

# ── Helper: add background rectangle ─────────────────────────────────────────
def fill_bg(slide, color):
    from pptx.util import Emu
    bg = slide.shapes.add_shape(1, 0, 0, W, H)
    bg.fill.solid()
    bg.fill.fore_color.rgb = color
    bg.line.fill.background()
    return bg

def add_rect(slide, x, y, w, h, fill_color, line_color=None):
    shape = slide.shapes.add_shape(1, x, y, w, h)
    shape.fill.solid()
    shape.fill.fore_color.rgb = fill_color
    if line_color:
        shape.line.color.rgb = line_color
        shape.line.width = Pt(1)
    else:
        shape.line.fill.background()
    return shape

def add_text(slide, text, x, y, w, h, font_name="Calibri", font_size=18,
             bold=False, italic=False, color=WHITE, align=PP_ALIGN.LEFT,
             word_wrap=True, v_anchor=MSO_ANCHOR.TOP):
    tb = slide.shapes.add_textbox(x, y, w, h)
    tf = tb.text_frame
    tf.word_wrap = word_wrap
    tf.vertical_anchor = v_anchor
    tf.margin_left = 0; tf.margin_right = 0
    tf.margin_top = 0;  tf.margin_bottom = 0
    p = tf.paragraphs[0]
    p.alignment = align
    run = p.add_run()
    run.text = text
    run.font.name = font_name
    run.font.size = Pt(font_size)
    run.font.bold = bold
    run.font.italic = italic
    run.font.color.rgb = color
    return tf

def add_multiline(slide, lines, x, y, w, h,
                  font_name="Calibri", font_size=16, bold=False,
                  color=WHITE, align=PP_ALIGN.LEFT, line_spacing_pt=None):
    tb = slide.shapes.add_textbox(x, y, w, h)
    tf = tb.text_frame
    tf.word_wrap = True
    tf.margin_left = 0; tf.margin_right = 0
    tf.margin_top = 0;  tf.margin_bottom = 0
    first = True
    for line in lines:
        if first:
            p = tf.paragraphs[0]
            first = False
        else:
            p = tf.add_paragraph()
        p.alignment = align
        if line_spacing_pt:
            from pptx.util import Pt as _Pt
            p.line_spacing = _Pt(line_spacing_pt)
        run = p.add_run()
        run.text = line
        run.font.name = font_name
        run.font.size = Pt(font_size)
        run.font.bold = bold
        run.font.color.rgb = color
    return tf

def add_image_from_b64(slide, b64_str, x, y, w, h):
    mime, data = b64_str.split(";base64,", 1)
    raw = base64.b64decode(data)
    bio = BytesIO(raw)
    slide.shapes.add_picture(bio, x, y, w, h)

def header_bar(slide, title, subtitle=None):
    """Dark navy top bar with title."""
    add_rect(slide, 0, 0, W, Inches(1.15), NAVY)
    add_rect(slide, 0, Inches(1.15), W, Inches(0.06), GOLD)
    add_text(slide, title, Inches(0.4), Inches(0.12), Inches(11), Inches(0.75),
             font_name="Calibri", font_size=28, bold=True, color=WHITE)
    if subtitle:
        add_text(slide, subtitle, Inches(0.4), Inches(0.82), Inches(11), Inches(0.36),
                 font_name="Calibri", font_size=15, italic=True, color=GOLD)

def slide_label(slide, text, x, y, w=Inches(3.5), bg=TEAL):
    add_rect(slide, x, y, w, Inches(0.32), bg)
    add_text(slide, text, x+Inches(0.1), y+Inches(0.04),
             w-Inches(0.2), Inches(0.28),
             font_name="Calibri", font_size=11, bold=True,
             color=WHITE, align=PP_ALIGN.LEFT)

# ============================================================
prs = Presentation()
prs.slide_width  = W
prs.slide_height = H
blank = prs.slide_layouts[6]

# ─── IMAGE URLS ──────────────────────────────────────────────────────────────
IMG_URLS = {
    "caspr2_mri":   "https://cdn.orris.care/cdss_images/pmc_clinical_VQA_4e0cbefd0fa33ce042fd4d18bca219e8df8acfbbc2229a1193d7ab3a69b8f715.jpg",
    "gad65_mri":    "https://cdn.orris.care/cdss_images/pmc_clinical_VQA_37dfaa3dbfdcb4ad251aed43591a2ecb32f1efa3d576de67ad5e36d62d875d66.jpg",
    "limbic_mri":   "https://cdn.orris.care/cdss_images/pmc_clinical_VQA_9c6e410584f2af7ab1a3f6fa85b462d93516f4b364b7ec3639499e702d39c2ff.jpg",
    "lgi1_eeg_mri": "https://cdn.orris.care/cdss_images/pmc_clinical_VQA_80f7a3a4f60125557b6b7603f4b33b349ec88b3813753f45a115c024dcc51201.jpg",
    "nmdar_path":   "https://cdn.orris.care/cdss_images/pmc_clinical_VQA_a852f38328817fff57a0fe9ffdaaea6e811580ff6639da5d82139b7ea6c33fcf.jpg",
    "lgi1_fbds":    "https://cdn.orris.care/cdss_images/pmc_clinical_VQA_f101b94e50c46fad7e6ff07aecb53af3d906ed3a2eac30fdc0c28b85fb2b3022.jpg",
    "treatment_mri":"https://cdn.orris.care/cdss_images/pmc_clinical_VQA_5d0af84fa4b42359af2ace1013d3e7db3539453befb99e2ead83e69f9e7c514c.jpg",
    "nmdar_mri":    "https://cdn.orris.care/cdss_images/pmc_clinical_VQA_039a9897e6f2530bac8a23cb87798417a4c216c8ae65052dc1e30389d3a3f7c0.jpg",
}

print("Fetching images ...")
imgs = fetch_images(list(IMG_URLS.values()))
img_map = {k: imgs[i] for i, k in enumerate(IMG_URLS.keys())}
print("Done fetching images.")

# ════════════════════════════════════════════════════════════════════════════
# SLIDE 1 ── TITLE
# ════════════════════════════════════════════════════════════════════════════
slide = prs.slides.add_slide(blank)
fill_bg(slide, NAVY)
add_rect(slide, 0, Inches(2.4), W, Inches(0.08), GOLD)
add_rect(slide, 0, Inches(5.1), W, Inches(0.08), TEAL)

add_text(slide,
    "APPROACH TO AUTOIMMUNE ENCEPHALITIS",
    Inches(0.6), Inches(1.1), Inches(12.1), Inches(1.5),
    font_name="Calibri", font_size=44, bold=True, color=WHITE,
    align=PP_ALIGN.CENTER)

add_text(slide,
    "A Comprehensive Clinical Seminar",
    Inches(1.5), Inches(2.55), Inches(10.3), Inches(0.7),
    font_name="Calibri", font_size=22, italic=True, color=GOLD,
    align=PP_ALIGN.CENTER)

add_multiline(slide,
    ["Neurology  |  Neuroimmunology  |  Critical Care",
     "Based on Harrison's, Adams & Victor's, Goldman-Cecil Medicine"],
    Inches(1.5), Inches(5.25), Inches(10.3), Inches(0.9),
    font_name="Calibri", font_size=16, color=RGBColor(0xCC, 0xDD, 0xFF),
    align=PP_ALIGN.CENTER)

# decorative side lines
for xp in [Inches(0.25), Inches(13.0)]:
    add_rect(slide, xp, Inches(0), Inches(0.04), H, TEAL)

# ════════════════════════════════════════════════════════════════════════════
# SLIDE 2 ── OVERVIEW / OUTLINE
# ════════════════════════════════════════════════════════════════════════════
slide = prs.slides.add_slide(blank)
fill_bg(slide, LGREY)
header_bar(slide, "Seminar Outline", "Key learning objectives")

topics = [
    "01   Definition, Epidemiology & Pathogenesis",
    "02   Classification – Cell-Surface vs. Intracellular Antibodies",
    "03   Clinical Syndromes: Limbic, NMDAR, LGI1, CASPR2, GABA & More",
    "04   Diagnostic Approach: MRI, EEG, CSF & Antibody Testing",
    "05   Red Flags & Differential Diagnosis",
    "06   Graus Diagnostic Criteria (2016)",
    "07   Management – First-Line & Second-Line Immunotherapy",
    "08   Prognosis, Relapse & Long-term Follow-up",
]

add_rect(slide, Inches(0.5), Inches(1.4), Inches(12.3), Inches(5.7), WHITE,
         line_color=RGBColor(0xCC, 0xCC, 0xCC))
for i, t in enumerate(topics):
    yy = Inches(1.55) + i * Inches(0.66)
    col = TEAL if i % 2 == 0 else NAVY
    add_rect(slide, Inches(0.55), yy, Inches(0.35), Inches(0.50), col)
    add_text(slide, t, Inches(1.05), yy + Inches(0.07),
             Inches(11.5), Inches(0.45),
             font_name="Calibri", font_size=17, bold=(i == 0), color=DGREY)

# ════════════════════════════════════════════════════════════════════════════
# SLIDE 3 ── DEFINITION & EPIDEMIOLOGY
# ════════════════════════════════════════════════════════════════════════════
slide = prs.slides.add_slide(blank)
fill_bg(slide, LGREY)
header_bar(slide, "Definition & Epidemiology",
           "Autoimmune Encephalitis – Setting the Scene")

# left text panel
add_rect(slide, Inches(0.4), Inches(1.35), Inches(6.0), Inches(5.8), WHITE,
         line_color=RGBColor(0xCC, 0xCC, 0xDD))
add_text(slide, "DEFINITION", Inches(0.55), Inches(1.45),
         Inches(5.7), Inches(0.38),
         font_name="Calibri", font_size=14, bold=True, color=TEAL)

definition_lines = [
    "• Autoimmune encephalitis (AE) = brain inflammation caused by",
    "  misdirected immune responses against neuronal/glial antigens.",
    "",
    "• Presents subacutely (< 3 months): cognitive decline, psychiatric",
    "  symptoms, seizures, movement disorders, autonomic dysfunction.",
    "",
    "• Incidence: ~1–2 per 100,000/year — now comparable to infectious",
    "  encephalitis (Dubey et al.; Adams & Victor's, 12th Ed.).",
    "",
    "• Affects all ages; NMDAR encephalitis is the most common AE,",
    "  especially in young women with ovarian teratoma.",
    "",
    "• Up to 60% of paraneoplastic cases: neurological sx precede cancer.",
]
add_multiline(slide, definition_lines,
              Inches(0.55), Inches(1.9), Inches(5.7), Inches(4.9),
              font_name="Calibri", font_size=13.5, color=DGREY)

# right: MRI image with label
if img_map["limbic_mri"]["base64"]:
    add_image_from_b64(slide, img_map["limbic_mri"]["base64"],
                       Inches(6.7), Inches(1.35), Inches(6.3), Inches(4.0))
slide_label(slide,
    "FIGURE 1 – Limbic Encephalitis MRI: Coronal FLAIR shows R hippocampal\n"
    "hyperintensity & swelling (GAD-Ab, Mesial Temporal Involvement)",
    Inches(6.7), Inches(5.35), w=Inches(6.3), bg=NAVY)

# stat boxes
for xi, (stat, lbl) in enumerate([
    ("~1–2/100k", "Annual incidence"),
    ("60%", "Neuro sx before cancer"),
    (">40", "Antibodies identified"),
]):
    xx = Inches(6.8) + xi * Inches(2.05)
    add_rect(slide, xx, Inches(5.85), Inches(1.85), Inches(0.85), TEAL)
    add_text(slide, stat, xx + Inches(0.1), Inches(5.87),
             Inches(1.7), Inches(0.45),
             font_name="Calibri", font_size=20, bold=True, color=WHITE,
             align=PP_ALIGN.CENTER)
    add_text(slide, lbl, xx + Inches(0.05), Inches(6.32),
             Inches(1.75), Inches(0.35),
             font_name="Calibri", font_size=10, color=WHITE,
             align=PP_ALIGN.CENTER)

# ════════════════════════════════════════════════════════════════════════════
# SLIDE 4 ── PATHOGENESIS
# ════════════════════════════════════════════════════════════════════════════
slide = prs.slides.add_slide(blank)
fill_bg(slide, LGREY)
header_bar(slide, "Pathogenesis",
           "Cell-Surface vs. Intracellular Targets – Mechanism & Relevance")

# image left
if img_map["nmdar_path"]["base64"]:
    add_image_from_b64(slide, img_map["nmdar_path"]["base64"],
                       Inches(0.4), Inches(1.35), Inches(6.0), Inches(4.5))
slide_label(slide,
    "FIGURE 2 – Anti-NMDAR Pathophysiology: Antibody-mediated receptor\n"
    "internalization → hypofunction (psychosis, amnesia) vs. hyperfunction\n"
    "(seizures, dyskinesias). [PMC Clinical VQA]",
    Inches(0.4), Inches(5.85), w=Inches(6.0), bg=NAVY)

# right panel – two boxes
add_rect(slide, Inches(6.7), Inches(1.35), Inches(6.3), Inches(2.65),
         RGBColor(0xE8, 0xF4, 0xFF), line_color=TEAL)
add_text(slide, "CELL-SURFACE ANTIBODIES (low-risk for cancer)",
         Inches(6.85), Inches(1.42), Inches(6.0), Inches(0.4),
         font_name="Calibri", font_size=13, bold=True, color=TEAL)
cs_lines = [
    "Target: ion channels, receptors, synaptic proteins",
    "Pathogenic: directly alter receptor function / clustering",
    "Often reversible with immunotherapy",
    "Examples: NMDAR, LGI1, CASPR2, AMPAR, GABAR, DPPX,",
    "  IgLON5, mGluR1, Glycine-R, VGCC",
]
add_multiline(slide, cs_lines, Inches(6.85), Inches(1.85),
              Inches(6.0), Inches(2.1),
              font_name="Calibri", font_size=13, color=DGREY)

add_rect(slide, Inches(6.7), Inches(4.15), Inches(6.3), Inches(2.65),
         RGBColor(0xFF, 0xF0, 0xF0), line_color=RED)
add_text(slide, "INTRACELLULAR ANTIBODIES (high-risk for cancer)",
         Inches(6.85), Inches(4.22), Inches(6.0), Inches(0.4),
         font_name="Calibri", font_size=13, bold=True, color=RED)
ic_lines = [
    "Target: nuclear/cytoplasmic proteins (onconeuronal antigens)",
    "Pathogenic: T-cell cytotoxicity >> antibody effect",
    "Less responsive to immunotherapy; irreversible neuronal loss",
    "Examples: anti-Hu, anti-Yo, anti-Ri, anti-CRMP5, anti-Ma,",
    "  anti-amphiphysin (Harrison's 22E, Table 99-2 to 99-4)",
]
add_multiline(slide, ic_lines, Inches(6.85), Inches(4.6),
              Inches(6.0), Inches(2.1),
              font_name="Calibri", font_size=13, color=DGREY)

# ════════════════════════════════════════════════════════════════════════════
# SLIDE 5 ── ANTI-NMDAR ENCEPHALITIS
# ════════════════════════════════════════════════════════════════════════════
slide = prs.slides.add_slide(blank)
fill_bg(slide, LGREY)
header_bar(slide, "Anti-NMDA Receptor Encephalitis",
           "Most common autoimmune encephalitis – young women, ovarian teratoma")

# image right
if img_map["nmdar_mri"]["base64"]:
    add_image_from_b64(slide, img_map["nmdar_mri"]["base64"],
                       Inches(7.2), Inches(1.35), Inches(5.7), Inches(4.5))
slide_label(slide,
    "FIGURE 3 – Anti-NMDAR Encephalitis MRI & Immunofluorescence:\n"
    "R hippocampal FLAIR hyperintensity (a,b) resolving post-Rx (c,d);\n"
    "Anti-NMDAR IgG titers 1:32→1:320 (e,f). [PMC Clinical VQA]",
    Inches(7.2), Inches(5.85), w=Inches(5.7), bg=NAVY)

# five-stage progression
add_rect(slide, Inches(0.4), Inches(1.35), Inches(6.5), Inches(5.8), WHITE,
         line_color=RGBColor(0xCC, 0xCC, 0xDD))
add_text(slide, "5-STAGE CLINICAL PROGRESSION", Inches(0.55), Inches(1.42),
         Inches(6.2), Inches(0.4),
         font_name="Calibri", font_size=13.5, bold=True, color=NAVY)
stages = [
    ("Stage 1 – Prodrome (0–5d)",
     "Headache, fever, viral-like illness; herpes trigger in some"),
    ("Stage 2 – Psychosis (1–3wk)",
     "Hallucinations, delusions, agitation, anxiety; often first psych admission"),
    ("Stage 3 – Unresponsive (wks)",
     "Stupor, orofacial dyskinesias, autonomic instability, hypoventilation"),
    ("Stage 4 – Hyperkinesias",
     "Chorea, dystonia, opisthotonos; status epilepticus common"),
    ("Stage 5 – Recovery (mos–yrs)",
     "Gradual, often complete recovery; memory deficit may persist"),
]
for i, (title, detail) in enumerate(stages):
    yy = Inches(1.88) + i * Inches(0.97)
    col = [TEAL, NAVY, RGBColor(0x7B,0x2D,0x8B), RED, GREEN][i]
    add_rect(slide, Inches(0.5), yy, Inches(0.25), Inches(0.78), col)
    add_text(slide, title, Inches(0.85), yy + Inches(0.03),
             Inches(5.9), Inches(0.36),
             font_name="Calibri", font_size=13, bold=True, color=col)
    add_text(slide, detail, Inches(0.85), yy + Inches(0.38),
             Inches(5.9), Inches(0.4),
             font_name="Calibri", font_size=12, color=DGREY)

# ════════════════════════════════════════════════════════════════════════════
# SLIDE 6 ── LGI1 & CASPR2 ENCEPHALITIS
# ════════════════════════════════════════════════════════════════════════════
slide = prs.slides.add_slide(blank)
fill_bg(slide, LGREY)
header_bar(slide, "LGI1 & CASPR2 Antibody Encephalitis",
           "Voltage-gated potassium channel complex antibodies")

# Left: LGI1 image
if img_map["lgi1_fbds"]["base64"]:
    add_image_from_b64(slide, img_map["lgi1_fbds"]["base64"],
                       Inches(0.4), Inches(1.35), Inches(5.8), Inches(4.3))
slide_label(slide,
    "FIGURE 4 – LGI1 Encephalitis: Ictal EEG of faciobrachial dystonic\n"
    "seizure (FBDS) with electrodecrement; basal ganglia hyperintensity\n"
    "pre- and post-immunotherapy. [PMC Clinical VQA]",
    Inches(0.4), Inches(5.65), w=Inches(5.8), bg=NAVY)

# Right two columns
for col_i, (ab, color, items) in enumerate([
    ("LGI1 Ab", TEAL, [
        "Demographics: Older men (50–70y)",
        "Hallmark: Faciobrachial Dystonic\n  Seizures (FBDS) – brief arm+face twitch",
        "Also: Limbic encephalitis, hyponatraemia\n  (SIADH), REM sleep disorder",
        "MRI: T2/FLAIR hippocampus, BG; may\n  be normal early",
        "EEG: Often non-specific; brief\n  electrodecrement with FBDS",
        "Tumor: Thymoma (~5–10%); mostly\n  non-paraneoplastic",
        "Rx: Excellent response to steroids;\n  early treatment prevents hippocampal Δ",
    ]),
    ("CASPR2 Ab", NAVY, [
        "Demographics: Middle-aged men",
        "Morvan's syndrome: neuropathic pain,\n  neuromyotonia, insomnia, autonomic dx",
        "Also: Limbic encephalitis, cerebellar\n  ataxia, peripheral nerve hyperexcitability",
        "MRI: Mesial temporal, FLAIR changes;\n  may show basal ganglia signal",
        "Serum: Anti-CASPR2 IgG; confirm\n  in CSF for higher specificity",
        "Tumor: Thymoma (~20–50%)",
        "Rx: Steroids + IVIG ± rituximab;\n  neuromyotonia may need carbamazepine",
    ]),
]):
    xx = Inches(6.45) + col_i * Inches(3.35)
    add_rect(slide, xx, Inches(1.35), Inches(3.15), Inches(5.85),
             WHITE, line_color=color)
    add_rect(slide, xx, Inches(1.35), Inches(3.15), Inches(0.45), color)
    add_text(slide, ab, xx + Inches(0.1), Inches(1.38),
             Inches(2.9), Inches(0.38),
             font_name="Calibri", font_size=15, bold=True, color=WHITE)
    add_multiline(slide, items, xx + Inches(0.12), Inches(1.88),
                  Inches(2.95), Inches(4.9),
                  font_name="Calibri", font_size=11.5, color=DGREY)

# ════════════════════════════════════════════════════════════════════════════
# SLIDE 7 ── DIAGNOSTIC APPROACH
# ════════════════════════════════════════════════════════════════════════════
slide = prs.slides.add_slide(blank)
fill_bg(slide, LGREY)
header_bar(slide, "Diagnostic Approach",
           "Step-by-step evaluation of suspected autoimmune encephalitis")

# Flowchart-style boxes
steps = [
    (TEAL,  "STEP 1 – CLINICAL SUSPICION",
     "Subacute onset (<3mo) of: memory loss / behavioural change / seizures /\n"
     "movement disorder / decreased consciousness / autonomic instability"),
    (NAVY,  "STEP 2 – INITIAL WORKUP",
     "MRI brain (FLAIR/T2/DWI/Gd) • EEG (temporal slowing, delta brush) •\n"
     "CSF: pleocytosis, oligoclonal bands, elevated protein • CBC, CMP, TFTs, drug screen"),
    (RGBColor(0x7B,0x2D,0x8B), "STEP 3 – EXCLUDE INFECTIONS",
     "HSV/VZV/EBV PCR in CSF • Blood cultures • HIV • Bacterial meningitis screen\n"
     "Consider empirical acyclovir while awaiting results"),
    (RED,   "STEP 4 – ANTIBODY PANEL (Serum + CSF)",
     "Cell-surface: NMDAR, LGI1, CASPR2, AMPAR, GABAR, DPPX, mGluR5, IgLON5\n"
     "Intracellular: anti-Hu, Yo, Ri, CRMP5, Ma2, amphiphysin, GAD65, GFAP"),
    (RGBColor(0x1A,0x5C,0x7A), "STEP 5 – TUMOUR SCREEN",
     "CT chest/abdomen/pelvis • PET-CT if CT negative •\n"
     "Pelvic US (women <45y for ovarian teratoma) • Testicular US in men"),
    (GREEN, "STEP 6 – GRAUS CRITERIA 2016 → Definite / Probable / Possible AE",
     "Apply clinical + antibody + MRI + EEG + CSF criteria → stratify and initiate Rx"),
]

for i, (col, title, detail) in enumerate(steps):
    row, c = divmod(i, 2)
    xx = Inches(0.4) + c * Inches(6.45)
    yy = Inches(1.38) + row * Inches(1.98)
    add_rect(slide, xx, yy, Inches(6.2), Inches(1.85), WHITE,
             line_color=col)
    add_rect(slide, xx, yy, Inches(6.2), Inches(0.38), col)
    add_text(slide, title, xx + Inches(0.1), yy + Inches(0.04),
             Inches(6.0), Inches(0.32),
             font_name="Calibri", font_size=12, bold=True, color=WHITE)
    add_multiline(slide, detail.split("\n"), xx + Inches(0.12), yy + Inches(0.44),
                  Inches(5.95), Inches(1.35),
                  font_name="Calibri", font_size=11.5, color=DGREY)

# ════════════════════════════════════════════════════════════════════════════
# SLIDE 8 ── MRI FINDINGS (Image-heavy)
# ════════════════════════════════════════════════════════════════════════════
slide = prs.slides.add_slide(blank)
fill_bg(slide, LGREY)
header_bar(slide, "Neuroimaging in Autoimmune Encephalitis",
           "MRI brain – key patterns, sequences and differential")

# Image grid 2×2
grid = [
    (img_map["limbic_mri"],   "FIGURE 5 – GAD65 Ab Limbic Encephalitis:\nCoronal FLAIR – R hippocampal T2\nhyperintensity & swelling"),
    (img_map["gad65_mri"],    "FIGURE 6 – GAD65 Ab AE: 6-panel MRI\n(FLAIR, DWI, ADC, SWI, T1±Gd) –\nL parieto-occipital cortical FLAIR ↑"),
    (img_map["lgi1_eeg_mri"], "FIGURE 7 – LGI1 Ab AE: Temporal EEG\nsharp waves; FLAIR bilateral\nhippocampal hyperintensity, pre & post-Rx"),
    (img_map["caspr2_mri"],   "FIGURE 8 – CASPR2 Ab AE: Longitudinal\nMRI (Feb'17–Oct'19), insula/hippocampal\nT2 changes vs. antibody titer & treatment"),
]
positions = [
    (Inches(0.3),  Inches(1.32)),
    (Inches(6.65), Inches(1.32)),
    (Inches(0.3),  Inches(4.22)),
    (Inches(6.65), Inches(4.22)),
]
for (img_d, lbl), (gx, gy) in zip(grid, positions):
    if img_d["base64"]:
        add_image_from_b64(slide, img_d["base64"], gx, gy,
                           Inches(6.1), Inches(2.55))
    slide_label(slide, lbl, gx, gy + Inches(2.55), w=Inches(6.1), bg=NAVY)

# ════════════════════════════════════════════════════════════════════════════
# SLIDE 9 ── EEG & CSF
# ════════════════════════════════════════════════════════════════════════════
slide = prs.slides.add_slide(blank)
fill_bg(slide, LGREY)
header_bar(slide, "EEG & CSF Findings",
           "Neurophysiology and cerebrospinal fluid analysis")

# Left: LGI1 EEG-MRI image
if img_map["lgi1_fbds"]["base64"]:
    add_image_from_b64(slide, img_map["lgi1_fbds"]["base64"],
                       Inches(0.4), Inches(1.35), Inches(5.8), Inches(4.1))
slide_label(slide,
    "FIGURE 9 – LGI1 FBDS: 1-sec electrodecrement on EEG at seizure onset;\n"
    "basal ganglia T1/T2 hyperintensity resolving post-immunotherapy.",
    Inches(0.4), Inches(5.45), w=Inches(5.8), bg=NAVY)

# Right: EEG findings box
add_rect(slide, Inches(6.5), Inches(1.35), Inches(6.5), Inches(2.7), WHITE,
         line_color=TEAL)
add_rect(slide, Inches(6.5), Inches(1.35), Inches(6.5), Inches(0.4), TEAL)
add_text(slide, "EEG FINDINGS IN AE", Inches(6.65), Inches(1.38),
         Inches(6.2), Inches(0.35),
         font_name="Calibri", font_size=13, bold=True, color=WHITE)
eeg_lines = [
    "• Non-specific temporal / generalised slowing (most common)",
    "• Delta brush – pathognomonic of anti-NMDAR encephalitis",
    "• Extreme delta brush: semi-rhythmic delta + beta superimposition",
    "• Ictal discharges: temporal sharp waves, subclinical SE",
    "• FBDS (LGI1): brief electrodecrement ± normal interictal EEG",
    "• Background suppression may indicate severe encephalopathy",
]
add_multiline(slide, eeg_lines, Inches(6.65), Inches(1.82),
              Inches(6.2), Inches(2.15),
              font_name="Calibri", font_size=12.5, color=DGREY)

# CSF box
add_rect(slide, Inches(6.5), Inches(4.2), Inches(6.5), Inches(2.85), WHITE,
         line_color=NAVY)
add_rect(slide, Inches(6.5), Inches(4.2), Inches(6.5), Inches(0.4), NAVY)
add_text(slide, "CSF FINDINGS IN AE", Inches(6.65), Inches(4.23),
         Inches(6.2), Inches(0.35),
         font_name="Calibri", font_size=13, bold=True, color=WHITE)
csf_lines = [
    "• Lymphocytic pleocytosis (10–100 cells/μL) in ~80%",
    "• Mildly elevated protein (normal to <100 mg/dL)",
    "• Oligoclonal bands: ~60% positive (IgG synthesis)",
    "• Glucose: normal (helps exclude bacterial/TB meningitis)",
    "• Antibody testing: CSF > serum sensitivity for NMDAR Ab",
    "• Normal CSF does NOT exclude AE — test both serum + CSF",
    "• GFAP Ab in CSF: marker of astrocytopathy / overlap syndromes",
]
add_multiline(slide, csf_lines, Inches(6.65), Inches(4.67),
              Inches(6.2), Inches(2.3),
              font_name="Calibri", font_size=12.5, color=DGREY)

# ════════════════════════════════════════════════════════════════════════════
# SLIDE 10 ── GRAUS CRITERIA 2016
# ════════════════════════════════════════════════════════════════════════════
slide = prs.slides.add_slide(blank)
fill_bg(slide, LGREY)
header_bar(slide, "Graus Diagnostic Criteria (2016)",
           "Framework for definite / probable / possible AE diagnosis")

# 3 columns
for ci, (label, col, items) in enumerate([
    ("POSSIBLE AE", TEAL, [
        "Subacute onset (<3 months):",
        "  1) Working memory deficit OR",
        "     altered mental status OR",
        "     psychiatric symptoms",
        "  2) At least 1 of the following:",
        "     • New focal CNS findings",
        "     • Seizures not explained by",
        "       known epilepsy",
        "     • CSF pleocytosis (>5 WBC)",
        "     • MRI brain suggesting AE",
        "  3) Reasonable exclusion of",
        "     other causes",
    ]),
    ("PROBABLE AE", NAVY, [
        "All 3 criteria of Possible AE +",
        "",
        "At least 1 of the following:",
        "  • CSF pleocytosis / OC bands",
        "  • MRI: bilateral T2/FLAIR",
        "    mesial temporal signal",
        "  • Specific EEG abnormality",
        "    (focal temporal slowing,",
        "    epileptic activity in MTL)",
        "  • Identified associated tumour",
        "",
        "Start empirical immunotherapy",
        "while awaiting antibody results",
    ]),
    ("DEFINITE AE", RED, [
        "Probable criteria met +",
        "",
        "Positive antibody test:",
        "  (serum or CSF – cell-surface",
        "   or intracellular Ab panel)",
        "",
        "OR:",
        "  Neuropathological confirmation",
        "  of autoimmune encephalitis on",
        "  brain biopsy",
        "",
        "Antibody-negative AE still",
        "possible if all criteria met",
    ]),
]):
    xx = Inches(0.4) + ci * Inches(4.3)
    add_rect(slide, xx, Inches(1.35), Inches(4.1), Inches(5.9), WHITE,
             line_color=col)
    add_rect(slide, xx, Inches(1.35), Inches(4.1), Inches(0.5), col)
    add_text(slide, label, xx + Inches(0.12), Inches(1.38),
             Inches(3.9), Inches(0.44),
             font_name="Calibri", font_size=16, bold=True, color=WHITE,
             align=PP_ALIGN.CENTER)
    add_multiline(slide, items, xx + Inches(0.18), Inches(1.95),
                  Inches(3.75), Inches(5.2),
                  font_name="Calibri", font_size=12.5, color=DGREY)

# ════════════════════════════════════════════════════════════════════════════
# SLIDE 11 ── DIFFERENTIAL DIAGNOSIS
# ════════════════════════════════════════════════════════════════════════════
slide = prs.slides.add_slide(blank)
fill_bg(slide, LGREY)
header_bar(slide, "Differential Diagnosis",
           "Mimics of autoimmune encephalitis – do not miss")

diffs = [
    ("INFECTIOUS", TEAL, [
        "HSV / VZV encephalitis",
        "Bacterial meningitis",
        "Tuberculous meningoencephalitis",
        "Listeria rhombencephalitis",
        "Prion disease (CJD)",
        "HIV encephalopathy",
        "VDRL-positive neurosyphilis",
    ]),
    ("STRUCTURAL / VASCULAR", NAVY, [
        "Limbic encephalitis mimic: glioma",
        "Bilateral thalamic infarcts",
        "CNS vasculitis",
        "Leptomeningeal carcinomatosis",
        "Progressive multifocal\n  leukoencephalopathy (PML)",
        "ADEM / tumefactive MS",
    ]),
    ("METABOLIC / TOXIC", RGBColor(0x7B,0x2D,0x8B), [
        "Wernicke's encephalopathy",
        "Hepatic encephalopathy",
        "Hypo/hypernatraemia",
        "Hashimoto encephalopathy",
        "Drug-induced (lithium, AED)",
        "Carbon monoxide poisoning",
    ]),
    ("PSYCHIATRIC", RED, [
        "First-break schizophrenia",
        "Bipolar disorder",
        "Catatonia",
        "MDD with psychotic features",
        "Conversion disorder",
        "Malignant catatonia",
    ]),
    ("PARANEOPLASTIC", GREEN, [
        "Anti-Hu (SCLC) – sensory neuronopathy",
        "Anti-Yo (ovary/breast) – CCD",
        "Anti-Ri – opsoclonus-myoclonus",
        "Anti-Ma2 (testis) – limbic-BS enceph",
        "Anti-CRMP5 – multi-system",
        "Lambert-Eaton / MG overlap",
    ]),
]
for ci, (title, col, items) in enumerate(diffs):
    xx = Inches(0.35) + ci * Inches(2.58)
    add_rect(slide, xx, Inches(1.35), Inches(2.42), Inches(5.85), WHITE,
             line_color=col)
    add_rect(slide, xx, Inches(1.35), Inches(2.42), Inches(0.44), col)
    add_text(slide, title, xx + Inches(0.08), Inches(1.38),
             Inches(2.28), Inches(0.38),
             font_name="Calibri", font_size=11, bold=True, color=WHITE,
             align=PP_ALIGN.CENTER)
    add_multiline(slide, items, xx + Inches(0.12), Inches(1.88),
                  Inches(2.2), Inches(5.15),
                  font_name="Calibri", font_size=11.5, color=DGREY)

# ════════════════════════════════════════════════════════════════════════════
# SLIDE 12 ── MANAGEMENT
# ════════════════════════════════════════════════════════════════════════════
slide = prs.slides.add_slide(blank)
fill_bg(slide, LGREY)
header_bar(slide, "Management of Autoimmune Encephalitis",
           "Immunotherapy: first-line, second-line, refractory & supportive")

# treatment image
if img_map["treatment_mri"]["base64"]:
    add_image_from_b64(slide, img_map["treatment_mri"]["base64"],
                       Inches(0.4), Inches(1.35), Inches(5.7), Inches(4.7))
slide_label(slide,
    "FIGURE 10 – Longitudinal MRI & treatment response: FLAIR hippocampal\n"
    "oedema resolving after steroids (↑), IVIG (●) and rituximab (⚡)\n"
    "with corresponding B-cell depletion and GCS improvement. [PMC]",
    Inches(0.4), Inches(6.05), w=Inches(5.7), bg=NAVY)

# treatment tiers
tiers = [
    (TEAL,  "FIRST-LINE  (initiate within days of diagnosis)",
     ["IV Methylprednisolone 1g/day × 5 days",
      "IV Immunoglobulin (IVIG) 0.4 g/kg/day × 5 days",
      "Plasma exchange (PLEX) 5–7 sessions",
      "Tumour removal (if identified) – mandatory; often leads to improvement"]),
    (NAVY,  "SECOND-LINE  (if no improvement within 2–4 weeks)",
     ["Rituximab (anti-CD20) 375 mg/m² weekly × 4 doses",
      "Cyclophosphamide 750 mg/m² monthly",
      "Consider mycophenolate mofetil for maintenance"]),
    (RGBColor(0x7B,0x2D,0x8B), "REFRACTORY  (inadequate response to above)",
     ["Tocilizumab (IL-6R antagonist) – promising case series",
      "Bortezomib (plasma cell depletion)",
      "Daratumumab (anti-CD38 – emerging evidence)"]),
    (GREEN, "SUPPORTIVE & SYMPTOMATIC",
     ["Seizure control: benzodiazepines, LEV, lacosamide (avoid Na-channel blockers in LGI1)",
      "Psychiatric symptoms: low-dose quetiapine / clonazepam; avoid high-dose antipsychotics",
      "ICU if autonomic instability / hypoventilation: ventilatory support, cardiac monitoring"]),
]
for ri, (col, title, items) in enumerate(tiers):
    yy = Inches(1.35) + ri * Inches(1.52)
    xx = Inches(6.35)
    add_rect(slide, xx, yy, Inches(6.55), Inches(1.45), WHITE, line_color=col)
    add_rect(slide, xx, yy, Inches(6.55), Inches(0.38), col)
    add_text(slide, title, xx + Inches(0.1), yy + Inches(0.04),
             Inches(6.3), Inches(0.32),
             font_name="Calibri", font_size=12, bold=True, color=WHITE)
    txt = "  •  ".join(items)
    add_multiline(slide, ["• " + it for it in items],
                  xx + Inches(0.12), yy + Inches(0.42),
                  Inches(6.3), Inches(0.98),
                  font_name="Calibri", font_size=11, color=DGREY)

# ════════════════════════════════════════════════════════════════════════════
# SLIDE 13 ── PROGNOSIS & RELAPSE
# ════════════════════════════════════════════════════════════════════════════
slide = prs.slides.add_slide(blank)
fill_bg(slide, LGREY)
header_bar(slide, "Prognosis, Relapse & Long-term Follow-up",
           "Outcomes vary by antibody, severity & treatment timing")

add_rect(slide, Inches(0.4), Inches(1.35), Inches(12.5), Inches(5.9), WHITE,
         line_color=RGBColor(0xCC,0xCC,0xDD))

# prognosis table
headers = ["Antibody", "Recovery", "Relapse Risk", "Tumour", "Key Prognostic Factor"]
rows = [
    ["Anti-NMDAR",  "~75–80% good outcome",  "~25%",          "Teratoma (OT) 40–50%", "Teratoma removal → faster recovery"],
    ["LGI1",        "~80% good if early Rx", "~20%",          "Thymoma ~5–10%",       "Early steroids prevent hippocampal atrophy"],
    ["CASPR2",      "~60% good",             "~30%",          "Thymoma 20–50%",       "Thymectomy important"],
    ["AMPAR",       "Moderate (relapse-prone)","~50%",         "SCLC, thymoma ~70%",   "Tumour treatment essential"],
    ["GABA-B",      "Moderate",              "~20%",          "SCLC ~50%",            "Worse if Ab high + tumour"],
    ["Anti-Hu/Yo",  "Poor (T-cell mediated)","Rare",          ">70%",                 "Irreversible neuronal loss"],
]

col_widths = [Inches(1.8), Inches(2.1), Inches(1.5), Inches(2.2), Inches(4.65)]
col_starts = [Inches(0.45)]
for w in col_widths[:-1]:
    col_starts.append(col_starts[-1] + w)

# header row
for ci, (h, xs, cw) in enumerate(zip(headers, col_starts, col_widths)):
    add_rect(slide, xs, Inches(1.42), cw, Inches(0.42), NAVY)
    add_text(slide, h, xs + Inches(0.05), Inches(1.44),
             cw - Inches(0.1), Inches(0.38),
             font_name="Calibri", font_size=12.5, bold=True, color=WHITE,
             align=PP_ALIGN.CENTER)

for ri, row in enumerate(rows):
    yy = Inches(1.88) + ri * Inches(0.77)
    bg = LGREY if ri % 2 == 0 else WHITE
    add_rect(slide, Inches(0.45), yy, sum(col_widths), Inches(0.73), bg)
    for ci, (cell, xs, cw) in enumerate(zip(row, col_starts, col_widths)):
        col_c = TEAL if ci == 0 else DGREY
        add_text(slide, cell, xs + Inches(0.06), yy + Inches(0.08),
                 cw - Inches(0.12), Inches(0.6),
                 font_name="Calibri", font_size=11.5, bold=(ci==0), color=col_c)

# note
add_text(slide,
    "Note: Early immunotherapy initiation is the single most modifiable factor improving outcome (Adams & Victor's; Goldman-Cecil).",
    Inches(0.5), Inches(6.8), Inches(12.3), Inches(0.4),
    font_name="Calibri", font_size=11.5, italic=True, color=NAVY)

# ════════════════════════════════════════════════════════════════════════════
# SLIDE 14 ── ANTIBODY TABLE SUMMARY
# ════════════════════════════════════════════════════════════════════════════
slide = prs.slides.add_slide(blank)
fill_bg(slide, LGREY)
header_bar(slide, "Antibody Summary Table",
           "Cell-surface AE antibodies – syndrome, demographics, tumour, Rx")

hdrs = ["Antibody", "Target", "Syndrome", "Age/Sex", "Tumour", "Key Feature", "Response"]
col_ws = [Inches(1.55), Inches(1.3), Inches(2.1), Inches(1.3), Inches(1.55), Inches(2.5), Inches(2.7)]
rows2 = [
    ["Anti-NMDAR",  "GluN1 subunit",  "Limbic + psychosis + dyskinesias + autonomic","Young ♀","OT (40%)",       "Orofacial dyskinesias, delta brush on EEG", "Good ~75%"],
    ["Anti-LGI1",   "LGI1 protein",   "Limbic encephalitis + FBDS",                 "Mid-age ♂","Thymoma (5%)",  "FBDS, hyponatraemia (SIADH)",               "Excellent"],
    ["Anti-CASPR2", "CASPR2 protein", "Morvan's, limbic enceph, neuroMyotonia",      "Mid-age ♂","Thymoma (30%)", "Neuropathic pain, insomnia, autonomic dx",   "Moderate"],
    ["Anti-AMPAR",  "GluA1/A2",       "Limbic encephalitis (relapse-prone)",         "Middle-age","SCLC, thymoma", "High relapse rate; tumour search mandatory", "Moderate"],
    ["Anti-GABAR",  "GABA-B R",       "Limbic encephalitis + refractory seizures",   "Middle-age","SCLC (50%)",   "Status epilepticus; prominent seizures",     "Moderate"],
    ["Anti-DPPX",   "DPPX",           "Hyperekplexia, diarrhoea, encephalopathy",    "Middle-age","Lymphoma (10%)","Exaggerated startle, autonomic dx",          "Variable"],
    ["Anti-IgLON5", "IgLON5",         "Sleep disorder, bulbar, gait, dysautonomia",  "Older",    "None",          "Tauopathy on pathology; parasomnias",        "Poor"],
]

cx = [Inches(0.3)]
for w in col_ws[:-1]:
    cx.append(cx[-1] + w)

for ci, (h, xs, cw) in enumerate(zip(hdrs, cx, col_ws)):
    add_rect(slide, xs, Inches(1.35), cw, Inches(0.42), NAVY)
    add_text(slide, h, xs + Inches(0.04), Inches(1.37),
             cw - Inches(0.08), Inches(0.38),
             font_name="Calibri", font_size=11, bold=True, color=WHITE,
             align=PP_ALIGN.CENTER)

for ri, row in enumerate(rows2):
    yy = Inches(1.81) + ri * Inches(0.79)
    bg = LGREY if ri % 2 == 0 else WHITE
    add_rect(slide, Inches(0.3), yy, sum(col_ws), Inches(0.75), bg)
    for ci, (cell, xs, cw) in enumerate(zip(row, cx, col_ws)):
        col_c = TEAL if ci == 0 else DGREY
        add_text(slide, cell, xs + Inches(0.05), yy + Inches(0.06),
                 cw - Inches(0.1), Inches(0.65),
                 font_name="Calibri", font_size=10.5,
                 bold=(ci == 0), color=col_c, word_wrap=True)

# ════════════════════════════════════════════════════════════════════════════
# SLIDE 15 ── TAKE-HOME MESSAGES
# ════════════════════════════════════════════════════════════════════════════
slide = prs.slides.add_slide(blank)
fill_bg(slide, NAVY)
add_rect(slide, 0, Inches(1.15), W, Inches(0.06), GOLD)

add_text(slide, "KEY TAKE-HOME MESSAGES",
         Inches(0.5), Inches(0.12), Inches(12.3), Inches(0.95),
         font_name="Calibri", font_size=32, bold=True, color=WHITE,
         align=PP_ALIGN.CENTER)

msgs = [
    ("01", "Think AE early", "Subacute psychiatric/cognitive/seizure onset in any age → run antibody panel + MRI + CSF simultaneously."),
    ("02", "Don't wait for antibody results", "Start empirical IVIG/steroids as soon as AE is probable; early treatment = better outcome."),
    ("03", "Treat the tumour", "Tumour removal (teratoma, thymoma, SCLC) is essential — often the most effective immunotherapy."),
    ("04", "Send BOTH serum and CSF", "CSF Ab sensitivity > serum for NMDAR; serum > CSF for LGI1. Dual testing maximises yield."),
    ("05", "Don't miss FBDS in LGI1", "Brief face+arm jerks → immediate steroid treatment prevents hippocampal damage and epilepsy."),
    ("06", "Refractory cases need escalation", "Rituximab, cyclophosphamide, tocilizumab for non-responders; consider ICU-level care."),
    ("07", "Long-term follow-up", "Relapses occur in 20–50%; maintain low-dose steroids ± steroid-sparing agent; monitor for tumour."),
]

for i, (num, title, body) in enumerate(msgs):
    row, col = divmod(i, 2) if i < 6 else (3, 0)
    if i == 6:
        xx = Inches(0.4)
        yy = Inches(5.75)
        ww = Inches(12.5)
    else:
        xx = Inches(0.4) + col * Inches(6.45)
        yy = Inches(1.35) + row * Inches(1.42)
        ww = Inches(6.2)
    add_rect(slide, xx, yy, ww, Inches(1.3), RGBColor(0x1A, 0x3A, 0x60))
    add_rect(slide, xx, yy, Inches(0.52), Inches(1.3), GOLD)
    add_text(slide, num, xx + Inches(0.04), yy + Inches(0.35),
             Inches(0.45), Inches(0.6),
             font_name="Calibri", font_size=17, bold=True,
             color=NAVY, align=PP_ALIGN.CENTER)
    add_text(slide, title, xx + Inches(0.58), yy + Inches(0.05),
             ww - Inches(0.65), Inches(0.42),
             font_name="Calibri", font_size=13.5, bold=True, color=GOLD)
    add_text(slide, body, xx + Inches(0.58), yy + Inches(0.48),
             ww - Inches(0.65), Inches(0.78),
             font_name="Calibri", font_size=11.5, color=WHITE, word_wrap=True)

# ════════════════════════════════════════════════════════════════════════════
# SAVE
# ════════════════════════════════════════════════════════════════════════════
out = "/tmp/workspace/autoimmune-encephalitis-ppt/Autoimmune_Encephalitis_Seminar.pptx"
prs.save(out)
print(f"Saved: {out}")
print(f"Total slides: {len(prs.slides)}")
cd /tmp/workspace/autoimmune-encephalitis-ppt && python build_ppt.py 2>&1
find /tmp/skills -name "fetch_images.py" 2>/dev/null; ls /tmp/skills/ 2>/dev/null; ls /skills/ 2>/dev/null
ls /tmp/skills/pptx/scripts/ 2>/dev/null || echo "NO DIR"; ls /skills/readonly/ 2>/dev/null || echo "NO DIR2"
requests directly.~/autoimmune-encephalitis-ppt/build_ppt.py
Successfully replaced 1 instance(s) of the string in '/tmp/workspace/autoimmune-encephalitis-ppt/build_ppt.py'
cd /tmp/workspace/autoimmune-encephalitis-ppt && python build_ppt.py 2>&1
ls -lh /tmp/workspace/autoimmune-encephalitis-ppt/Autoimmune_Encephalitis_Seminar.pptx
Autoimmune Encephalitis Seminar
Presentation · PPTX
What's Inside - 15 Slides (16:9, Calibri font throughout)
| Slide | Content |
|---|---|
| 1 | Title slide - Deep navy design with gold accent bars |
| 2 | Seminar Outline - 8 topic overview |
| 3 | Definition & Epidemiology - With GAD65 limbic encephalitis MRI (Figure 1) |
| 4 | Pathogenesis - Cell-surface vs. intracellular antibodies; anti-NMDAR mechanism diagram (Figure 2) |
| 5 | Anti-NMDA Receptor Encephalitis - 5-stage clinical progression; NMDAR MRI + immunofluorescence (Figure 3) |
| 6 | LGI1 & CASPR2 Encephalitis - FBDS, Morvan's syndrome; LGI1 ictal EEG + basal ganglia MRI (Figure 4) |
| 7 | Diagnostic Approach - 6-step flowchart: clinical suspicion → workup → infection exclusion → antibody panel → tumour screen → Graus criteria |
| 8 | Neuroimaging - 4-image labelled grid: GAD65, multi-sequence, LGI1 EEG-MRI, CASPR2 longitudinal (Figures 5–8) |
| 9 | EEG & CSF Findings - Delta brush, extreme delta brush, FBDS EEG; CSF pleocytosis, OCBs, antibody testing tips |
| 10 | Graus Criteria 2016 - 3-column: Possible / Probable / Definite AE |
| 11 | Differential Diagnosis - 5-column: Infectious, Structural, Metabolic, Psychiatric, Paraneoplastic |
| 12 | Management - 4-tier: First-line (IVMP, IVIG, PLEX) → Second-line (Rituximab) → Refractory (Tocilizumab) → Supportive; treatment response MRI (Figure 10) |
| 13 | Prognosis & Relapse - Full antibody comparison table (NMDAR, LGI1, CASPR2, AMPAR, GABA-B, Anti-Hu/Yo) |
| 14 | Antibody Summary Table - 7 antibodies × 7 parameters |
| 15 | Take-Home Messages - 7 key clinical pearls on dark navy background |