
menstrual - Anormalities
menstrual cycle abnormalities diagram
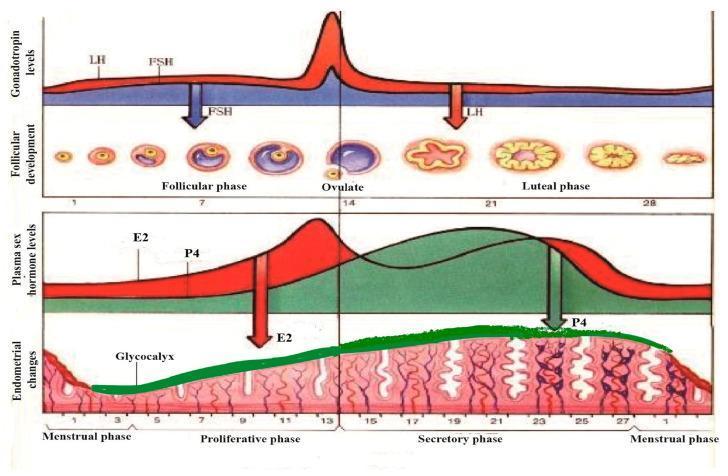
A multi-panel pathophysiology diagram illustrating the synchronous physiological changes during a standard 28-day human menstrual cycle. The top panel graphs gonadotropin levels, showing a sharp surge in Luteinizing Hormone (LH) and a moderate rise in Follicle-Stimulating Hormone (FSH) at day 14, correlating with the follicular phase, ovulation, and luteal phase stages. The corresponding follicular development shows the maturation of a primary follicle into a Graafian follicle, ovulation, and the formation of the corpus luteum and corpus albicans. The middle panel tracks plasma sex hormone levels, highlighting the mid-cycle peak of Estradiol (E2) and the post-ovulatory rise of Progesterone (P4). The bottom panel depicts endometrial morphology, transitioning from the menstrual phase to the proliferative and secretory phases. A green-shaded layer highlights the glycocalyx development, which thickens and becomes most prominent during the secretory phase under the influence of P4, before thinning during menstruation. The diagram demonstrates the hormonal regulation of the ovary and uterine lining for medical educational purposes.
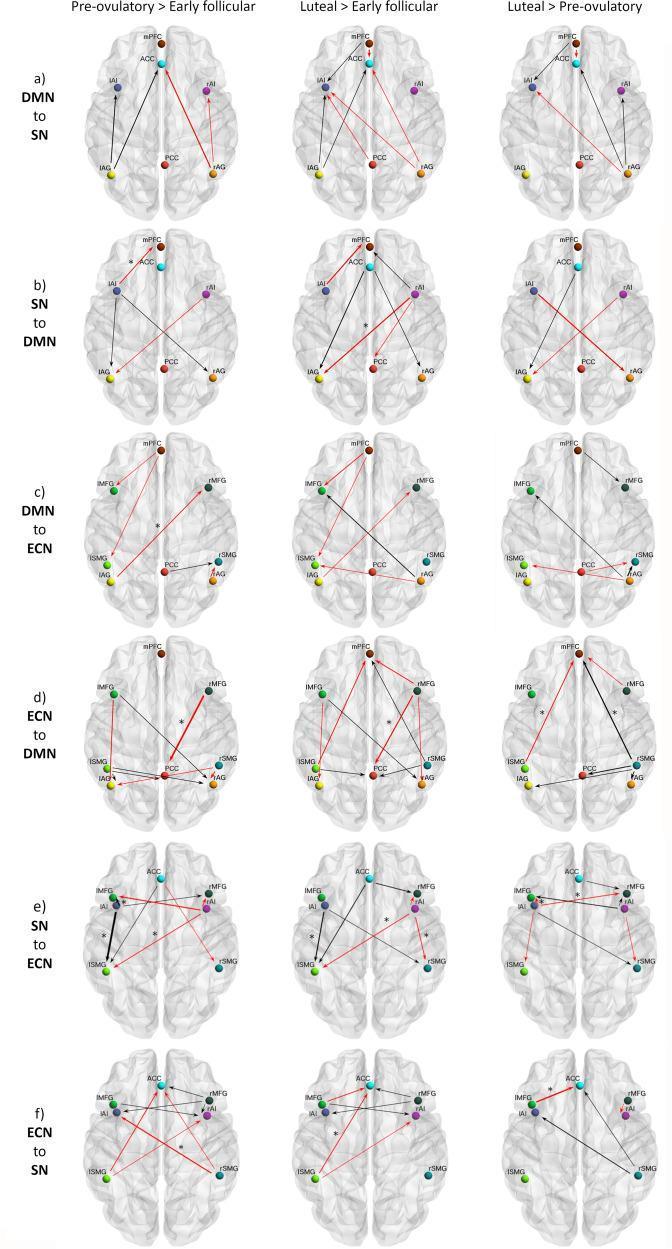
A multi-panel neuroimaging diagram illustrating effective connectivity differences across the menstrual cycle within a triple-network model. The networks include the Default Mode Network (DMN), Salience Network (SN), and Executive Control Network (ECN). The panels (a-f) represent directed connectivity between networks: DMN to SN, SN to DMN, DMN to ECN, ECN to DMN, SN to ECN, and ECN to SN. Results are categorized into three cycle phase comparisons: Pre-ovulatory vs. Early Follicular, Luteal vs. Early Follicular, and Luteal vs. Pre-ovulatory. Brain regions are depicted as colored nodes (e.g., mPFC, PCC, ACC, AI, MFG, SMG) on axial schematic brain templates. Arrows indicate the direction and strength (width) of connectivity differences. Black arrows represent positive differential connectivity, while red arrows represent negative differential connectivity. Asterisks denote connections with high statistical significance (posterior probability >95%). This resource facilitates understanding of how endogenous hormonal fluctuations modulate functional brain architecture and inter-network communication in healthy adult females.
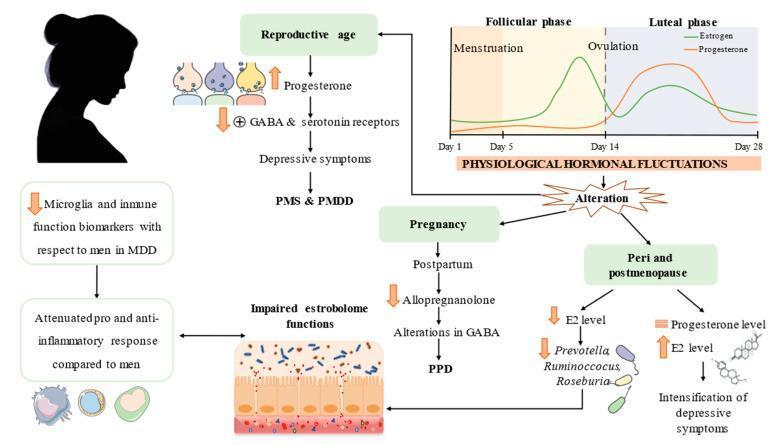
This pathophysiology diagram illustrates hallmarks of major depressive disorder (MDD) across various stages of the female reproductive lifespan, including reproductive age, pregnancy, and peri- and postmenopause. A line graph labeled 'Physiological Hormonal Fluctuations' depicts the 28-day menstrual cycle, showing estrogen peaks prior to ovulation (Day 14) and progesterone dominance during the luteal phase. A signaling pathway shows how progesterone fluctuations lead to GABA and serotonin receptor modulation, contributing to premenstrual syndrome (PMS) and premenstrual dysphoric disorder (PMDD). In the pregnancy/postpartum pathway, reduced allopregnanolone levels and GABA alterations are linked to postpartum depression (PPD). The peri- and postmenopausal section illustrates declining estradiol (E2) and progesterone, linked to the intensification of depressive symptoms. The diagram also highlights secondary factors, including impaired estrobolome function (gut-microbiome-estrogen axis) involving bacteria like Prevotella and Ruminococcus, and an immune component characterized by attenuated microglia and inflammatory responses compared to men. This visualization integrates endocrinology, neurobiology, and immunology to explain sex-specific vulnerabilities in mood disorders.
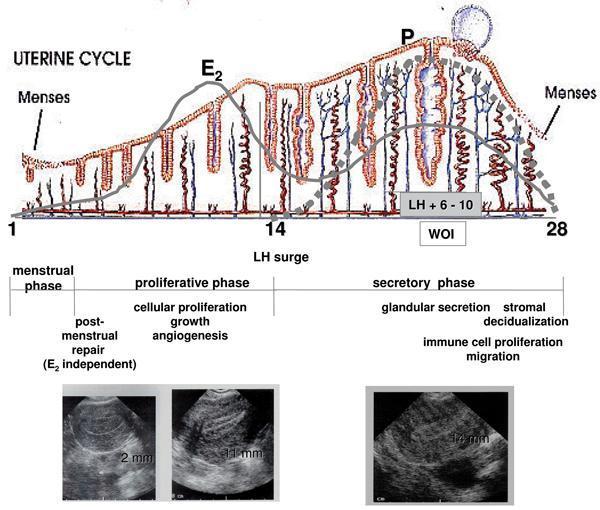
This composite educational graphic illustrates the morphological and hormonal changes of the human endometrium across a standard 28-day uterine cycle. The top section features a pathophysiology diagram showing fluctuations in estradiol (E2) and progesterone (P). E2 peaks during the proliferative phase, correlating with endometrial growth, while P dominates the secretory phase, driving glandular coiling and the 'window of implantation' (WOI). Below the hormone curves, a cross-sectional illustration depicts the histological evolution of endometrial glands and spiral arteries. It transitions from a thin, shedding layer in the menstrual phase to elongated glands during the proliferative phase, and finally to highly coiled, secretory glands with increased angiogenesis in the secretory phase. The bottom section displays three diagnostic ultrasound images of the uterus, providing clinical correlation of endometrial thickness: 2 mm (early proliferative), 11 mm (late proliferative), and 14 mm (mid-secretory). Key physiological processes such as post-menstrual repair, cellular proliferation, angiogenesis, and stromal decidualization are annotated to link hormonal signaling with macroscopic and microscopic changes.
amenorrhea causes classification flowchart
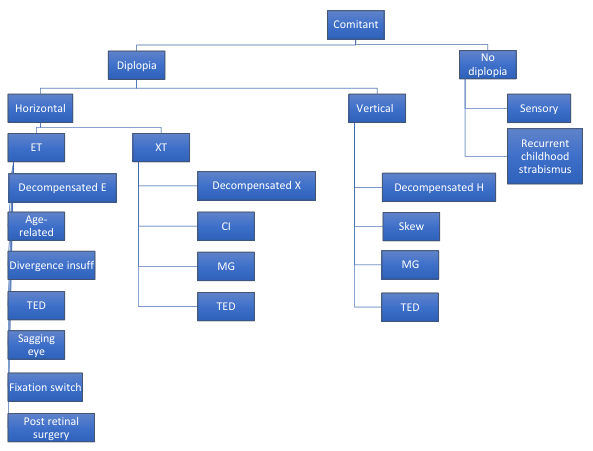
Summary : This flowchart outlines the classification and causes of comitant strabismus, dividing cases based on the presence or absence of diplopia, and further categorizing by horizontal or vertical deviation and specific etiologies. flowchart: # Nodes : • Comitant (root node, rectangle) • Diplopia (rectangle) • Horizontal (rectangle) • ET (rectangle) • Decompensated E (rectangle) • Age-related (rectangle) • Divergence insuff (rectangle) • TED (rectangle) • Sagging eye (rectangle) • Fixation switch (rectangle) • Post retinal surgery (rectangle) • XT (rectangle) • Decompensated X (rectangle) • CI (rectangle) • MG (rectangle) • TED (rectangle) • Vertical (rectangle) • Decompensated H (rectangle) • Skew (rectangle) • MG (rectangle) • TED (rectangle) • No diplopia (rectangle) • Sensory (rectangle) • Recurrent childhood strabismus (rectangle) # Connectors : • Comitant splits into Diplopia and No diplopia. • Diplopia splits into Horizontal and Vertical. • Horizontal splits into ET and XT. • ET leads to Decompensated E, which branches into Age-related, Divergence insuff, TED, Sagging eye, Fixation switch, and Post retinal surgery. • XT leads to Decompensated X, CI, MG, and TED. • Vertical leads to Decompensated H, Skew, MG, and TED. • No diplopia leads to Sensory, which leads to Recurrent childhood strabismus. # Layout : • Hierarchical, top-down tree structure. • Main branches: Diplopia (left, subdivided into Horizontal and Vertical) and No diplopia (right, subdivided into Sensory). # Analysis : • The flowchart systematically categorizes comitant strabismus based on diplopia presence, then by deviation direction (horizontal/vertical), and finally by specific etiologies. • Multiple causes are listed for each subtype, highlighting the complexity and variety of underlying mechanisms. • TED (Thyroid Eye Disease) and MG (Myasthenia Gravis) appear as causes in both horizontal and vertical diplopia, indicating their broad impact. • The "No diplopia" branch is much simpler, focusing on sensory causes and recurrent childhood strabismus.
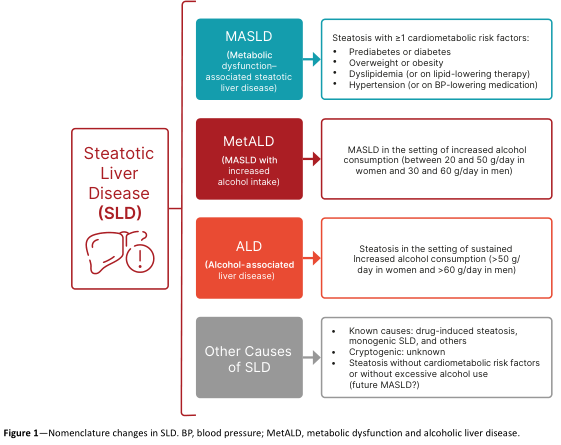
Summary : This flowchart presents the updated nomenclature and classification of Steatotic Liver Disease (SLD), breaking it down into four main categories based on underlying causes and risk factors, including metabolic dysfunction, alcohol intake, and other etiologies. flowchart: # Nodes : • Steatotic Liver Disease (SLD) (main category, leftmost node with icon) • MASLD (Metabolic dysfunction–associated steatotic liver disease) (blue rectangle) – Steatosis with ≥1 cardiometabolic risk factors: • Prediabetes or diabetes • Overweight or obesity • Dyslipidemia (or on lipid-lowering therapy) • Hypertension (or on BP-lowering medication) • MetALD (MASLD with increased alcohol intake) (dark red rectangle) – MASLD in the setting of increased alcohol consumption (between 20 and 50 g/day in women and 30 and 60 g/day in men) • ALD (Alcohol-associated liver disease) (orange rectangle) – Steatosis in the setting of sustained increased alcohol consumption (>50 g/day in women and >60 g/day in men) • Other Causes of SLD (gray rectangle) – Known causes: drug-induced steatosis, monogenic SLD, and others – Cryptogenic: unknown – Steatosis without cardiometabolic risk factors or without excessive alcohol use (future MASLD?) # Connectors : • SLD branches rightward into four categories: MASLD, MetALD, ALD, and Other Causes of SLD. • Each category is connected with a rightward arrow from SLD. • MetALD and ALD are sequentially related by alcohol intake thresholds. # Layout : • Vertical stack of four colored rectangles (MASLD, MetALD, ALD, Other Causes of SLD) to the right of the main SLD node. • Arrows point from the main SLD node to each category. • Explanatory bullet points within each rectangle. # Analysis : • The flowchart clarifies the new classification of SLD, distinguishing between metabolic and alcohol-related causes. • MASLD is defined by the presence of metabolic risk factors, while MetALD and ALD are differentiated by levels of alcohol intake. • "Other Causes" captures less common or unknown etiologies. • The structure emphasizes the importance of both metabolic and alcohol-related factors in the diagnosis and categorization of steatotic liver disease.
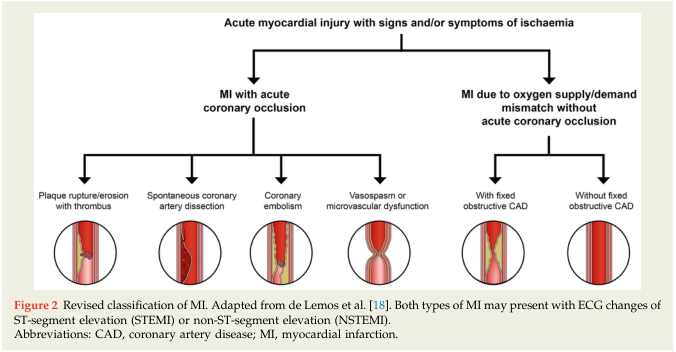
Summary : This flowchart presents a revised classification of myocardial infarction (MI) based on the presence or absence of acute coronary occlusion and the underlying mechanisms, as adapted from de Lemos et al. It visually distinguishes between MI with acute coronary occlusion and MI due to oxygen supply/demand mismatch without acute coronary occlusion, further subdividing each category by specific pathophysiological causes. flowchart: # Main Categories : • Acute myocardial injury with signs and/or symptoms of ischaemia (top-level node). • Two primary branches: – MI with acute coronary occlusion. – MI due to oxygen supply/demand mismatch without acute coronary occlusion. # MI with Acute Coronary Occlusion (Left Branch) : • Plaque rupture/erosion with thrombus (circular illustration showing narrowed artery with thrombus). • Spontaneous coronary artery dissection (circular illustration showing dissection in artery wall). • Coronary embolism (circular illustration showing embolic obstruction). • Vasospasm or microvascular dysfunction (circular illustration showing narrowed vessel due to spasm). # MI Due to Oxygen Supply/Demand Mismatch Without Acute Coronary Occlusion (Right Branch) : • With fixed obstructive CAD (circular illustration showing narrowed artery with stable plaque). • Without fixed obstructive CAD (circular illustration showing normal or non-obstructed artery). # Connectors : • Downward arrows from the top node to the two main branches. • Further downward arrows from each main branch to their respective subcategories. # Layout : • Hierarchical, top-down structure. • Two main branches split horizontally, each with multiple subcategories depicted with icons/illustrations. # Technical Details : • Figure legend notes that both MI types may present with ECG changes of ST-segment elevation (STEMI) or non-ST-segment elevation (NSTEMI). • Abbreviations: CAD = coronary artery disease; MI = myocardial infarction. Analysis : • The flowchart clarifies that MI can result from either acute coronary occlusion (with several distinct mechanisms) or from an imbalance in oxygen supply and demand without acute occlusion, with or without underlying coronary artery disease. • Visual icons help differentiate the pathophysiological processes, emphasizing the heterogeneity of MI causes. • The structure supports clinical differentiation for diagnosis and management.
Menstrual Abnormalities
1. Classification & Terminology
| Term | Definition |
|---|---|
| Amenorrhea | Absence of menstrual periods |
| Oligomenorrhea | Reduced frequency of periods (cycles >38 days) |
| Hypomenorrhea | Scanty flow during regular periods |
| Menorrhagia (HMB) | Abnormally heavy/prolonged flow during regular periods |
| Metrorrhagia | Bleeding from the uterus between periods (intermenstrual) |
| Menometrorrhagia | Heavy, irregular bleeding |
| Dysmenorrhea | Painful menstruation |
| PMS / PMDD | Premenstrual syndrome / premenstrual dysphoric disorder |
Note: Older terms like menorrhagia, metrorrhagia, and "dysfunctional uterine bleeding" have been largely replaced by the PALM-COEIN classification system (FIGO, 2011) for abnormal uterine bleeding (AUB).
2. Abnormal Uterine Bleeding (AUB) - PALM-COEIN
- P - Polyps
- A - Adenomyosis
- L - Leiomyoma (fibroids)
- M - Malignancy and hyperplasia
- C - Coagulopathy
- O - Ovulatory dysfunction
- E - Endometrial causes
- I - Iatrogenic (medications)
- N - Not otherwise classified
AUB causes by age group (Robbins):
- Prepuberty: Precocious puberty (hypothalamic, pituitary, or ovarian origin)
- Adolescence: Anovulatory cycles, coagulation disorders
- Reproductive age: Pregnancy complications, structural lesions (polyps, fibroids), anovulation, coagulopathy
- Perimenopausal: Anovulatory cycles (due to HPO axis fluctuations)
- Postmenopausal: Atrophy (most common), endometrial malignancy
3. Amenorrhea
Primary vs. Secondary
- Primary amenorrhea: Menstrual bleeding has never occurred. May be associated with absent secondary sexual characteristics.
- Secondary amenorrhea: Cessation of previously normal menstrual cycles. The most common cause is pregnancy ("secondary amenorrhea should be considered due to pregnancy until proved otherwise").
Causes of Amenorrhea (Berek & Novak's Gynecology):
- Hypergonadotropic hypogonadism (e.g., Turner syndrome - 45,X)
- Hypogonadotropic hypogonadism
- Kallmann syndrome (GnRH deficiency + anosmia)
- GnRH/FSH/LH receptor defects
- Aromatase deficiency
- Outflow tract / Müllerian anomalies (e.g., imperforate hymen, Mayer-Rokitansky-Küster-Hauser syndrome)
- Androgen insensitivity syndrome
- Ovotesticular disorder of sexual development
- Polycystic Ovarian Syndrome (PCOS) - most common endocrine cause
- Hyperprolactinemia (pituitary adenoma, drug-induced)
- Primary Ovarian Insufficiency (premature ovarian failure)
- Hypothalamic amenorrhea - excess opioid activity slows GnRH pulse frequency; associated with:
- Eating disorders / weight loss
- Excessive exercise
- Stress / emotional stimuli
- Obesity
- Thyroid disorders
- Other hypothalamic/pituitary lesions
Key mechanism in hypothalamic amenorrhea: GnRH pulse frequency is slowed by excess opioid activity in the hypothalamus. Naltrexone (an opioid blocker) has shown encouraging results in restoring GnRH pulse frequency. - Ganong's Review of Medical Physiology
4. Dysfunctional Uterine Bleeding (DUB)
- At menarche (first 1-2 years)
- In the perimenopausal period
- Pituitary tumors secreting prolactin (disrupts GnRH → ↓LH and FSH)
- PCOS or functioning ovarian tumors (e.g., granulosa cell tumors)
- Obesity, malnutrition, or chronic systemic disorders
- Luteal phase defect (insufficient progesterone from corpus luteum)
5. Dysmenorrhea
- Primary dysmenorrhea: No identifiable pathology; due to excess prostaglandins (PGE2) in the uterus causing myometrial contractions and ischemia. Common in young women; often decreases after first pregnancy.
- Secondary dysmenorrhea: Due to an underlying condition (endometriosis, fibroids, adenomyosis, pelvic inflammatory disease).
Treatment of Dysmenorrhea (Harrison's, 22nd Ed.):
- NSAIDs (ibuprofen, naproxen, ketoprofen, mefenamic acid) - most effective (>80% response rate). Best started before onset of menses and continued 2-3 days.
- Combined or progestin-only oral contraceptives (cyclic or continuous)
- Vitamin B1 (100 mg/day), magnesium, omega-3 fatty acids - adjunct evidence
- Heat application, exercise, yoga - modest benefit
- Endometriosis-related: GnRH agonists with add-back therapy, aromatase inhibitors, laparoscopic resection
6. Premenstrual Syndrome (PMS) / PMDD
- Irritability, bloating, edema
- Decreased concentration, depression
- Headache, breast tenderness, constipation
- SSRIs (e.g., fluoxetine) - first-line for PMDD (serotonin mechanism)
- Benzodiazepines (alprazolam) - for anxiety/irritability
- GnRH agonists (in doses that suppress the pituitary-ovarian axis) - effective for severe cases
- Calcium, magnesium supplementation
7. Diagnostic Workup for AUB
- Detailed history + pelvic exam
- Pregnancy test (first step)
- CBC, thyroid function, prolactin level
- Cervical cancer screening (Pap smear)
- STI screening
- Pelvic ultrasound
- Endometrial biopsy - indicated for:
- Age ≥45 with AUB
- <45 with risk factors (obesity, unopposed estrogen, persistent AUB, family history of endometrial cancer)
- Coagulation screening - if heavy bleeding since menarche, family history, medication-related
8. Treatment Summary
| Condition | First-Line Treatment |
|---|---|
| Anovulatory AUB | Hormonal therapy (OCP, progestin, LNG-IUD) |
| Endometrial hyperplasia | Progestins, IUD; surgery if high-grade |
| Fibroids | Medical (NSAIDs, tranexamic acid, GnRH agonists); surgical (myomectomy, UAE, ablation) |
| Primary dysmenorrhea | NSAIDs, COCs |
| Hypothalamic amenorrhea | Address underlying cause; pulsatile GnRH, naltrexone |
| PMS/PMDD | SSRIs (fluoxetine), alprazolam, GnRH agonists |
| PCOS-related | OCP, metformin, lifestyle modification |
- Ganong's Review of Medical Physiology, 26th Ed., Chapter 22 - Menstrual Abnormalities
- Berek & Novak's Gynecology, Chapters 34 & 24 - Amenorrhea; PMS/PMDD
- Harrison's Principles of Internal Medicine, 22nd Ed. - Dysmenorrhea, Endometriosis, Fibroids
- Robbins & Kumar Basic Pathology - Abnormal Uterine Bleeding
- Sabiston Textbook of Surgery - AUB/PALM-COEIN classification
Motor - Vehicle Act in Details
Which country's Motor Vehicle Act would you like details on?
Motor Vehicles Act 1988 India complete details chapters provisions 2019 amendment
Motor Vehicles Amendment Act 2019 India key changes penalties provisions
https://savelifefoundation.org/wp-content/uploads/2019/07/MV…
Motor Vehicles Act, 1988 (India) - Complete Guide
Overview
Structure - 14 Chapters at a Glance
| Chapter | Title | Key Sections |
|---|---|---|
| I | Preliminary (Definitions) | Sec. 2 |
| II | Licensing of Drivers | Sec. 3-26 |
| III | Licensing of Conductors | Sec. 27-38 |
| IV | Registration of Motor Vehicles | Sec. 39-65 |
| V | Control of Transport Vehicles | Sec. 66-96 |
| VI | State Transport Undertakings | Sec. 97-104 |
| VII | Construction, Equipment & Maintenance | Sec. 105-122 |
| VIII | Control of Traffic | Sec. 123-138 |
| IX | Motor Vehicles Visiting India | Sec. 139-140 |
| X | Liability Without Fault | Sec. 140-144 |
| XI | Insurance Against Third Party Risks | Sec. 145-164 |
| XII | Claims Tribunals | Sec. 165-176 |
| XIII | Offences, Penalties & Procedure | Sec. 177-210 |
| XIV | Miscellaneous | Sec. 211-217 |
Chapter I - Preliminary (Definitions)
| Term | Definition |
|---|---|
| Motor Vehicle | Any mechanically propelled vehicle adapted for use on roads, excluding vehicles running on fixed rails |
| Transport Vehicle | A public service vehicle, goods carriage, educational institution bus, or private service vehicle |
| Driving License | Document issued by licensing authority authorizing to drive a motor vehicle |
| Light Motor Vehicle (LMV) | Vehicle with gross vehicle weight not exceeding 7,500 kg |
| Heavy Motor Vehicle (HMV) | Vehicle with gross vehicle weight exceeding 12,000 kg |
| Learner's License | License to drive a motor vehicle as a learner |
| Road | Any public road, bridge, lane, footway, square, court or passage |
Chapter II - Licensing of Drivers (Sections 3-26)
Key Provisions
- No person shall drive a motor vehicle in any public place unless they hold an effective driving license.
- The license must specifically authorize the class of vehicle being driven.
- Minimum age: 18 years for most vehicles
- Minimum age: 20 years for transport vehicles (carrying goods or passengers for hire)
- An applicant must pass a test on traffic signs and driving rules.
- A learner's license is valid for 6 months.
- Must display an "L" plate while driving on a learner's license.
- States name, address, date of birth, photograph, thumbprint, validity period, and vehicle class.
- Under the 2019 Amendment: National Register of Driving Licenses established (Sec. 25A) - a centralized digital database.
- For transport vehicles: valid for 3 years (or until age 50, whichever is earlier)
- For non-transport vehicles: valid for 20 years or until the holder turns 50, whichever is earlier; thereafter renewed every 5 years.
- Courts can disqualify a person from holding a driving license for repeat or serious offences.
- Mandatory testing of HMV drivers for fitness and minimum educational qualifications
- Training institutes for HMV drivers established under Section 12A
- Provision for online issuance and renewal of driving licenses
Chapter III - Licensing of Conductors (Sections 27-38)
- No person may act as a conductor of a stage carriage without a conductor's license.
- Minimum age: 18 years
- Must be medically fit and pass a conduct/knowledge test.
- License valid for 3 years.
Chapter IV - Registration of Motor Vehicles (Sections 39-65)
- Owner must apply to the registering authority (RTO) within 7 days of taking delivery.
- Under 2019 Amendment: Vehicle dealers can now register new motor vehicles (previously prohibited).
- National Register of Motor Vehicles (Sec. 62A) established - centralized digital records.
- A motor vehicle dealer may obtain a temporary registration valid for 1 month.
- Owner must intimate the registering authority within 30 days if moving to another state.
- No person shall alter a vehicle from its original specification without prior approval.
- 2019 Amendment introduces heavy penalties for unauthorized alterations (Sec. 182A).
- Every transport vehicle must carry a valid certificate of fitness.
- Renewed periodically (every 1-2 years for commercial vehicles).
Chapter V - Control of Transport Vehicles (Sections 66-96)
- No owner of a motor vehicle shall use it as a transport vehicle unless a permit has been granted.
| Permit | Description |
|---|---|
| Stage Carriage Permit | Bus operations on specified routes |
| Contract Carriage Permit | Vehicles hired for specific trips (e.g., taxis, autos) |
| Goods Carriage Permit | Carriage of goods for hire or reward |
| National Permit | Allows goods vehicles to operate across states |
| Tourist Permit | For tourist vehicles operating across state borders |
- Section 66A - National Transportation Policy empowers Central Government to formulate a framework for integrated transport planning.
- Section 66B - National Freight Policy for goods vehicles.
Chapter VII - Construction, Equipment & Maintenance (Sections 105-122)
- Sets technical standards for vehicles: brakes, steering, lighting, horns, tyres, speed governors, etc.
- 2019 Amendment - Vehicle Recall (Sections 110A & 110B):
- Central Government empowered to recall vehicles that do not meet safety/emission standards.
- Testing agencies established to issue certificates of approval.
- Penalty for defective vehicles: up to Rs. 1 crore per model defect.
Chapter VIII - Control of Traffic (Sections 123-138)
- Sec. 112 - Speed limits (notified by state governments / Central Government on national highways)
- Sec. 119 - Driving regulations (left-hand traffic, lane discipline, overtaking rules)
- Sec. 129 - Wearing of protective headgear (helmet) - mandatory for two-wheeler riders
- Sec. 134 - Duty of driver in case of accident - must stop, render assistance, report to police
- Sec. 138 - Power to make rules for control of traffic
- A "Good Samaritan" (bystander who assists accident victim in good faith) is protected from civil and criminal liability.
- Cannot be compelled to be a witness.
Chapter X - Liability Without Fault (Sections 140-144)
- Section 140 - Establishes no-fault liability: In case of death or permanent disablement caused by a motor accident, compensation is payable regardless of fault.
- Compensation for death: Rs. 50,000
- Compensation for permanent disablement: Rs. 25,000
- These are minimum statutory amounts; full tort claims are adjudicated by Motor Accident Claims Tribunals (Chapter XII).
Chapter XI - Insurance Against Third Party Risks (Sections 145-164)
- No person shall use a motor vehicle in a public place without a policy of insurance covering third party risks.
- This is mandatory - driving without insurance is a punishable offence.
- Must cover death or bodily injury to any person (including passengers in certain vehicles).
- Must cover damage to third-party property.
- Motor Vehicle Accident Fund established to provide hit-and-run compensation.
- Interim relief to be provided to road accident victims immediately.
- Solatium Fund enhanced for hit-and-run cases.
Chapter XII - Claims Tribunals (Sections 165-176)
- Motor Accident Claims Tribunals (MACTs) are established by State Governments to adjudicate compensation claims.
- Section 166: Applications for compensation must be made within 6 months (extendable for sufficient cause).
- Tribunal applies both fault-based and no-fault liability principles.
- Appeals from MACT go to the High Court.
Chapter XIII - Offences, Penalties & Procedure
Complete Penalty Table (Pre vs. Post 2019 Amendment)
| Section | Offence | Old Fine (₹) | New Fine (₹) |
|---|---|---|---|
| 177 | General traffic violation | 100 / 300 | 500 / 1,500 |
| 177A | Road regulation violation | 100 | 500-1,000 |
| 178 | Travelling without ticket | 200 | 500 |
| 179 | Disobeying orders of authority | 500 | 2,000 |
| 180 | Allowing unauthorized person to drive | 1,000 | 5,000 |
| 181 | Driving without license | 500 | 5,000 |
| 182(1) | Driving despite disqualification | 500 | 10,000 |
| 182B | Oversize vehicles | NIL | 5,000-10,000 |
| 183(1) | Over-speeding (LMV) | 400 | 1,000-2,000 |
| 184 | Dangerous/rash driving | 1,000 | 1,000-5,000 |
| 185 | Drunken driving (1st offence) | 2,000 | 10,000 + 6 months jail |
| 185 | Drunken driving (2nd offence) | 3,000 | 15,000 + 2 years jail |
| 186 | Driving when mentally/physically unfit | 200 | 1,000-2,000 |
| 192 | Using unregistered vehicle | 2,000-5,000 | 2,000-5,000 (+ enhanced) |
| 194 | Overloading | 2,000 + 1,000/extra tonne | 20,000 + 2,000/extra tonne |
| 194A | Carrying excess passengers | NIL | 200 per excess passenger |
| 194B | Not using seat belt | 100 | 1,000 |
| 194C | No helmet (two-wheeler) | NIL | 1,000 + 3 months DL suspension |
| 194D | Not wearing helmet | NIL | 1,000 + 3 months DL suspension |
| 194E | Not giving way to emergency vehicles | NIL | 10,000 + 6 months jail |
| 194F | Using phone in silent zone | NIL | Fine specified |
| 196 | Driving without insurance | 1,000 | 2,000 / 3 months jail |
| 199A | Offence by juvenile (guardian liable) | NIL | 25,000 + 3 years jail + DL cancellation for 12 months; juvenile ineligible for DL till age 25 |
| 199B | Annual revision of fines | NIL | Up to 10% annual increase |
| 201 | Causing obstruction to traffic flow | 50/hour | 500 |
| 210A | State govt. penalty multiplier | NIL | States can multiply fine by 1x to 10x |
| 210B | Penalty for corrupt enforcing officer | NIL | Twice the applicable fine |
Key New Provisions of the 2019 Amendment
1. National Road Safety Board (Sec. 215D)
- First-ever national body for road safety.
- Advises Central and State Governments on all matters relating to road safety and traffic management.
2. Vehicle Recall (Sec. 110A-110B)
- Central Government can order recall of defective vehicles.
- Manufacturers must refund or replace recalled vehicles.
3. Good Samaritan Protection
- Legal protection to bystanders who assist road accident victims.
- Helps overcome bystander apathy that costs lives.
4. National Transportation Policy (Sec. 66A)
- Framework for integrated, multimodal transport planning.
- States consulted before finalization.
5. National Registers
- National Register of Driving Licenses - central digital database for all DLs.
- National Register of Motor Vehicles - central digital database for all vehicle registrations.
6. Online Services
- Driving licenses and vehicle registration now issuable online.
- Faceless services to reduce corruption at RTOs.
7. Accident Compensation Fund
- Motor Vehicle Accident Fund to provide immediate interim relief to accident victims.
- Covers hit-and-run victims who previously received minimal compensation.
8. Juvenile Offences (Sec. 199A)
- When a minor drives and causes an offence, the guardian/owner is deemed guilty.
- Fine: ₹25,000 + imprisonment up to 3 years.
- Vehicle registration cancelled for 12 months.
- Juvenile made ineligible to obtain driving license until age 25.
9. Contractor Accountability (Sec. 198A)
- Road contractors, consultants, and concessionaires are now penalized (up to ₹1,00,000) for faulty road design, engineering, or maintenance that causes accidents.
Important Legal Principles
| Principle | Provision |
|---|---|
| Compulsory Insurance | No vehicle can ply on public roads without third party insurance (Sec. 146) |
| No-Fault Liability | Compensation payable for death/disability regardless of who was at fault (Sec. 140) |
| Hit-and-Run Compensation | Central government fund provides compensation even when the offending vehicle is untraceable |
| Solatium Fund | Fixed compensation for hit-and-run: ₹2 lakh for death, ₹50,000 for grievous injury (enhanced post-2019) |
| Duty to Assist | Drivers involved in accidents must stop, render aid, and report to police (Sec. 134) |
Administration & Enforcement
| Authority | Role |
|---|---|
| Central Government (MoRTH) | Policy, national highways, national permits, standards |
| State Transport Authority (STA) | State-level permits, licensing policy |
| Regional Transport Office (RTO) | Licensing, registration, fitness certificates |
| Traffic Police | Enforcement of traffic rules on roads |
| Motor Accident Claims Tribunal (MACT) | Adjudication of accident compensation claims |
| National Road Safety Board | Advisory body on road safety (new, 2019) |
Key Cases & Judicial Interpretations
- Shyam Narayan Chouksey v. Union of India (2018): Supreme Court mandated playing of national anthem in cinemas - upheld dignity norms extending to public behaviour.
- Mukund Dewangan v. Oriental Insurance Co. (2017): SC clarified that a LMV license also covers transport vehicles of similar class.
- Rajesh & Others v. Rajbir Singh (2013): SC held that income of non-earning housewives must be considered for compensation under MV Act.
Quick Reference - Common Violations
Most important rules for everyday compliance:
- Always carry: Driving License, RC Book, Insurance Certificate, PUC Certificate
- Wear helmet (two-wheelers) and seat belt (four-wheelers) - mandatory
- Do not use mobile phone while driving
- Do not drink and drive (Zero tolerance: BAC limit = 30 mg per 100 ml blood)
- Follow speed limits (residential: 30 km/h; city: 50 km/h; highways: 100-120 km/h)
- Give way to emergency vehicles (ambulance, fire brigade) - failure attracts ₹10,000 fine