
How how does salts concentration and electrolytes affect oxygenation
how salt concentration and electrolytes affect oxygen transport hemoglobin oxygenation physiology
oxygen hemoglobin dissociation curve Bohr effect pH electrolytes
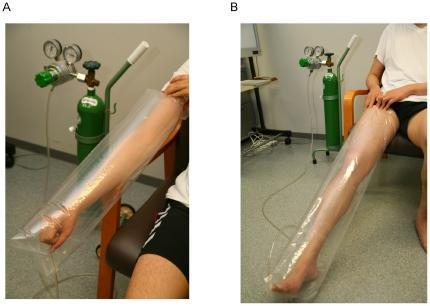
Clinical procedural photograph demonstrating a novel system for the transcutaneous delivery of carbon dioxide (CO2) gas. Figure A shows the application to a human upper limb, where the arm is enclosed within a transparent, airtight plastic adaptor. Figure B illustrates the application to a lower limb, with the leg from mid-thigh to foot similarly sealed. In both setups, a green compressed gas cylinder containing pure CO2 is connected to the adaptor via flexible tubing. The system utilizes pressure regulators and gauges to control gas flow into the enclosed space. The clinical objective shown is to facilitate CO2 absorption through the skin, typically used in research studying microcirculation, tissue oxygenation, and Bohr effect-mediated oxygen dissociation from hemoglobin. The setup demonstrates a non-invasive method for local gas therapy in human subjects.
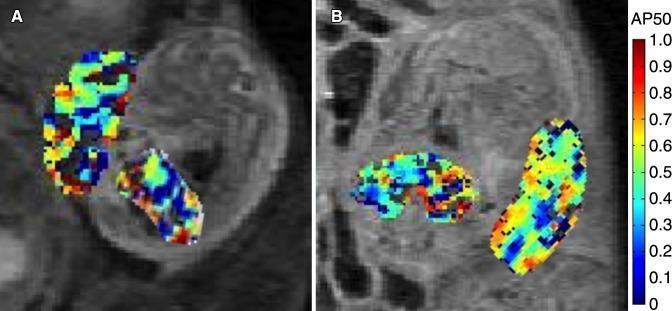
This diagnostic image set displays two functional MR images (A and B) showing maternal-fetal units in a mouse model at embryonic days 14.5 and 17.5. The images feature overlaid color-coded AP50 maps, which represent fetal and placental oxygen-hemoglobin dissociation parameters. In both panels, the placenta and fetal liver are isolated as regions of interest. A vertical color bar on the right side indicates AP50 values scaled from 0 to 1.0, with cool colors (dark blue) representing lower values and warm colors (red/orange) representing higher values. Panel A (day 14.5) demonstrates a heterogeneous distribution of oxygenation parameters within the tissues, showing a mix of green, yellow, and blue pixels. Panel B (day 17.5) illustrates the progression of these physiological markers over time, with the placental AP50 values showing a significant spatial shift toward warmer colors, reflecting changes in oxygen transfer efficiency. These maps provide a non-invasive visual method for studying fetal oxygenation and placental function during gestation.
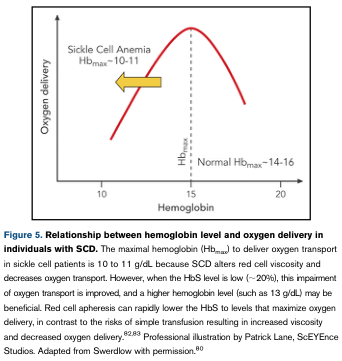
Summary : This figure illustrates the relationship between hemoglobin (Hb) level and oxygen delivery in individuals with sickle cell disease (SCD), highlighting the optimal Hb range for oxygen transport in SCD compared to normal individuals. line plot: # Title & Axes : • No explicit title on the plot, but the context is "Relationship between hemoglobin level and oxygen delivery in individuals with SCD." • X-axis: "Hemoglobin" (units not specified, but contextually g/dL). • Y-axis: "Oxygen delivery" (units not specified). • X-axis tick labels: 10, 15, 20. • Y-axis: No tick labels, only qualitative trend. # Data Points & Series : • Single red curve showing oxygen delivery as a function of hemoglobin level. • The curve rises from Hb = 10, peaks near Hb = 14–16, then declines toward Hb = 20. • Arrow and annotation for "Sickle Cell Anemia Hb_max ~10–11" indicating the optimal Hb range for SCD. • Dashed vertical line at "Normal Hb_max ~14–16" indicating the optimal Hb range for normal individuals. # Design Encodings : • Red solid line for the main curve. • Yellow arrow highlighting the SCD optimal Hb range. • Dashed vertical line for normal Hb_max. • Text annotations for "Sickle Cell Anemia Hb_max ~10–11" and "Normal Hb_max ~14–16". # Distribution & Trends : • The curve is unimodal, peaking at intermediate Hb levels. • Oxygen delivery increases with Hb up to a point, then decreases at higher Hb levels. • The optimal Hb for SCD is lower (~10–11 g/dL) than for normal individuals (~14–16 g/dL). # Analysis : • The figure visually demonstrates that the maximal oxygen delivery in SCD occurs at a lower hemoglobin level than in normal individuals, due to altered red cell viscosity and oxygen transport in SCD. • Increasing Hb above the SCD optimal range may decrease oxygen delivery, while lowering Hb to the optimal range can improve oxygen transport. • The curve supports clinical recommendations for transfusion targets in SCD patients to avoid excessive Hb levels that could impair oxygen delivery.
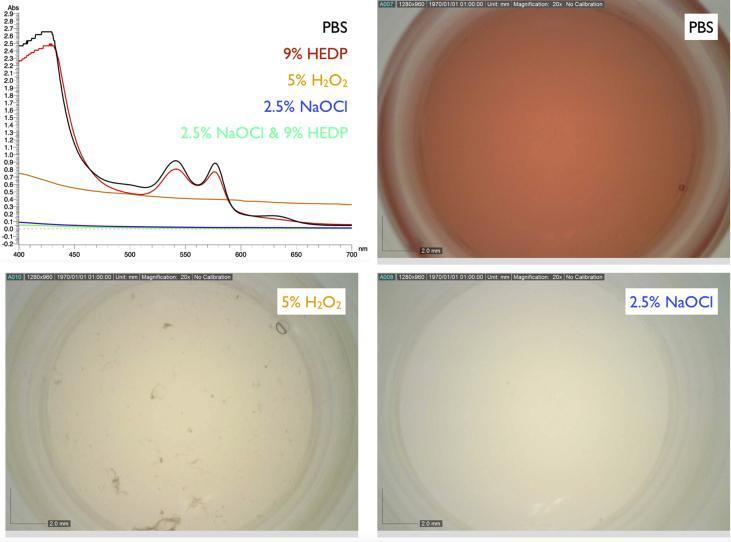
This composite educational graphic illustrates the interaction between human whole blood and various endodontic irrigants through spectrophotometry and microscopy. The top-left panel displays an absorption spectrum (400–700 nm). Mixtures of blood with PBS and 9% HEDP show characteristic double peaks for oxygenated hemoglobin at approximately 542 nm and 578 nm, indicating the preservation of the heme iron's oxygen-binding state. In contrast, these peaks are absent in the 5% H2O2 mixture, and the 2.5% NaOCl (with or without HEDP) curves are flat, indicating total clearing of blood constituents. The remaining panels show microscopy images of the mixtures: the PBS control (top right) retains a deep red color; the 5% H2O2 mixture (bottom left) exhibits a bleaching effect but contains visible denatured protein agglomerates; and the 2.5% NaOCl mixture (bottom right) shows complete dissolution of all blood components. This comparison demonstrates the potent tissue-dissolving and deproteinizing capacity of sodium hypochlorite compared to hydrogen peroxide and HEDP in a dental clinical context.
How Salt Concentration and Electrolytes Affect Oxygenation
1. The Oxygen-Hemoglobin Dissociation Curve - The Foundation
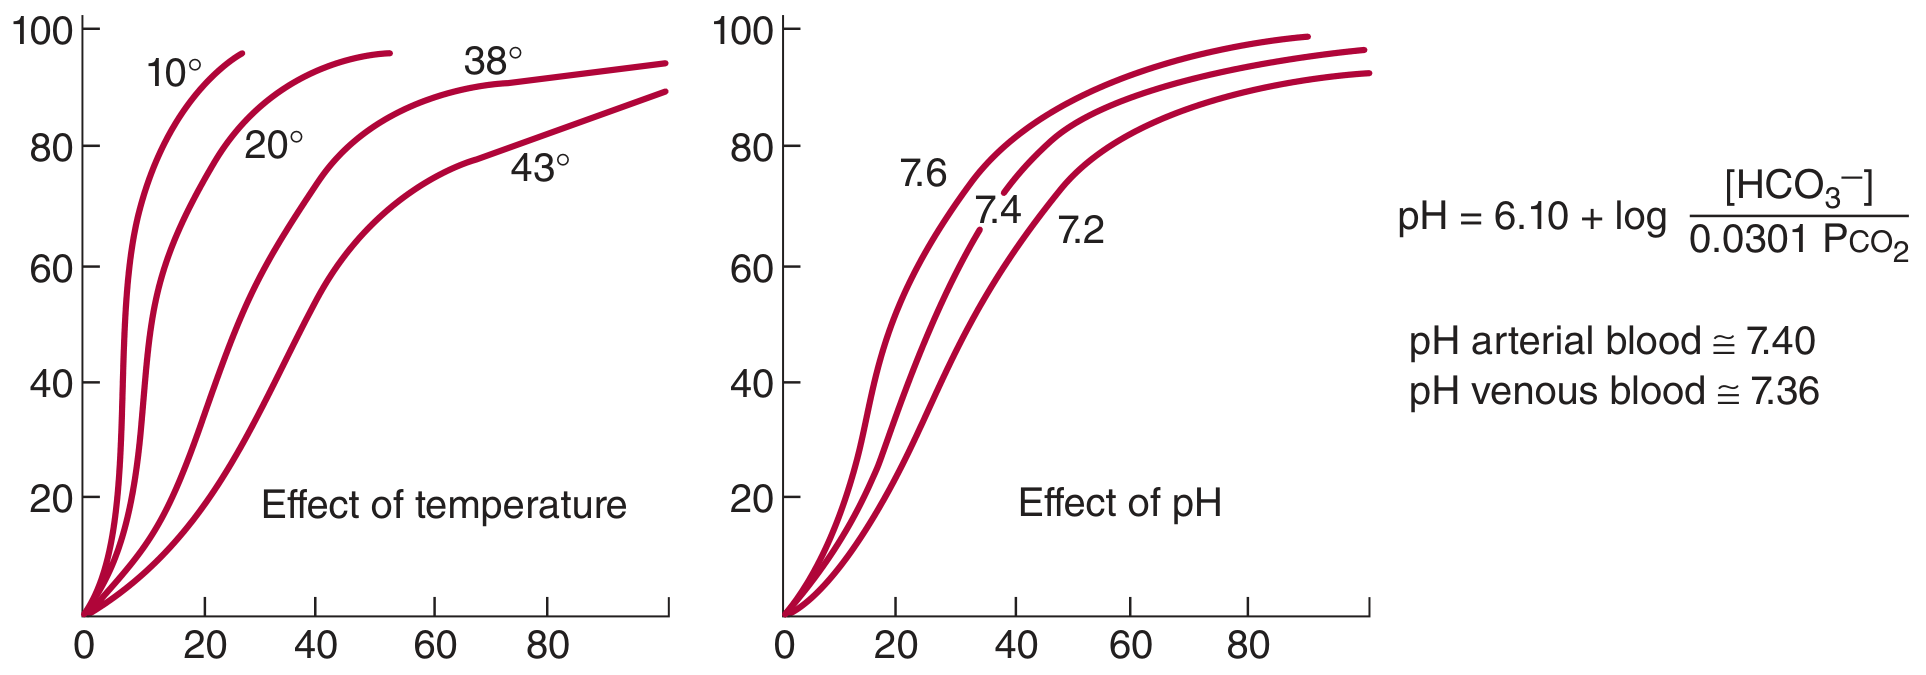
2. Hydrogen Ions (H+) - The Most Direct Electrolyte Effect
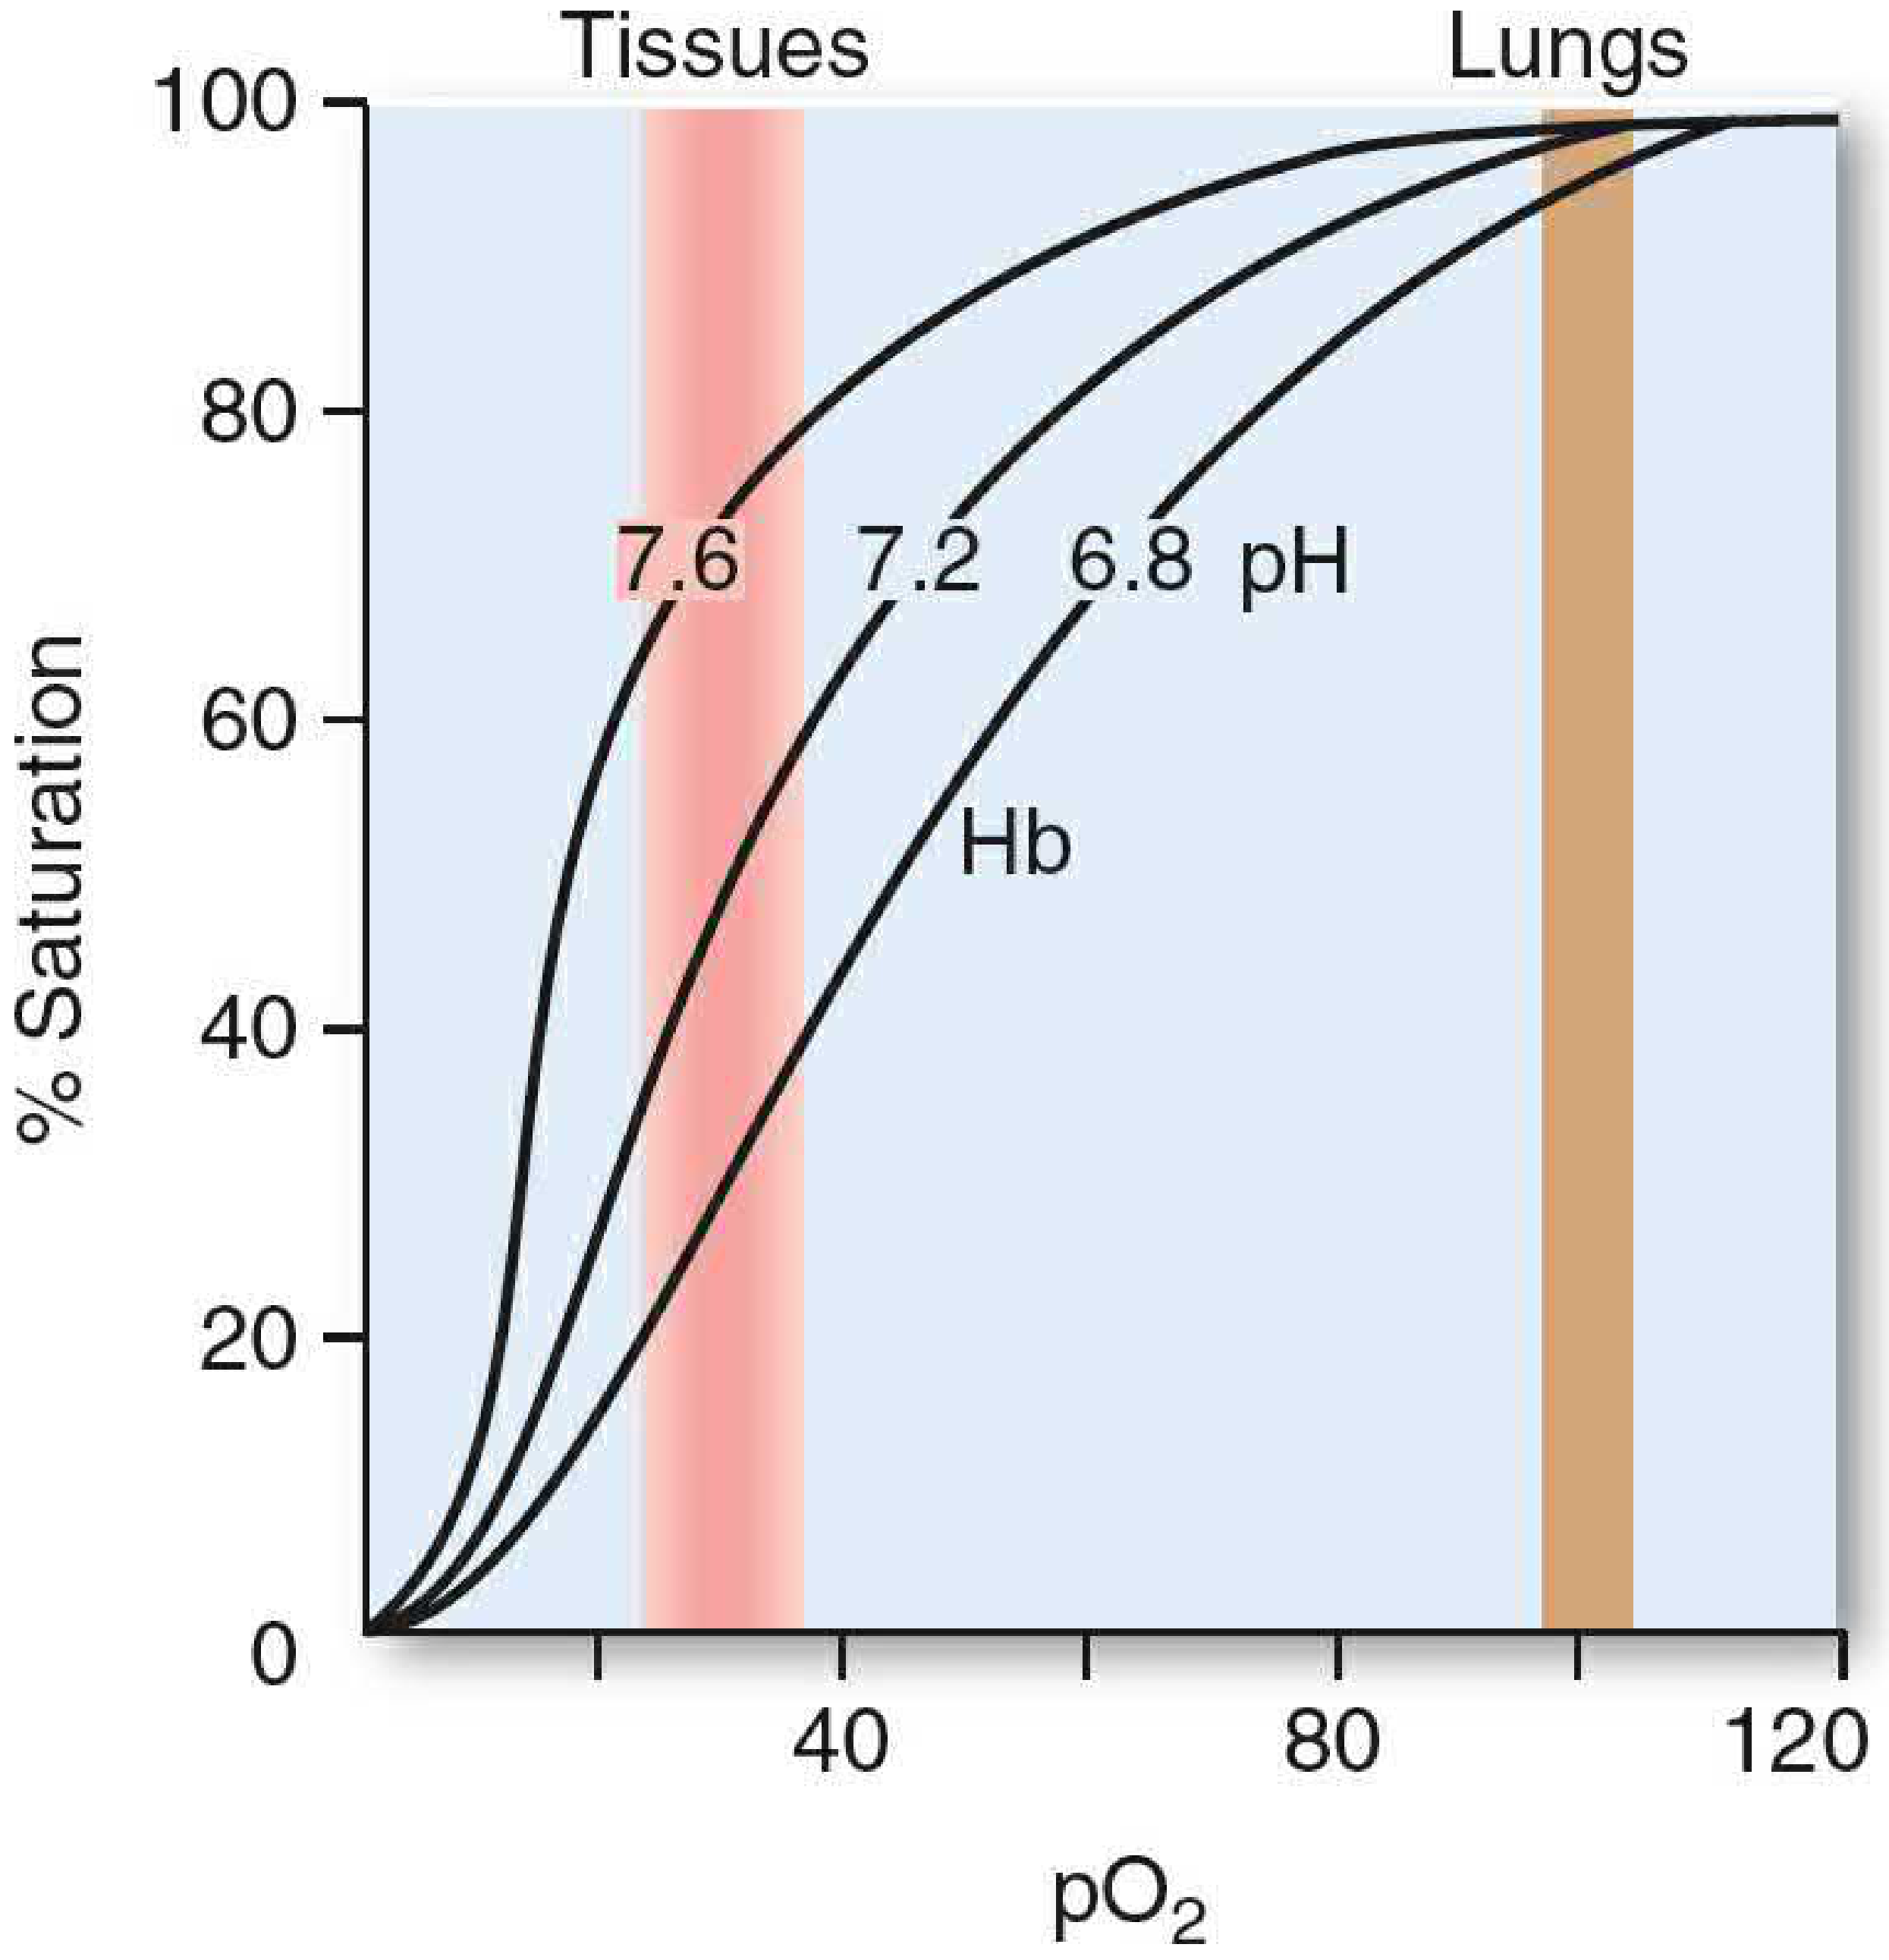
- Rising H+ (falling pH) → shifts ODC to the right → Hb releases more O2 to tissues
- Falling H+ (rising pH) → shifts ODC to the left → Hb holds onto O2
HbO2 + H+ ⇌ HbH + O2
3. Bicarbonate (HCO3-) and CO2 - The Indirect Electrolyte Pathway
CO2 + H2O → H2CO3 → H+ + HCO3-
- The H+ produced drives the Bohr effect (see above), releasing O2 in the tissues
- The HCO3- exits the RBC in exchange for Cl- - this is the chloride shift (Hamburger shift), which maintains electrical neutrality across the RBC membrane
4. Chloride (Cl-) - Direct Allosteric Modulator
"The transition between the two structures [T and R state] is influenced by protons, carbon dioxide, chloride, and 2,3-bisphosphoglycerate (BPG); the higher their concentration, the more oxygen must be bound to trigger the transition." - Harper's Illustrated Biochemistry, 32e
5. 2,3-Bisphosphoglycerate (2,3-BPG) - The Major Organic Phosphate Electrolyte
- 2,3-BPG binds exclusively to deoxyhemoglobin (T state), inserting into the central cavity between the β chains
- This stabilizes the deoxy form and shifts the ODC significantly to the right
- The equilibrium: HbO2 + 2,3-BPG ⇌ Hb-2,3-BPG + O2
- The ODC shifts right
- O2 is released to tissues at a higher tissue pO2 (~10 mmHg higher)
- This is a key adaptive mechanism in conditions of prolonged O2 deprivation
- The ODC shifts left
- Hb binds O2 tightly and cannot easily release it to tissues
- This is a clinical concern with massive transfusion of old stored blood
6. Calcium (Ca2+), Potassium (K+), and Sodium (Na+)
| Electrolyte | How it affects oxygenation |
|---|---|
| K+ | Hypokalemia causes alkalosis (H+ moves into cells to compensate for K+ loss) → ODC shifts left → reduced tissue O2 delivery. Hyperkalemia causes acidosis → ODC shifts right |
| Ca2+ | Hypocalcemia can cause respiratory muscle weakness and impair ventilation (reduced O2 intake). Hypercalcemia can depress respiratory drive |
| Na+ | Primarily affects osmolality and fluid distribution; hyponatremia-induced cerebral edema can impair respiratory center function; does not directly modify Hb-O2 binding |
| Phosphate (PO43-) | Low phosphate (hypophosphatemia) impairs glycolysis in RBCs → reduces 2,3-BPG synthesis → ODC shifts left → impaired O2 delivery to tissues (a recognized complication of refeeding syndrome and diabetic ketoacidosis treatment) |
7. Salt (Ionic Strength) and Osmolality Effects
- Very high salt concentrations (hypernatremia, hyperchloremia) raise osmolality, causing RBC shrinkage (crenation), which can concentrate intracellular 2,3-BPG and slightly affect O2 affinity
- Severe hypertonicity impairs RBC deformability, reducing capillary transit and tissue O2 delivery even if Hb saturation is maintained
- In isolated hemoglobin solutions (relevant to blood substitutes and lab physiology), increasing ionic strength (NaCl concentration) can modify cooperativity and O2 affinity by altering the electrostatic environment of the α-β subunit interfaces
8. Clinical Correlations
| Clinical scenario | Electrolyte/acid-base change | Effect on oxygenation |
|---|---|---|
| Metabolic acidosis (DKA, lactic acidosis) | ↑ H+ | ODC right shift → more O2 to tissues (compensatory) |
| Metabolic alkalosis (vomiting, diuretics) | ↓ H+, ↓ K+ | ODC left shift → impaired O2 delivery to tissues |
| Chronic anemia / high altitude | ↑ 2,3-BPG | ODC right shift → improved tissue O2 unloading |
| Massive blood transfusion (old stored blood) | ↓ 2,3-BPG, ↓ Ca2+ | ODC left shift + hypocalcemia from citrate chelation |
| Hypophosphatemia (refeeding syndrome) | ↓ 2,3-BPG | ODC left shift → tissue hypoxia despite normal SpO2 |
| Respiratory alkalosis (hyperventilation) | ↑ pH | ODC left shift; reduces O2 delivery despite good saturation |
Summary of Curve-Shifting Factors
| Shifts RIGHT (↑ P50, ↓ O2 affinity, more O2 to tissues) | Shifts LEFT (↓ P50, ↑ O2 affinity, less O2 to tissues) |
|---|---|
| ↑ H+ (acidosis) | ↓ H+ (alkalosis) |
| ↑ CO2 | ↓ CO2 |
| ↑ Temperature | ↓ Temperature |
| ↑ 2,3-BPG | ↓ 2,3-BPG (stored blood, hypophosphatemia) |
| ↑ Cl- (minor) | ↓ Cl- (minor) |
Bohrs effect
Bohr effect oxygen hemoglobin dissociation curve pH CO2 shift right
Clinical procedural photograph demonstrating a novel system for the transcutaneous delivery of carbon dioxide (CO2) gas. Figure A shows the application to a human upper limb, where the arm is enclosed within a transparent, airtight plastic adaptor. Figure B illustrates the application to a lower limb, with the leg from mid-thigh to foot similarly sealed. In both setups, a green compressed gas cylinder containing pure CO2 is connected to the adaptor via flexible tubing. The system utilizes pressure regulators and gauges to control gas flow into the enclosed space. The clinical objective shown is to facilitate CO2 absorption through the skin, typically used in research studying microcirculation, tissue oxygenation, and Bohr effect-mediated oxygen dissociation from hemoglobin. The setup demonstrates a non-invasive method for local gas therapy in human subjects.
This diagnostic image set displays two functional MR images (A and B) showing maternal-fetal units in a mouse model at embryonic days 14.5 and 17.5. The images feature overlaid color-coded AP50 maps, which represent fetal and placental oxygen-hemoglobin dissociation parameters. In both panels, the placenta and fetal liver are isolated as regions of interest. A vertical color bar on the right side indicates AP50 values scaled from 0 to 1.0, with cool colors (dark blue) representing lower values and warm colors (red/orange) representing higher values. Panel A (day 14.5) demonstrates a heterogeneous distribution of oxygenation parameters within the tissues, showing a mix of green, yellow, and blue pixels. Panel B (day 17.5) illustrates the progression of these physiological markers over time, with the placental AP50 values showing a significant spatial shift toward warmer colors, reflecting changes in oxygen transfer efficiency. These maps provide a non-invasive visual method for studying fetal oxygenation and placental function during gestation.
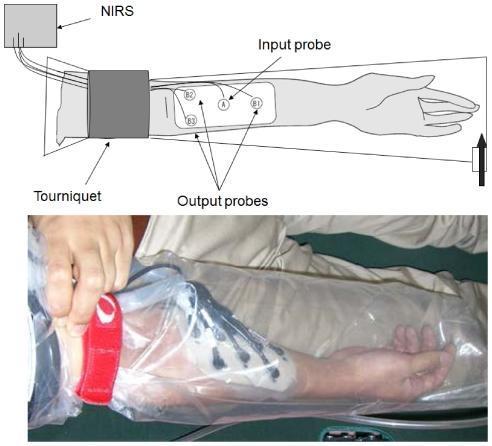
This composite educational resource consists of a labeled anatomical diagram (top) and a corresponding clinical photograph (bottom) illustrating a novel transcutaneous carbon dioxide (CO2) application system for physiological research. The system is applied to the human forearm to study O2 dissociation from hemoglobin using Near-Infrared Spectroscopy (NIRS). Key components include a proximal tourniquet for inducing local ischemia, a NIRS probe assembly with one central input probe (labeled A) and three surrounding output probes (B1, B2, B3) placed over a hydrogel patch on the dorsal forearm, and a transparent, airtight CO2 adaptor encasing the entire limb from distal arm to hand. The clinical photograph demonstrates the real-world application of these components, showing the hydrogel interface on the skin and the sealed plastic chamber used to maintain high CO2 concentrations. This setup is designed to evaluate how transcutaneous CO2 absorption affects local tissue oxygenation and hemodynamics, relevant for research in sports medicine, rehabilitation, and vascular physiology.
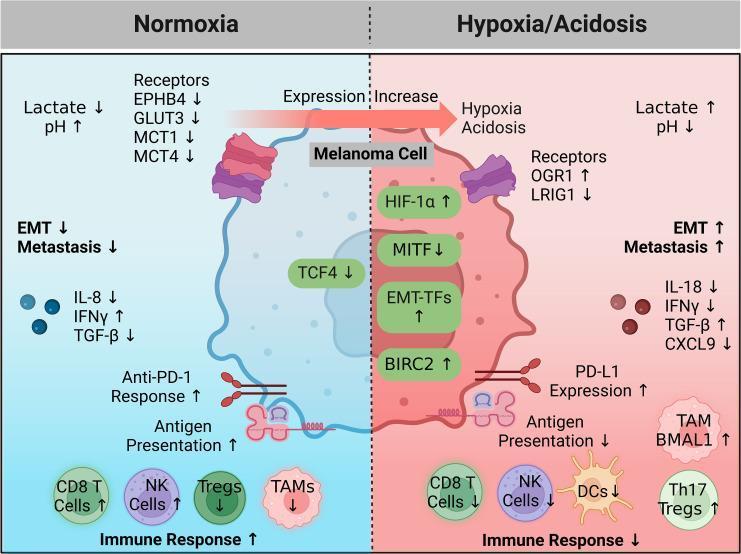
A pathophysiology diagram illustrating the impact of oxygen and pH levels on melanoma cell behavior and the tumor microenvironment. The visual is divided into two comparative states: Normoxia (left, blue) and Hypoxia/Acidosis (right, red). In the normoxic state, there is decreased lactate, increased pH, and high antigen presentation, correlating with increased CD8+ T and NK cell activity and a robust anti-PD-1 response. Conversely, the hypoxic/acidotic state shows increased HIF-1̑, EMT transcription factors (EMT-TFs), and BIRC2, while MITF and TCF4 are downregulated. This metabolic shift is characterized by increased lactate, decreased pH, and upregulation of OGR1 and PD-L1, leading to immune escape. The immune microenvironment in hypoxia displays decreased CD8+ T cells, NK cells, and dendritic cells, with a concomitant increase in immunosuppressive elements like Th17 Tregs and Tumor-Associated Macrophages (TAMs). This diagram summarizes how hypoxia-driven metabolic and genetic reprogramming promotes epithelial-to-mesenchymal transition (EMT), metastasis, and immune resistance in melanoma.
The Bohr Effect
The Core Concept
HbO2 + H+ ⇌ HbH+ + O2
Mechanism at the Molecular Level
- T state (tense/deoxy) - low O2 affinity, stabilized by salt bridges between subunits
- R state (relaxed/oxy) - high O2 affinity, salt bridges broken
- When H+ rises in tissues → these groups become protonated (charged) → they form ionic salt bridges
- Salt bridges stabilize the T (deoxy) conformation → O2 affinity drops → O2 is released
How CO2 Drives the Bohr Effect in Tissues
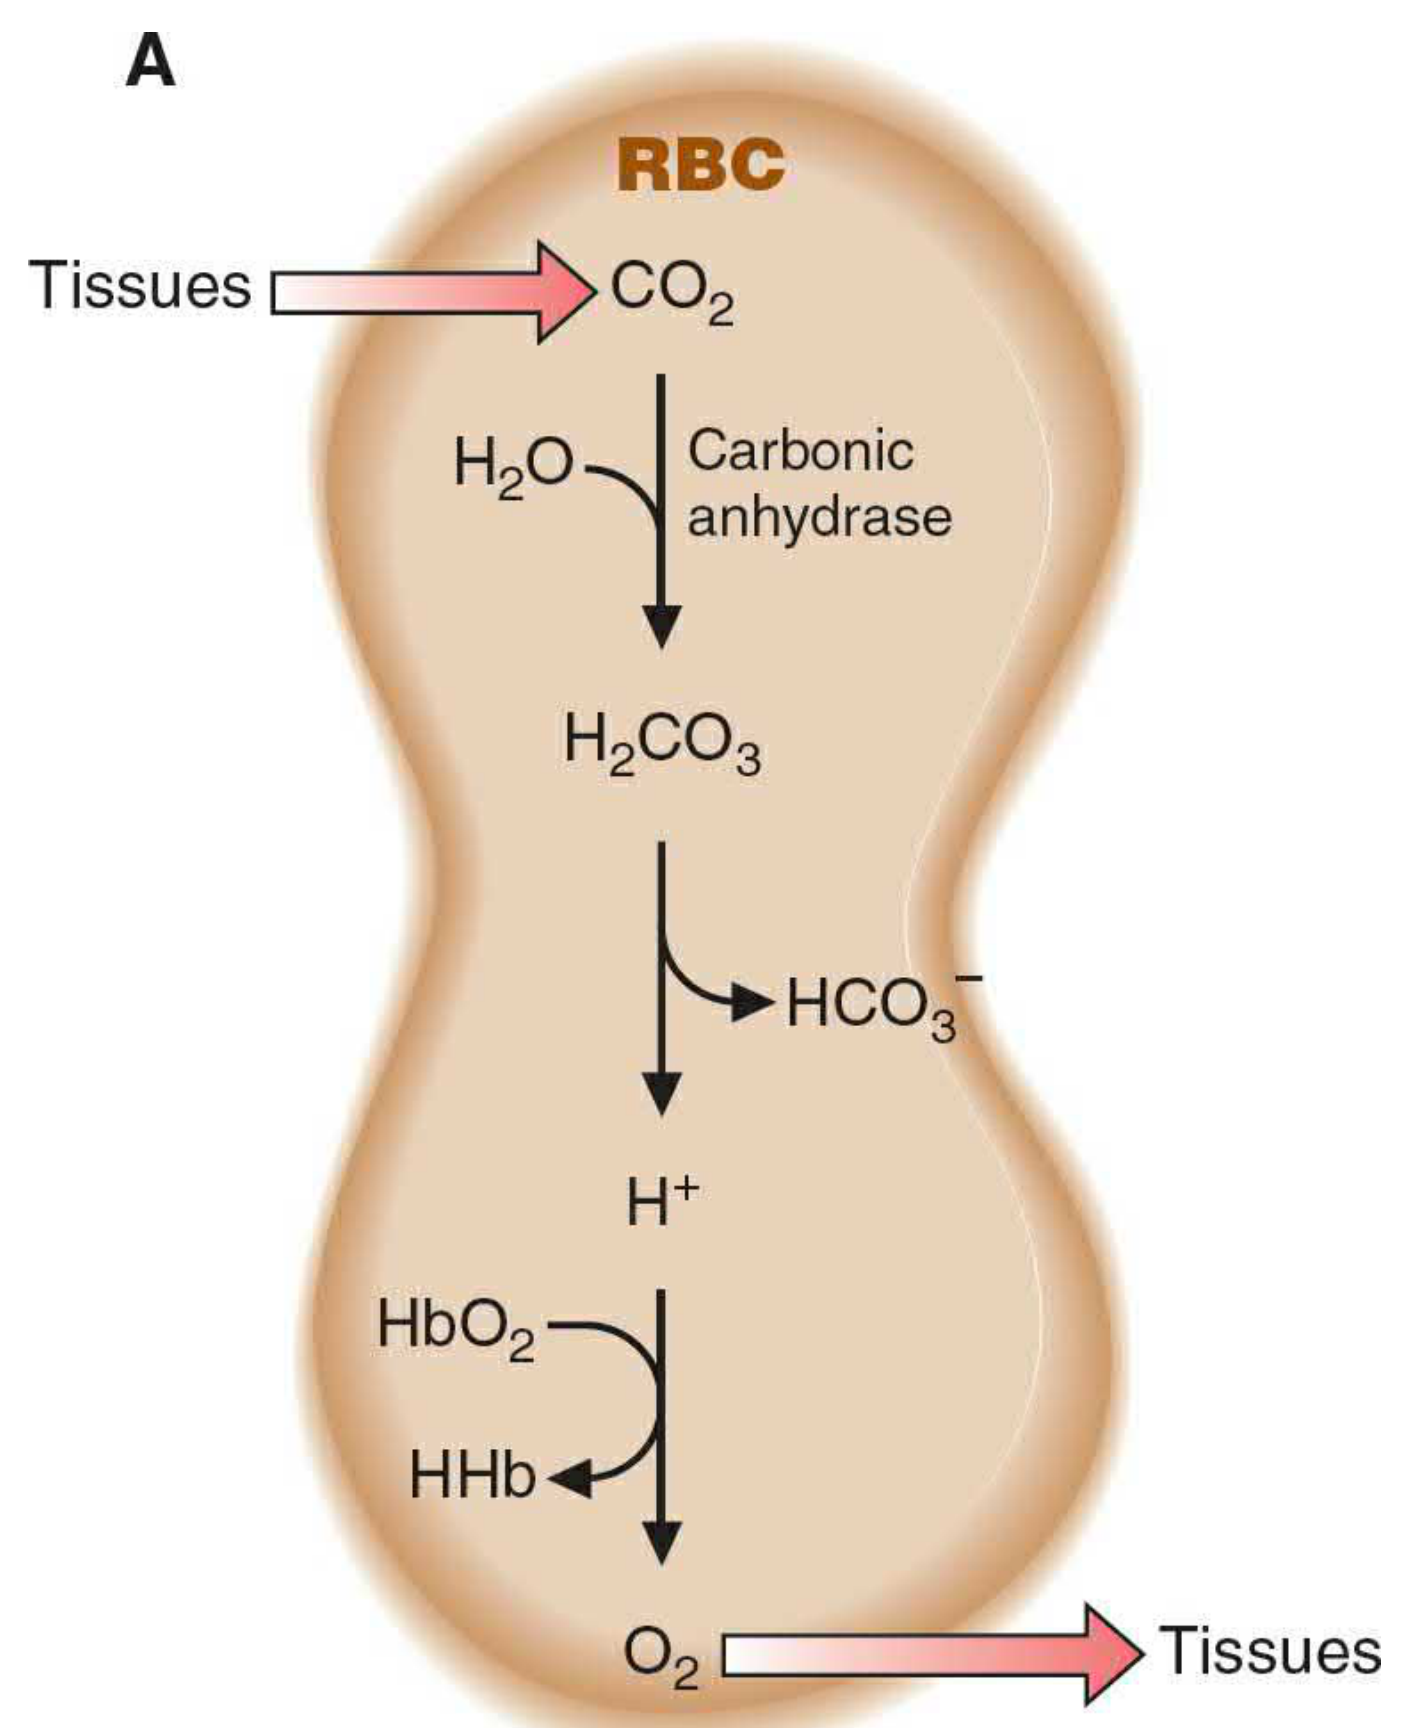
- Metabolically active cells produce CO2
- CO2 diffuses into the RBC
- Carbonic anhydrase catalyzes: CO2 + H2O → H2CO3 → H+ + HCO3-
- The H+ produced binds to histidine residues on Hb → T state stabilized
- O2 is released and diffuses into tissues
- HCO3- exits the RBC in exchange for Cl- (the chloride shift) - maintaining electrical neutrality
- High pO2 → O2 loads onto Hb → conformational change to R state → H+ affinity drops
- H+ released → combines with HCO3- → forms H2CO3 → dissociates to CO2 + H2O
- CO2 is exhaled
Two Components of the Bohr Effect
| Component | Mechanism | Contribution |
|---|---|---|
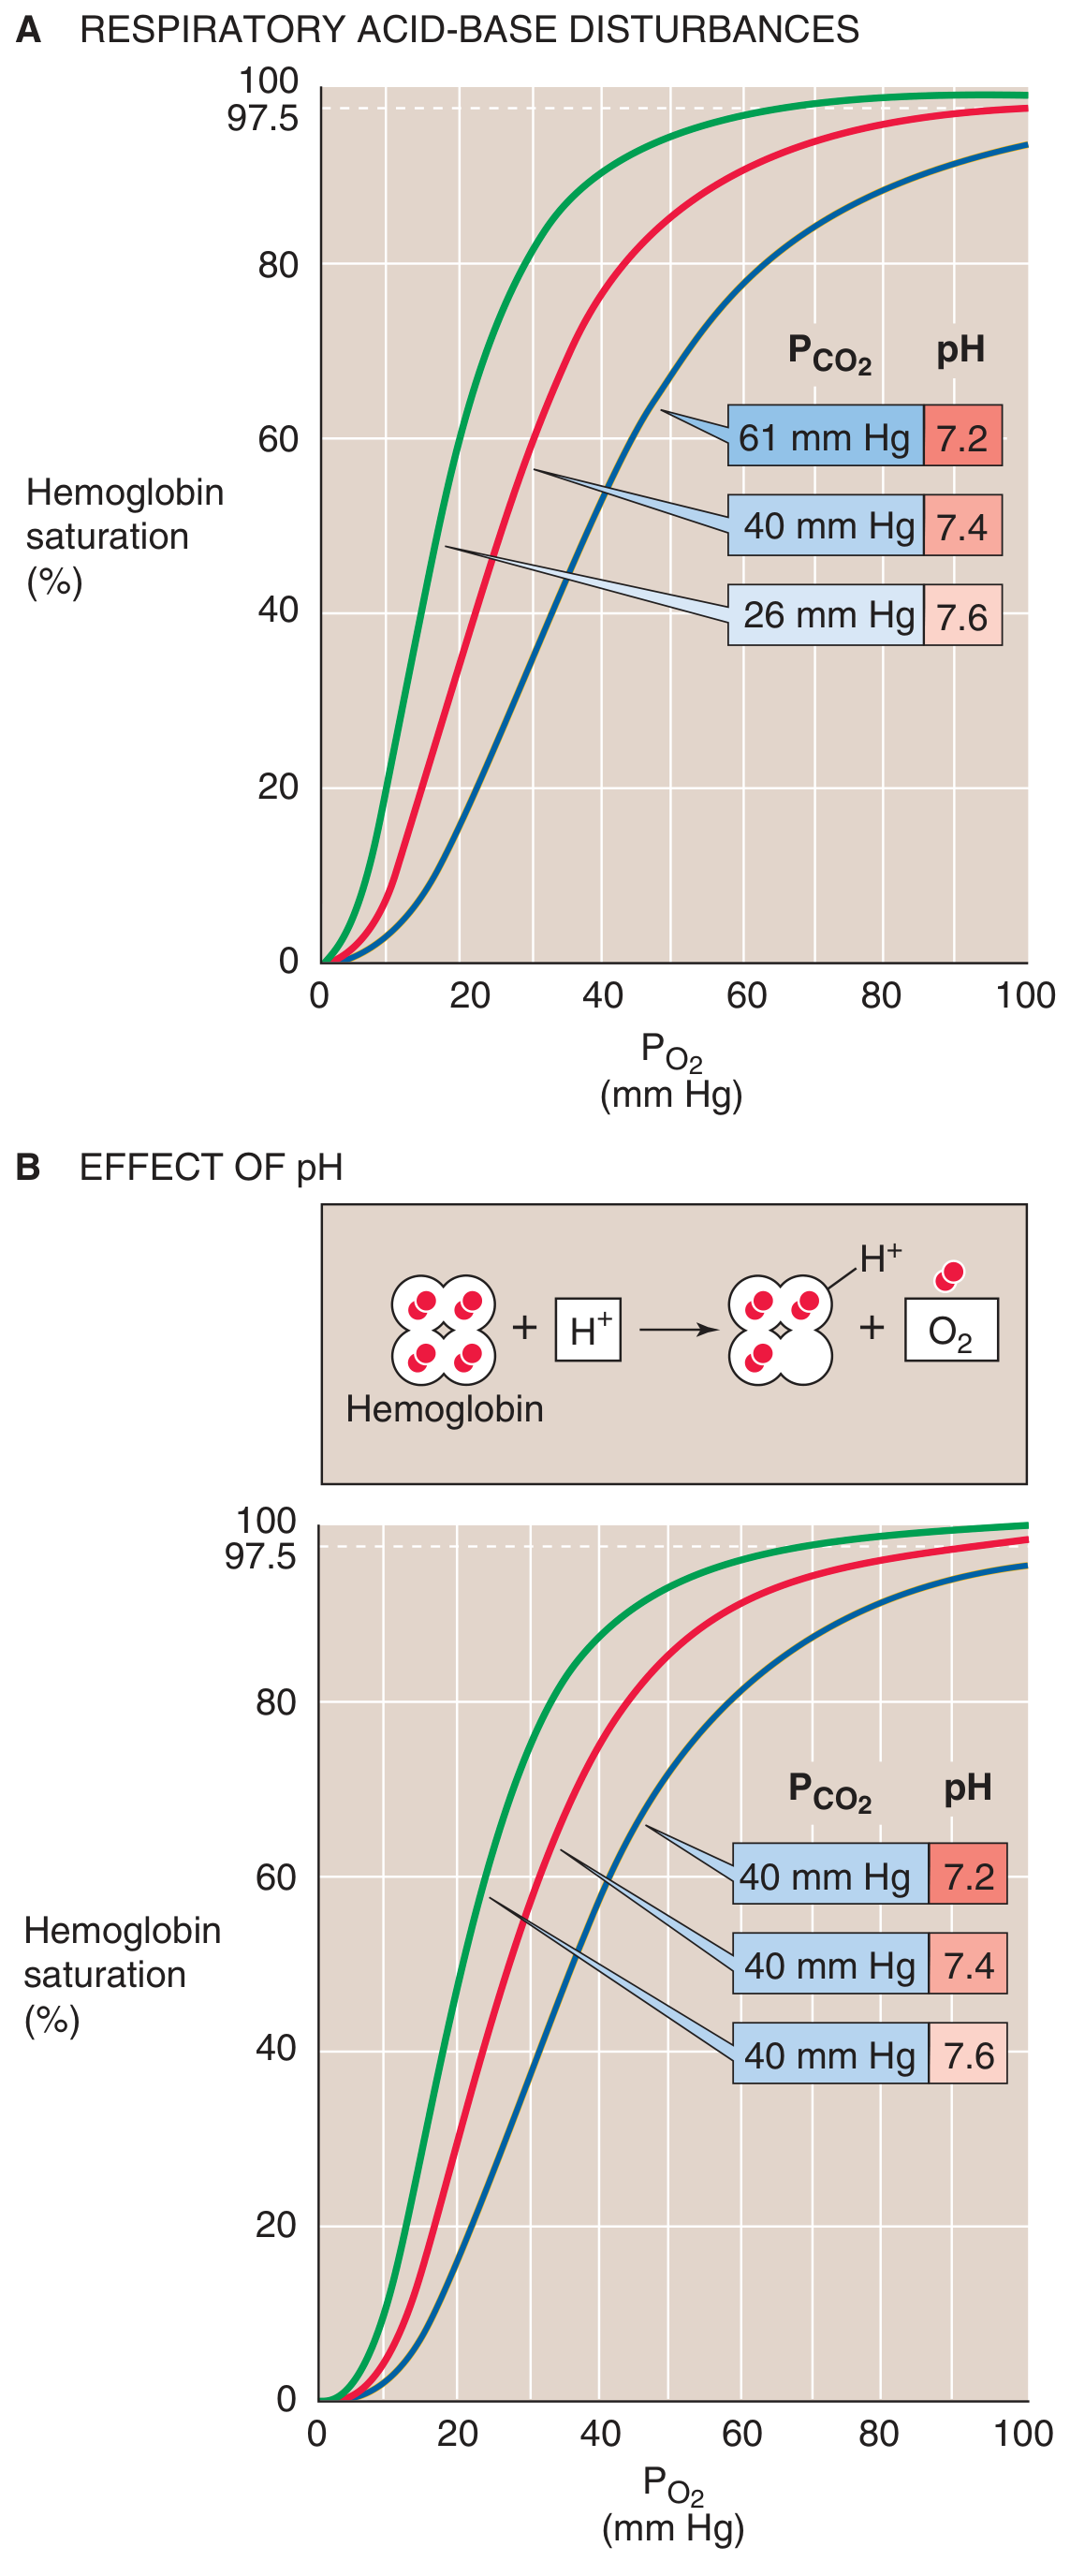
| pH-Bohr effect | H+ binds to histidine/amino groups on Hb, stabilizes T state | Majority (~80-90%) of the total Bohr effect |
| CO2-Bohr effect | CO2 directly binds unprotonated amino groups (-NH2) on Hb to form carbamino compounds (Hb-NHCOO-), independently reducing O2 affinity | Minor component (~10-20%) |
Magnitude of the Effect
- pH change from 7.4 → 7.2 shifts the ODC ~15% to the right (P50 rises from ~27 to ~31+ mmHg)
- At rest, the arterial-venous pH difference is only 0.03-0.05 units, so the Bohr effect contributes only an extra 2-3% unsaturation on top of the normal pO2-driven unloading
- During strenuous exercise with lactic acid production, pH drops further, and the Bohr effect becomes significantly more important for delivering O2 to working muscle
- The primary physiological benefit at rest is not increased O2 delivery per se, but rather the increased buffering capacity of deoxyhemoglobin for H+, which minimizes the fall in blood pH during CO2 metabolism - Fishman's Pulmonary Diseases
The Reciprocal Relationship: Bohr Effect and H+ Buffering
"The Bohr effect states that increased H+ causes a right shift of the O2-hemoglobin dissociation curve, causing hemoglobin to unload O2 more readily in the tissues; thus the H+ generated from tissue CO2 causes hemoglobin to release O2. In turn, deoxygenation of hemoglobin makes it a more effective buffer for H+." - Costanzo Physiology, 7e
Clinical Relevance
| Condition | Effect on Bohr Effect / O2 Delivery |
|---|---|
| Metabolic acidosis (DKA, lactic acidosis) | Bohr effect exaggerated → more O2 released to tissues (initially compensatory) |
| Metabolic alkalosis (vomiting, diuretics) | Bohr effect reversed → Hb holds O2 tighter → impaired tissue O2 delivery |
| Respiratory alkalosis (hyperventilation) | ↓ CO2 + ↑ pH → ODC shifts left → cerebral vasoconstriction + reduced tissue O2 release → symptoms of dizziness, tetany |
| Carbon monoxide poisoning | CO locks Hb in R state (high affinity), AND shifts remaining ODC left (CO-Bohr) → double impairment; hyperventilation with CO2/O2 mix is therapeutic precisely because CO2 restores right shift |
| Stored blood transfusion | Depleted 2,3-BPG AND impaired Bohr effect → left-shifted curve, poor tissue O2 delivery |
| Strenuous exercise | Lactic acid + ↑ CO2 amplify Bohr effect → dramatically more O2 delivered to active muscle |
Summary

Explain this
Factors Controlling Haemoglobin Formation
1. Role of Proteins
- Haem - the iron-containing porphyrin ring that binds oxygen
- Globin - the protein chains (alpha and beta) that form the scaffold of the molecule
2. Role of Minerals
(i) Iron - The Most Critical Mineral
- Iron makes up 0.33% of the weight of haemoglobin
- Normal blood contains 15 g of Hb per 100 mL
- So iron in 100 mL blood = 15 × 0.33/100 = ~0.05 g = 50 mg of iron per 100 mL blood
- RBC lifespan = 120 days
- So each day, 1/120 = 0.83% (~0.8%) of total RBCs are destroyed (by the spleen/liver via haemolysis of old cells)
- Total blood volume ≈ 6 litres
- 0.8% of 6 litres = 50 mL of blood is broken down daily
- Each 100 mL contains 50 mg of iron, so 50 mL contains ~25 mg of iron released daily
(ii) Copper - The Helper Mineral
- Absorption - Copper is needed for the intestinal absorption of iron
- Mobilization - Copper-containing protein ceruloplasmin (a ferroxidase enzyme made in the liver) oxidizes iron from Fe²+ (ferrous) to Fe³+ (ferric), which is the form needed for iron to be loaded onto transferrin (the blood transport protein for iron)
- Utilization - Without ceruloplasmin, iron cannot be efficiently released from storage sites (liver, spleen) into the circulation for use in bone marrow
"Iron is absorbed in the ferrous (Fe²+) state but is oxidized to the ferric state by a ferroxidase known as ceruloplasmin (a copper-containing enzyme) for transport through the body." - Basic Medical Biochemistry, 6e
Summary Table
| Factor | Role in Hb Formation | Deficiency Effect |
|---|---|---|
| Dietary protein | Provides amino acids to build globin chains | Low globin → Hb cannot be assembled despite adequate iron |
| Iron | Forms the haem group (binds O2); 0.33% of Hb by weight | Iron-deficiency anaemia (microcytic, hypochromic) |
| Iron recycling | ~25 mg/day released from old RBCs; reused for new Hb | Disrupted recycling (e.g. haemolytic disorders) can deplete stores |
| Copper | Ceruloplasmin oxidizes Fe²+ → Fe³+ for transferrin transport; aids iron absorption and mobilization | Copper deficiency → functional iron deficiency → anaemia |
Why 1\120 is taken
Why 1/120 is Used
A Simple Analogy
- Total RBC lifespan = 120 days
- Each day = 1 day out of that 120-day lifespan
- So 1/120th of all RBCs reach the end of their life and are destroyed daily by the spleen and liver
The Full Calculation in the Text
| Step | Value |
|---|---|
| RBC lifespan | 120 days |
| Fraction destroyed per day | 1/120 |
| As a percentage | 1/120 × 100 = 0.8% |
| Total blood volume | 6 litres |
| Blood broken down daily | 6 L × 0.8% = 50 mL |
| Iron in 50 mL blood | ~25 mg (since 100 mL contains ~50 mg iron) |
Treatment of thalassemia by increasing the hbf in blood
thalassemia fetal hemoglobin induction treatment
thalassemia HbF induction BCL11A CRISPR gene therapy
Treating Thalassaemia by Increasing HbF
Why HbF Helps in Thalassaemia - The Rationale
- β-thalassaemia is caused by reduced or absent β-globin chain synthesis
- Excess α-globin chains accumulate, precipitate inside RBC precursors, and destroy them (ineffective erythropoiesis)
- This causes severe haemolytic anaemia
- γ chains pair with the excess α chains → reduces the toxic free α-chain burden
- HbF carries oxygen effectively (actually with higher affinity than HbA)
- Anaemia is ameliorated and transfusion requirements fall
Approach 1: Pharmacological HbF Induction
(a) Hydroxyurea (Hydroxycarbamide)
- The oldest and most established HbF-inducing drug
- A ribonucleotide reductase inhibitor that causes mild myelosuppression → stimulates stress erythropoiesis → erythroid precursors reactivate γ-globin gene transcription (via poorly defined epigenetic mechanisms including DNA hypomethylation)
- Well-proven in sickle cell disease - reduces pain crises, acute chest syndrome, and transfusion needs
- Less effective in β-thalassaemia - because the HbF level needed to compensate in thalassaemia is much higher than in sickle cell disease. The clinical benefit is real but more limited
"Whereas the effect of pharmacologic treatments (particularly hydroxyurea) in sickle cell disease is clear, their benefit on the clinical course of β-thalassemia is presently limited, perhaps because of the higher level of HbF required in β-thalassemia to achieve clinical results." - Goldman-Cecil Medicine, International Ed.
(b) Hypomethylating Agents
- 5-Azacytidine and decitabine (DNA methyltransferase inhibitors)
- DNA methylation of the γ-globin promoter normally silences HbF after birth
- These drugs demethylate the γ-globin promoter → reactivate γ-globin transcription
- Effective at raising HbF but have significant toxicity concerns (myelosuppression, potential mutagenicity), limiting their routine clinical use
(c) Histone Deacetylase (HDAC) Inhibitors
- e.g., butyrate, valproic acid, vorinostat
- Histone deacetylation compacts chromatin around the γ-globin gene loci, silencing them
- HDAC inhibitors open up chromatin → allow transcription factors access → HbF induced
- Largely experimental; butyrate has been tested in clinical trials with modest results
Approach 2: Targeting BCL11A - The Key Molecular Switch
- Natural mutations that reduce BCL11A function → hereditary persistence of foetal haemoglobin (HPFH) - people with this are clinically normal even if they have β-thalassaemia or sickle cell, because HbF persists
- This means: silencing BCL11A = sustained HbF production = treatment
"BCL11A is a transcription factor that normally silences HbF expression. Deletion of BCL11A leads to persistence of fetal hemoglobin, and this gene is now the target of exciting clinical trials." - Fishman's Pulmonary Diseases
Approach 3: Gene Therapy - CRISPR/Cas9 Editing (Current Frontier)
How it works:
- Patient's own haematopoietic stem cells (HSCs) are harvested from bone marrow
- CRISPR-Cas9 is used to disrupt the erythroid-specific enhancer of BCL11A in those HSCs
- Without this enhancer, BCL11A cannot be expressed in red cell precursors
- BCL11A is silenced → γ-globin gene is de-repressed → HbF is permanently produced
- The edited HSCs are transplanted back into the patient (after conditioning chemotherapy)
Results (from Harrison's Principles of Internal Medicine, 22e - 2025):
"CRISPR/Cas editing to downregulate BCL11A has resulted in increases in total hemoglobin ≥12 g/dL and HbF ≥10 g/dL, leading to transfusion independence in >90% of 52 patients aged 12-35 years with transfusion-dependent β-thalassemia."
Summary of All Approaches
| Approach | Mechanism | Status | HbF Effect |
|---|---|---|---|
| Hydroxyurea | Stress erythropoiesis + DNA hypomethylation → γ-globin ↑ | Approved (more effective in SCD than thalassaemia) | Modest ↑ |
| 5-Azacytidine / Decitabine | Demethylate γ-globin promoter | Limited clinical use (toxicity) | Moderate ↑ |
| Butyrate / HDAC inhibitors | Open chromatin at γ-globin loci | Experimental | Variable |
| CRISPR-Cas9 (Casgevy) | Disrupts BCL11A erythroid enhancer → permanent HbF | FDA/EMA approved (2023) | Large, sustained ↑ (>90% transfusion independence) |
| Lentiviral gene addition (Zynteglo) | Adds functional β-globin gene | Approved | Corrects directly |
| RNA interference against BCL11A | Post-transcriptional silencing of BCL11A | Early clinical trials | Promising |
Sickle cell anemia relation
sickle cell anemia RBC sickling hemoglobin polymerization pathophysiology
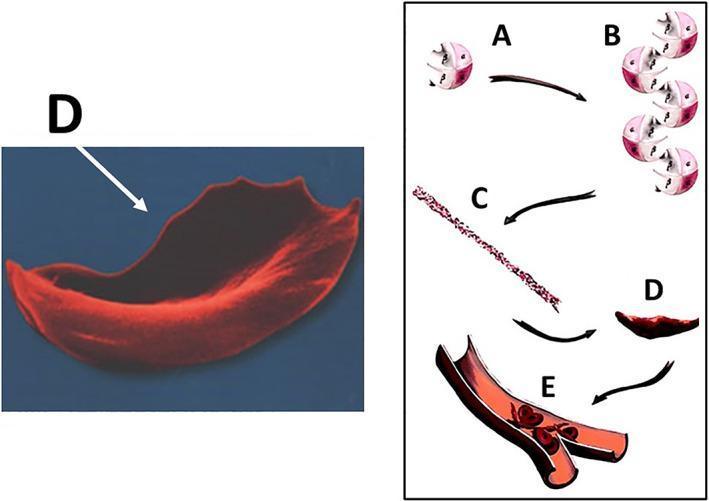
This educational graphic illustrates the molecular and cellular pathophysiology of sickle cell disease (SCD) leading to vaso-occlusion. The diagram is divided into a microscopic anatomical illustration and a high-magnification scanning electron micrograph. Steps A through D depict the hemoglobin S (HbS) polymerization process: (A) individual deoxygenated hemoglobin tetramers, (B) aggregation of hemoglobin molecules, (C) formation of long, rigid hemoglobin polymers or strands, and (D) the resulting transformation of a flexible biconcave red blood cell into a rigid, crescent or sickle-shaped erythrocyte. A corresponding scanning electron micrograph (labeled D) highlights the characteristic elongated, spicular morphology of a sickled cell. Section E shows a cross-section of a small bifurcating blood vessel where these rigid, abnormally shaped cells are aggregating, causing mechanical obstruction (vaso-occlusion) of the lumen. This process demonstrates the mechanism behind tissue ischemia and subsequent complications such as osteonecrosis in SCD patients. The content is suitable for medical students and clinicians studying hematology and musculoskeletal pathology.
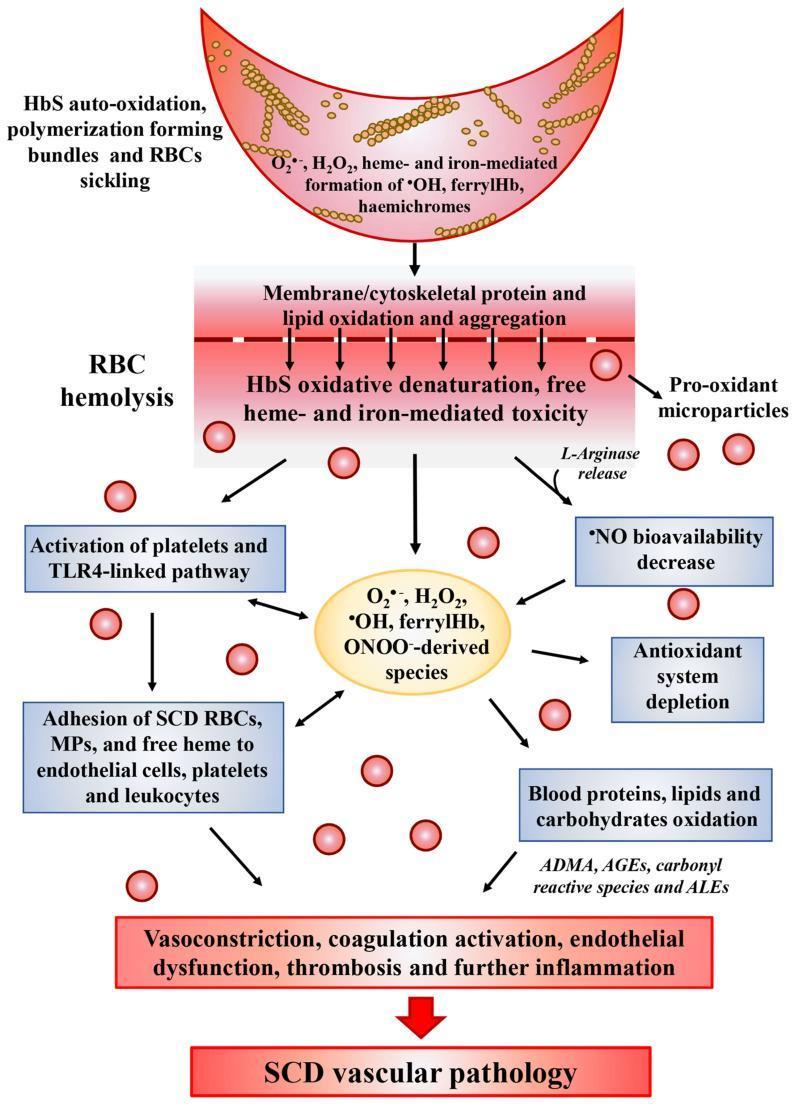
A medical pathophysiology diagram illustrating the oxidative stress cascade in Sickle Cell Disease (SCD) and its progression to vascular pathology. The diagram follows a vertical flow starting with a sickled red blood cell (RBC) undergoing HbS auto-oxidation and polymerization, leading to the generation of reactive oxygen species (ROS) such as H2O2, ferrylHb, and hemichromes. This triggers a central event of RBC hemolysis, characterized by membrane lipid oxidation, protein aggregation, and the release of pro-oxidant microparticles and L-arginase. Downstream pathways depict the systemic consequences, including the activation of platelets and the TLR4-linked inflammatory pathway, adhesion of SCD RBCs to endothelial cells and leukocytes, and a significant decrease in nitric oxide (NO) bioavailability. The lower section highlights the depletion of the antioxidant system and the oxidative modification of blood components into ADMA, AGEs, and ALEs. The cascade culminates in clinical manifestations such as vasoconstriction, endothelial dysfunction, and thrombosis, collectively summarized as SCD vascular pathology. This illustration is designed for advanced medical education regarding the molecular mechanisms of hematologic disorders.
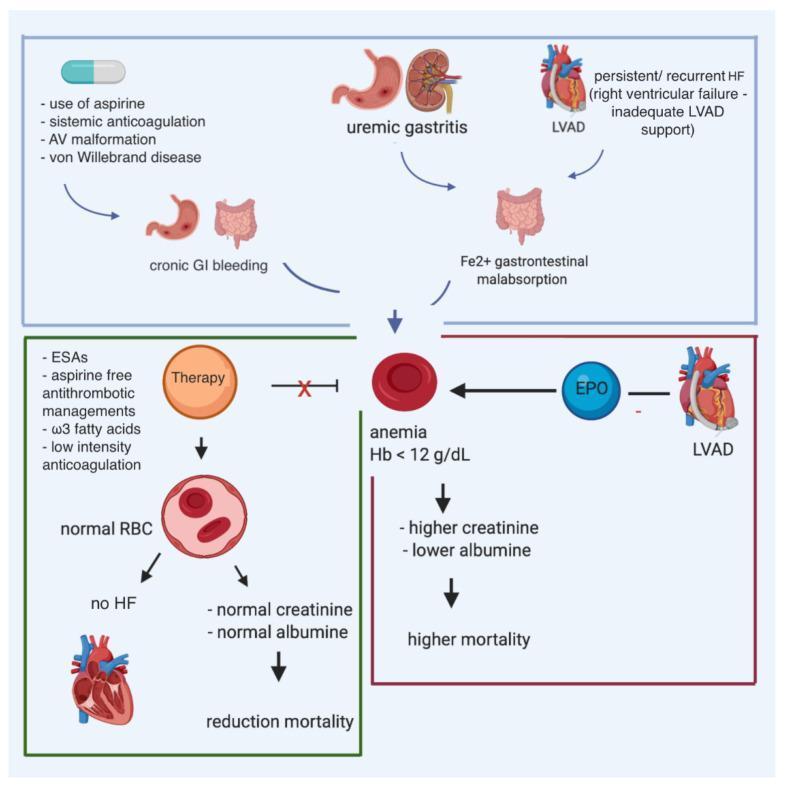
This pathophysiology diagram illustrates the multifactorial causes and consequences of anemia in patients with heart failure (HF) and a left ventricular assist device (LVAD). The top section identifies contributors to anemia, including chronic gastrointestinal (GI) bleeding secondary to aspirin use, systemic anticoagulation, arteriovenous (AV) malformations, and von Willebrand disease. Other contributing factors shown are uremic gastritis, iron (Fe2+) malabsorption, and persistent right ventricular failure. Central to the diagram is the manifestation of anemia (defined as Hemoglobin < 12 g/dL), which correlates with elevated creatinine, decreased albumin, and increased mortality. The diagram also highlights therapeutic interventions such as erythropoiesis-stimulating agents (ESAs), aspirin-free antithrombotic management, omega-3 fatty acids, and low-intensity anticoagulation. Successful therapy is depicted as leading to normal red blood cell (RBC) counts, resolution of heart failure symptoms, and reduced mortality. The role of erythropoietin (EPO) is also noted in the context of LVAD-related anemia management.
Sickle Cell Anaemia and Its Relation to HbF
1. The Basic Defect
- Normal: Glutamic acid at position 6 of the β-globin chain (negatively charged, hydrophilic)
- Mutation: Valine substituted at position 6 (neutral, hydrophobic) - caused by A→T change in codon 6
2. The Sickling Process - Step by Step
- In tissues (low pO2) → HbS deoxygenates → valine-6 hydrophobic patch exposed
- HbS molecules stack into polymer fibres (a gel/crystal)
- Fibres distort the RBC from flexible biconcave disc → rigid sickle shape
- Sickled cells are inflexible → get stuck in small capillaries
- Vaso-occlusion → tissue ischaemia and pain crises (the hallmark of SCA)
- Sickled cells are also fragile → rupture easily → haemolytic anaemia
3. Why HbF Is the Key Relationship
When HbF is present alongside HbS inside the same RBC, HbF molecules interrupt and terminate the HbS polymer chains. They physically block polymerisation.
- If HbF > ~20% of total Hb in a cell → sickling is essentially prevented in that cell
- People with Hereditary Persistence of Fetal Haemoglobin (HPFH) who also carry HbS have mild or no disease because HbF protects every RBC
- The more HbF, the less sickling, the fewer crises
4. How HbF Is Raised in Sickle Cell Treatment
Hydroxyurea - The Established Drug
- Mechanism: Inhibits ribonucleotide reductase → mild myelosuppression → bone marrow "stresses" → stress erythropoiesis reactivates γ-globin gene → ↑ HbF production
- HbF increases heterocellularly (unevenly - some cells get more protection than others)
- Average HbF rises from ~5% baseline to 15-20% on treatment
"Hydroxyurea increases HbF levels, thus diluting HbS. Polymerisation of HbS is delayed and reduced in treated patients, so painful crises are not caused by sickled cells blocking capillaries." - Lippincott Illustrated Pharmacology
- ↓ Frequency of painful vaso-occlusive crises
- ↓ Acute chest syndrome episodes
- ↓ Hospitalisations and blood transfusions
- ↓ Mortality
- Recommended for all children and adults with SCA regardless of severity
CRISPR Gene Therapy (Casgevy) - The Curative Approach
- Same mechanism as described for thalassaemia - disrupts BCL11A erythroid enhancer in patient's own stem cells
- BCL11A cannot silence the γ-globin gene → permanent, high-level HbF in all RBCs
- Results: HbF rises to >40%, sickling essentially eliminated, no more pain crises in most patients
- Approved by FDA/EMA in 2023
Voxelotor - A Different Approach
- Does not raise HbF directly
- Instead binds to the α chain of HbS, stabilising it in the oxygenated (R) state
- Deoxygenated HbS concentration decreases → less polymerisation
- Approved for patients ≥12 years old
Crizanlizumab - Addresses Downstream Effects
- Monoclonal antibody against P-selectin
- Blocks adhesion of sickled RBCs to endothelium → fewer vaso-occlusive crises
- Does not affect HbS polymerisation directly
5. Sickle Cell + Thalassaemia - The Combined Condition
- Patient inherits one HbS allele (from one parent) and one β-thalassaemia allele (from the other)
- This is one of the sickle cell disease syndromes - can be as severe as HbSS (if β⁰-thal) or milder (if β⁺-thal, which allows some normal HbA production)
- HbF induction with hydroxyurea or CRISPR therapy is equally applicable here
Summary Table
| Feature | Normal HbA | HbS (Sickle Cell) | HbF (Foetal) |
|---|---|---|---|
| β/γ chain position 6 | Glutamic acid (β) | Valine (β) | Glutamine (γ) - different chain entirely |
| Solubility when deoxygenated | High | Low - polymerises | High - does not polymerise |
| RBC shape | Biconcave disc | Sickle (when deoxygenated) | Normal (fetal RBC) |
| Effect on sickling | N/A | Causes disease | Inhibits HbS polymerisation |
| Switched off after birth? | No (replaces HbF) | No | Yes - normally switched off |