
Shock
What aspect of shock are you looking for? · What is your background / purpose?
types of shock classification diagram pathophysiology
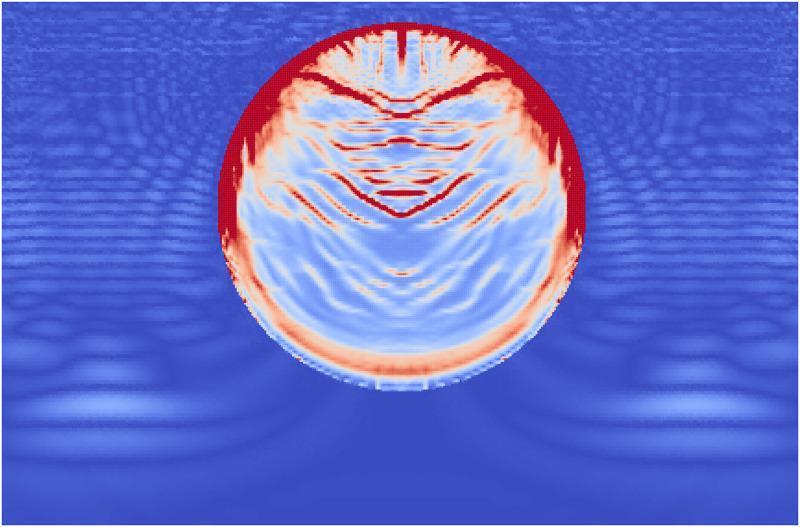
This pathophysiology diagram is a computational visualization using the Material Point Method (MPM) to simulate the effects of Extracorporeal Shock Wave Lithotripsy (ESWL) on a kidney stone. The image depicts a circular, single-phase kidney stone immersed in a fluid medium (modeled as water) at the moment a high-pressure shock wave has reached the end of the stone. The fluid medium displays stress waves as concentric, blue-toned undulating ripples propagating through the domain. Within the stone, damage accumulation is color-coded: red indicates areas of complete failure, while lighter blue and white areas represent internal stress and emerging fractures. Significant damage is concentrated at the proximal side (top) where the wavefront first impacted, showing a thick layer of failure. Distinct angled failure lines extend from the stone's edges toward the center, representing shear stress interactions. Minor damage and tensile fractures are also visible at the distal end (bottom) of the stone, resulting from internal wave reflections and interference patterns. This simulation serves as an educational model for understanding fragmentation mechanisms in urolithiasis treatment.
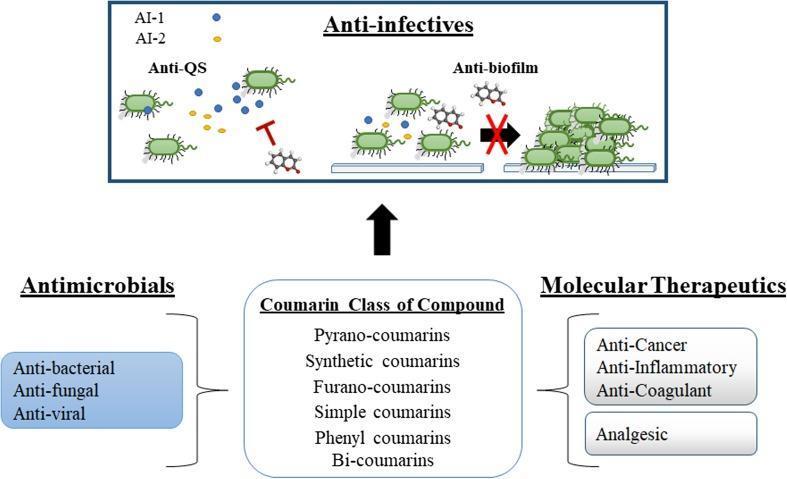
This medical pathophysiology diagram illustrates the multi-functional pharmacological properties of the coumarin class of compounds, focusing on their role as anti-infectives. The schematic is divided into two primary sections: a broad classification of coumarin types and their therapeutic applications, and a detailed mechanistic view of their anti-infective properties. The lower half categorizes coumarins into various structural types (pyrano-coumarins, synthetic, furano-coumarins, etc.) and links them to 'Antimicrobials' (anti-bacterial, anti-fungal, anti-viral) and 'Molecular Therapeutics' (anti-cancer, anti-inflammatory, anti-coagulant, analgesic). The upper section details the 'Anti-infective' mechanism, specifically highlighting 'Anti-QS' (quorum sensing) and 'Anti-biofilm' activities. In the 'Anti-QS' portion, coumarin structures are shown inhibiting signaling molecules AI-1 (blue) and AI-2 (yellow), represented by T-bar inhibition icons between bacteria. In the 'Anti-biofilm' portion, a red cross over a transition arrow signifies the inhibition of individual bacterial cells aggregating into a multicellular biofilm structure. This educational infographic summarizes how coumarins act as non-toxic modulators of microbial behavior by disrupting cell-to-cell communication and structural development in pathogens.
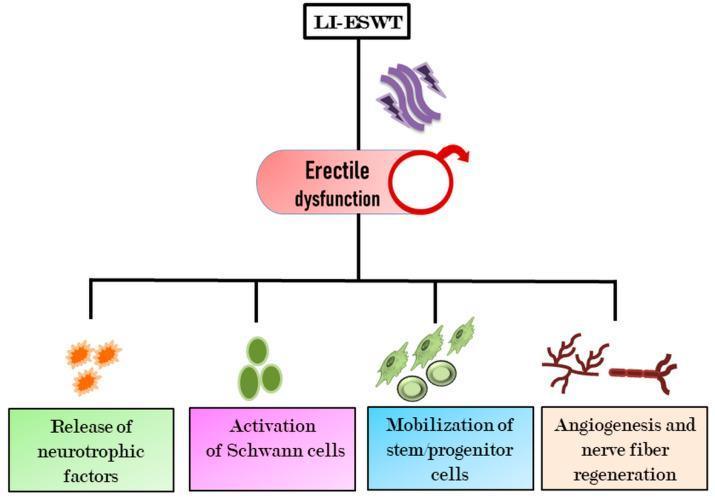
This pathophysiology diagram illustrates the therapeutic mechanisms of Low-Intensity Extracorporeal Shock Wave Therapy (LI-ESWT) in the treatment of erectile dysfunction (ED). The central flowchart displays LI-ESWT as the primary intervention, targeting a node labeled 'Erectile dysfunction' marked with a male symbol. Downstream of this interaction, the diagram identifies four key regenerative processes stimulated by shockwave energy: 1) Release of neurotrophic factors (depicted by orange star-burst icons), 2) Activation of Schwann cells (represented by green ovoid cell icons), 3) Mobilization of stem/progenitor cells (illustrated as green undifferentiated cells), and 4) Angiogenesis and nerve fiber regeneration (visualized as red branching vascular and neural structures). The diagram summarizes the biological pathways by which LI-ESWT promotes tissue repair, neovascularization, and improved hemodynamics within the penile corpora cavernosa. It is designed as an educational overview of regenerative medicine and urological therapy for medical students and clinicians.
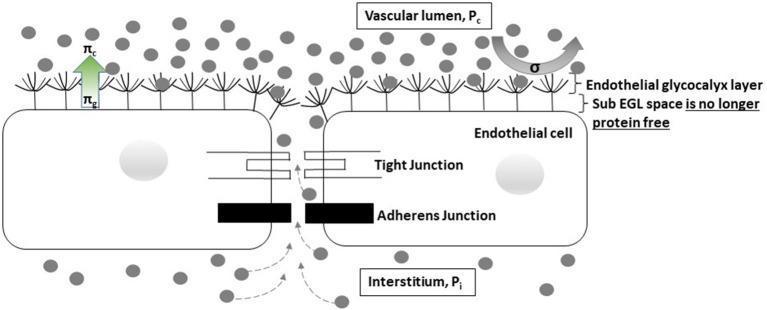
A pathophysiology diagram illustrating the Revised Starling Principle at the capillary-endothelial interface during profound shock. The illustration shows a cross-section of the vascular wall, featuring the vascular lumen (Pc), the endothelial glycocalyx layer (EGL), the sub-EGL space, and the interstitium (Pi). Key structural components include endothelial cells connected by tight and adherens junctions. The diagram highlights the loss of the protein-free status in the sub-EGL space, where proteins (represented by gray circles) diffuse from the interstitium through the inter-endothelial cleft back into the sub-EGL space. This movement indicates a transient reversal from filtration to reabsorption (autotransfusion). Pressures are annotated with arrows: πc represents capillary oncotic pressure and πg represents sub-glycocalyx oncotic pressure. The visual demonstrates how reduced hydrostatic pressure gradients (Pc ≈ Pi) in shock allow for protein accumulation in the sub-EGL, altering the effective oncotic pressure gradient that typically opposes filtration. This educational material is relevant for medical students and clinicians studying microcirculation, fluid dynamics, and critical care physiology.
Shock - Comprehensive Overview for Medical Students
Definition
- Robbins & Kumar Basic Pathology, p. 134
- Bailey and Love's Short Practice of Surgery 28th Ed., p. 32
Classification of Shock
| Type | Mechanism | CO | SVR | CVP | PCWP |
|---|---|---|---|---|---|
| Hypovolemic | Low blood/plasma volume (hemorrhage, burns, vomiting, diarrhea, "third-spacing") | ↓ | ↑ | ↓ | ↓ |
| Cardiogenic | Pump failure (MI, arrhythmia, tamponade, cardiomyopathy) | ↓ | ↑ | ↑ | ↑ |
| Obstructive | Mechanical obstruction of cardiac filling (tension pneumothorax, PE, tamponade, air embolism) | ↓ | ↑ | ↑ | ↓/↑ |
| Distributive | Vasodilation + maldistribution of flow (sepsis, anaphylaxis, neurogenic) | ↑ | ↓ | ↓ | ↓ |
| Endocrine | Adrenal insufficiency, hypothyroidism, thyrotoxicosis | Mixed | Mixed | Mixed | Mixed |
- Harrison's Principles of Internal Medicine 22E, Table 314-2
- Bailey and Love's Surgery, Table 2.1
The Four Major Types - In Detail
1. Hypovolemic Shock
- Hemorrhagic causes: Trauma, GI bleed, ruptured AAA, ectopic pregnancy
- Non-hemorrhagic causes: Vomiting, diarrhea, burns, polyuria (DI, diabetes), third-spacing (pancreatitis, bowel obstruction)
- Hypovolemia is a component of all other shock states - always address it first.
2. Cardiogenic Shock
- Causes: Myocardial infarction (most common), ventricular arrhythmia, valvular disease, cardiac tamponade (extrinsic compression), pulmonary embolism (outflow obstruction), blunt myocardial injury, cardiomyopathy
- Signs: pulmonary edema + systemic hypoperfusion (wet and cold)
- Sabiston Textbook of Surgery, p. 563
3. Distributive Shock
- Defined as sepsis + persistent hypotension requiring vasopressors despite adequate volume resuscitation + elevated lactate
- Gram-positive bacteria > gram-negative bacteria > fungi
- Mechanism: Microbial products (endotoxin, PAMPs) activate TLRs and innate immune cells → massive release of inflammatory cytokines (TNF, IL-1, IL-6) → systemic vasodilation, capillary leak, endothelial injury, DIC
- Late-phase septic shock also causes myocardial depression and relative hypovolemia from capillary leak
- Mortality: 20-40%
- IgE-mediated hypersensitivity → massive histamine release → profound vasodilation + capillary leak
- Up to 35% of circulating blood volume can extravasate within 10 minutes
- Treatment: Epinephrine (IM, first-line)
- Spinal cord injury or high spinal anesthesia → loss of sympathetic outflow → vasodilation and venous pooling
- Classic presentation: hypotension + bradycardia (loss of sympathetic tone eliminates reflex tachycardia)
4. Obstructive Shock
- Cardiac tamponade: pericardial fluid compresses both ventricles - classic "Beck's triad" (hypotension, raised JVP, muffled heart sounds)
- Tension pneumothorax: mediastinal shift obstructs venous return
- Massive pulmonary embolism: blocks RV outflow, causes RV failure
Stages of Shock
- Body's compensatory mechanisms (↑HR, ↑SVR, RAAS activation, ADH release, cortisol) maintain perfusion
- No overt organ dysfunction clinically
- May show mild lactate elevation or subtle creatinine rise
- Reversible if treated here
- Compensatory mechanisms overwhelmed
- Clear organ dysfunction appears: altered mental status, oliguria, rising lactate
- Still reversible with appropriate therapy
- Permanent organ dysfunction, multisystem organ failure (MSOF)
- Even with resuscitation, death occurs
- "Unresuscitable shock"
Pathophysiology - Cellular Level
Tissue hypoperfusion
        ↓
Cellular hypoxia → Aerobic → Anaerobic metabolism
        ↓
Lactic acidosis (metabolic acidosis)
        ↓
Glucose exhaustion → Na⁺/K⁺-ATPase pump failure
        ↓
Cell swelling, lysosomal rupture, autodigestion
        ↓
Cell death → potassium efflux → systemic hyperkalemia
        ↓
Endothelial injury → capillary leak → tissue edema → worsens hypoxia
        ↓
Complement activation, cytokine release, DIC → MSOF
- Bailey and Love's Surgery, p. 32-33
- Robbins, Cotran & Kumar Pathologic Basis of Disease, p. 134
Systemic Compensatory Responses
| System | Response | Mechanism |
|---|---|---|
| Cardiovascular | Tachycardia, vasoconstriction | Baroreceptors → catecholamine release |
| Renal | Oliguria, Na⁺ retention | RAAS activation, ↓GFR |
| Endocrine | Water retention | ADH (vasopressin) release |
| Adrenal | Sensitization to catecholamines | Cortisol release |
| Respiratory | Tachypnea, hyperventilation | Compensatory respiratory alkalosis for metabolic acidosis |
Key Investigations
| Investigation | What it shows |
|---|---|
| Serum lactate | Best marker of tissue hypoperfusion; >2 mmol/L = concern; >4 = severe |
| ABG | Metabolic acidosis (↓HCO₃, ↓pH), compensatory respiratory alkalosis |
| Urine output | <0.5 mL/kg/hr = oliguria, reflects renal perfusion |
| CBC, coagulation | Anemia (hemorrhagic), DIC (↑PT, ↑aPTT, ↓platelets, ↑D-dimer) |
| Echo/CVP | Differentiates cardiogenic vs. distributive vs. obstructive |
Management Principles (Overview)
- Airway + Breathing - Ensure adequate oxygenation (high-flow O₂, intubate if necessary)
- Circulation - IV/IO access, fluid resuscitation (crystalloids for hypovolemic; cautious in cardiogenic)
- Identify and treat the cause:
- Hypovolemic: stop bleeding, fluid/blood replacement
- Cardiogenic: inotropes (dobutamine), vasopressors (norepinephrine), reperfusion (PCI)
- Distributive/Septic: antibiotics + vasopressors (norepinephrine first-line) + source control
- Obstructive: decompress (needle thoracostomy for tension pneumo, pericardiocentesis for tamponade, anticoagulation/thrombolysis for PE)
- Anaphylactic: IM epinephrine, antihistamines, steroids
High-Yield Summary Table
| Feature | Hypovolemic | Cardiogenic | Distributive | Obstructive |
|---|---|---|---|---|
| Skin | Cold, pale | Cold, pale, clammy | Warm, flushed (early) | Cold, pale |
| CO | ↓ | ↓↓ | ↑ | ↓ |
| SVR | ↑ | ↑ | ↓ | ↑ |
| JVP | ↓ | ↑ | ↓ | ↑ |
| Lung exam | Clear | Crackles (pulmonary edema) | Clear (initially) | Clear |
| HR | ↑ | ↑ | ↑ | ↑ (except neurogenic: ↓) |
- Robbins & Kumar Basic Pathology (10th ed.), Chapter 3
- Robbins, Cotran & Kumar Pathologic Basis of Disease (10th ed.), Chapter 4
- Harrison's Principles of Internal Medicine (22nd ed., 2025), Chapter 314
- Bailey and Love's Short Practice of Surgery (28th ed.), Chapter 2
- Sabiston Textbook of Surgery (21st ed.), Chapter 6