
Left leg amputated till knee how to do ecg
ECG electrode placement limb amputation below knee modified lead placement
ECG electrode placement limb amputation modified lead
ECG on a Patient with Left Below-Knee Amputation
The Core Problem
Primary Solution: Place the LL Electrode on the Upper Left Thigh
- Place the left leg (LL / red lead) electrode on the upper thigh of the left leg, on the inner or anterior surface
- This is above the amputation stump and gives a valid reading for that limb
- All other electrodes are placed normally:
- RA (white/right arm): above the right wrist
- LA (black/left arm): above the left wrist
- RL (green/right leg): above the right ankle (ground lead)
- V1-V6 (chest leads): standard precordial positions (unchanged)
Why This Works
Alternative: Torso/Mason-Likar Placement (if thigh is also unavailable)
| Electrode | Modified Torso Position |
|---|---|
| RA | Right infraclavicular fossa (medial to deltoid) |
| LA | Left infraclavicular fossa (medial to deltoid) |
| RL | Right lower abdominal quadrant / iliac crest area |
| LL | Left lower abdominal quadrant / left anterior iliac crest area |
- Note: Mason-Likar placement can slightly alter QRS morphology and ST segments, so it should not be used interchangeably with standard ECG for serial comparison or ischemia diagnosis
Step-by-Step Summary
- Assess the stump - confirm the amputation is below the knee; the thigh is intact
- Place LL electrode on the left upper thigh - clean skin, apply gel if needed
- Place all other limb electrodes normally (RA, LA, RL at standard wrist/ankle positions)
- Place precordial leads V1-V6 as normal - these are completely unaffected by leg amputation
- Record the ECG
- Document the modification - always note in the record: "LL electrode placed on left upper thigh due to below-knee amputation"
Documentation is Mandatory
- Future ECGs are performed consistently for serial comparison
- The interpreting physician is aware of any potential minor morphological variations
- It avoids confusion during reporting
Quick Reference
| Standard Lead | Patient With Left BK Amputation |
|---|---|
| RA | Right wrist (no change) |
| LA | Left wrist (no change) |
| RL | Right ankle (no change) |
| LL | Left upper thigh |
| V1-V6 | Standard chest positions (no change) |
Show photo
12 lead ECG electrode limb lead placement diagram
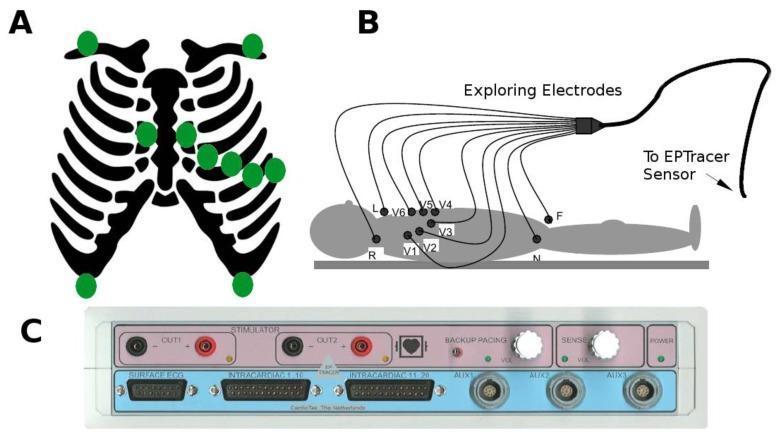
This composite educational graphic illustrates the configuration and hardware for electrocardiogram (ECG) recording. Panel A is an anatomical diagram showing the skeletal thorax with green markers indicating standard electrode placement sites, including the precordial and limb leads. Panel B presents a schematic of a human subject in the supine position, detailing the connection of exploring electrodes (labeled R, L, F, N, and V1–V6) to an EPTracer sensor system. This panel demonstrates the standardized 12-lead ECG nomenclature and the spatial distribution of chest and limb leads used to calculate potential differences against the Wilson central terminal. Panel C is a clinical photograph of the EPTracer sensor front panel, a specialized electrophysiological measurement device. The panel displays various interfaces including stimulator outputs (OUT1, OUT2), specialized ports for surface ECG and intracardiac signal acquisition, and auxiliary inputs. Control knobs for backup pacing and sensing parameters are also visible, highlighting the device's capability for both diagnostic recording and therapeutic cardiac pacing in clinical or experimental electrophysiology environments.
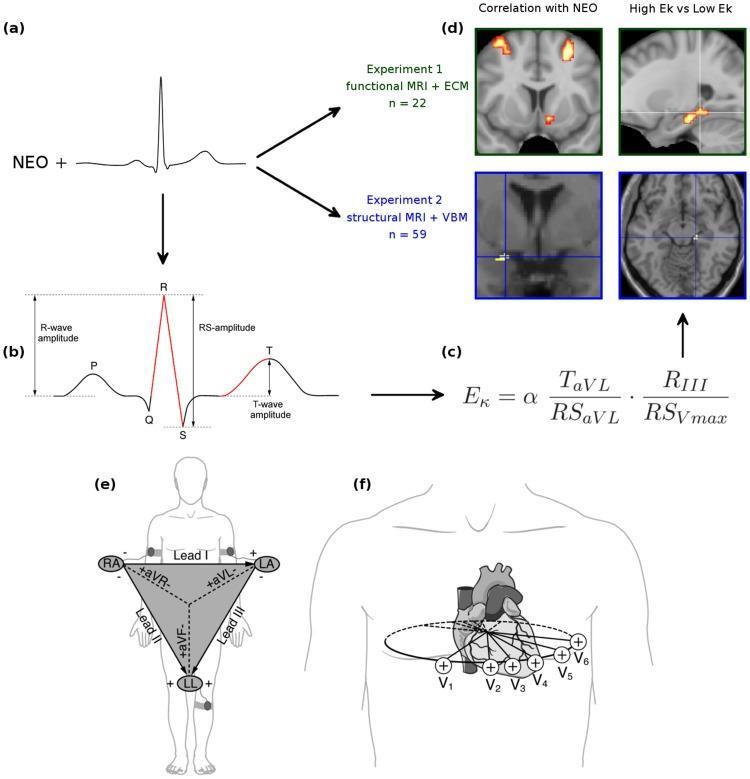
This composite educational infographic illustrates the methodology for correlating cardiac electrophysiology with neuroimaging. Panel (b) features a detailed ECG waveform diagram labeling the P-wave, QRS complex, and T-wave. It highlights measurement parameters including R-wave amplitude (baseline to peak), RS-amplitude (R-peak to S-nadir), and T-wave amplitude (plateau to peak). Panel (c) shows a mathematical formula for 'Ek', a cardiac amplitude signature derived from specific leads (aVL, III, and Vmax). Panels (e) and (f) depict standard 12-lead ECG electrode placement: the frontal plane limb leads (I, II, III, aVR, aVL, aVF) are arranged in Einthoven’s Triangle, while the horizontal plane precordial leads (V1-V6) are shown oriented across the chest wall. Panel (d) displays functional and structural neuroimaging results, specifically Eigenvector Centrality Maps and Voxel-Based Morphometry, showing significant activity and structural volume differences in the hippocampal subiculum correlated with the Ek cardiac index. The content integrates cardiology, neuroimaging (fMRI/MRI), and psychology to explore biomarkers for emotional personality.
ECG electrode placement amputation thigh modified diagram image
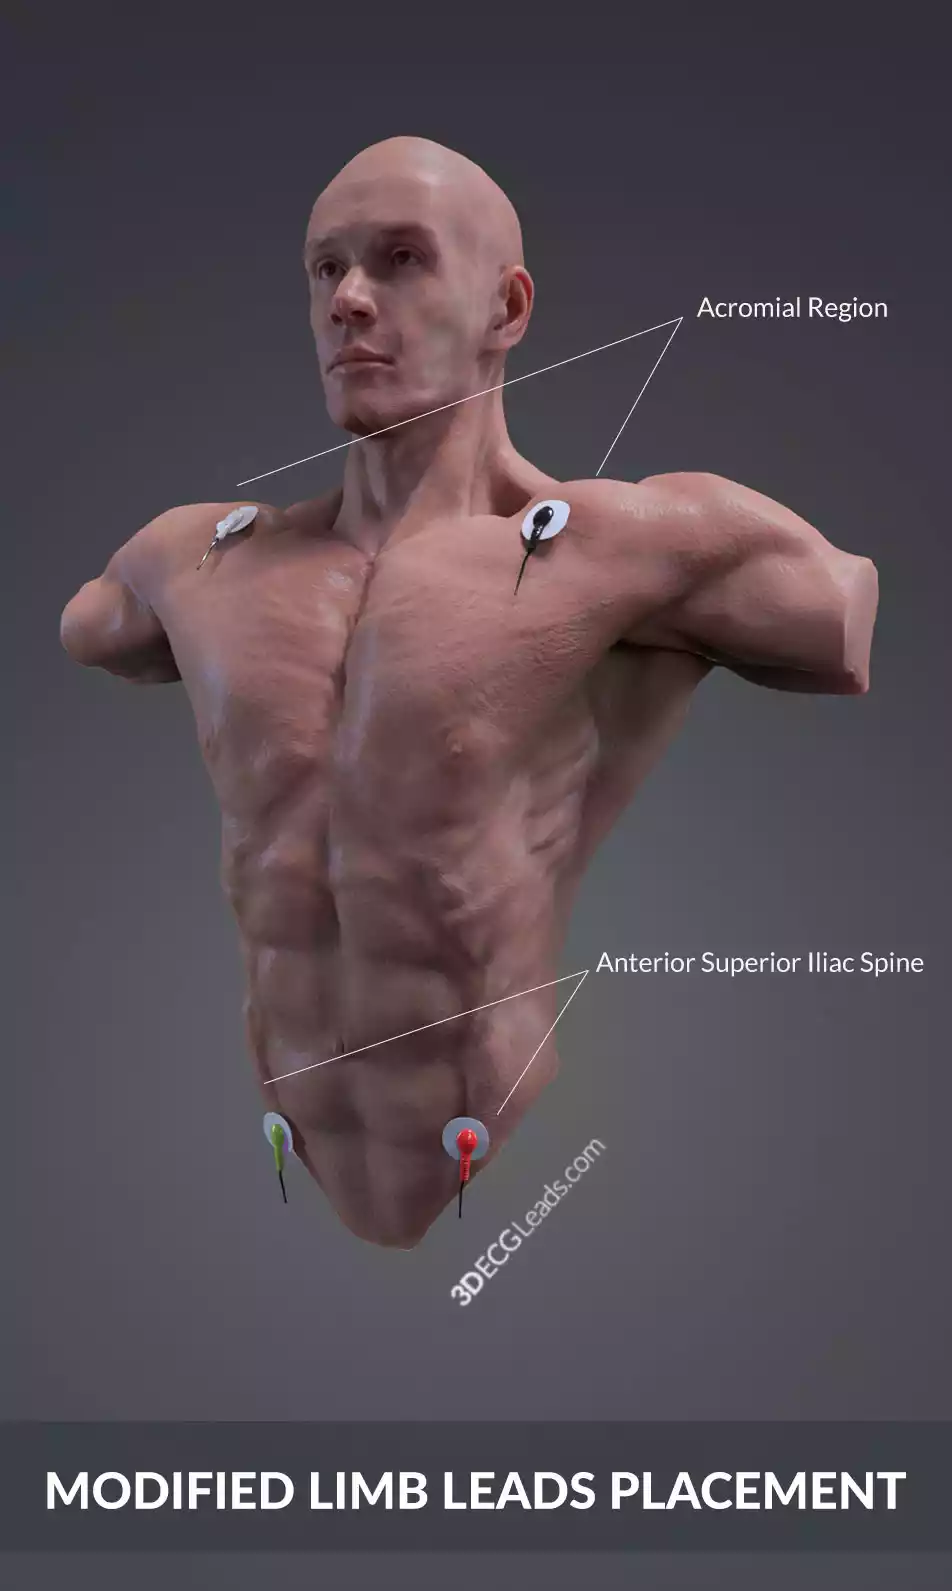
- Arm leads (RA and LA) → moved to the Acromial Region (top of shoulders)
- Leg leads (RL and LL) → moved to the Anterior Superior Iliac Spine area (lower abdomen/hip bones)
For Your Patient (Left Below-Knee Amputation Specifically):
| Lead | Placement |
|---|---|
| RA | Right wrist (normal) |
| LA | Left wrist (normal) |
| RL | Right ankle (normal) |
| LL | Left upper thigh (above the stump) |
| V1-V6 | Standard chest positions (no change) |