
Epilepsy i
What aspect of epilepsy would you like to explore?
epilepsy seizure pathophysiology mechanism neural diagram
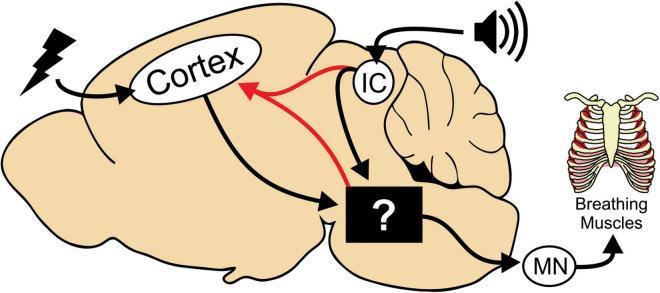
This pathophysiology diagram illustrates the neural circuitry involved in tonic phase apnea during seizures, using a rodent brain model as a surrogate for human epilepsy research. The schematic identifies two primary seizure initiation sites: the Cortex (indicated by a lightning bolt for electrical/ictal activity) and the Inferior Colliculus (IC) (indicated by a speaker icon for audiogenic triggers). Both regions project downstream to an undetermined neural substrate in the brainstem, represented by a black box with a question mark. This brainstem region is shown to recruit motor neurons (MN) that directly influence the 'Breathing Muscles' (depicted as a rib cage), illustrating the final common pathway for seizure-induced apnea. A red arrow signifies a feedback loop or seizure spread from the brainstem/IC back to the cortex, which can reactivate cortical ictal activity. The diagram serves as an educational tool to distinguish between cortical-onset and brainstem-mediated seizure components and their respective roles in respiratory dysfunction and sudden unexpected death in epilepsy (SUDEP) research.
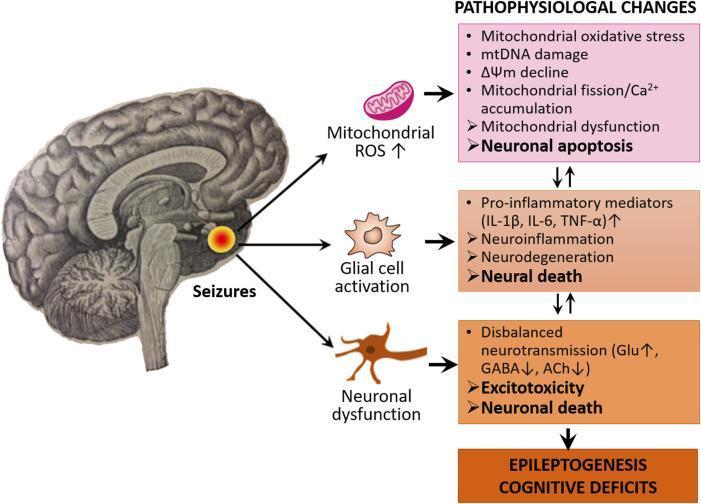
This pathophysiology diagram illustrates the interconnected pathways of epileptogenesis and cognitive deficits following seizure activity in the brain. The visual flow begins with a sagittal brain illustration highlighting a focal point of seizures, which triggers three primary cellular events: mitochondrial ROS increase, glial cell activation (microglia and astrocytes), and neuronal dysfunction. These events lead into three distinct pathophysiological cascades. The first cascade involves mitochondrial oxidative stress, mtDNA damage, membrane potential (ΔΨm) decline, and Ca2+ accumulation, resulting in mitochondrial dysfunction and neuronal apoptosis. The second cascade details neuroinflammation driven by pro-inflammatory mediators (IL-1β, IL-6, TNF-α), leading to neurodegeneration and neural death. The third cascade focuses on disbalanced neurotransmission, characterized by increased glutamate (Glu) and decreased GABA and acetylcholine (ACh), leading to excitotoxicity. These three pathways are shown to be bidirectional and mutually reinforcing, ultimately converging to drive the clinical outcomes of epileptogenesis and cognitive impairment. The diagram is intended for medical education on the molecular and cellular mechanisms of chronic epilepsy.
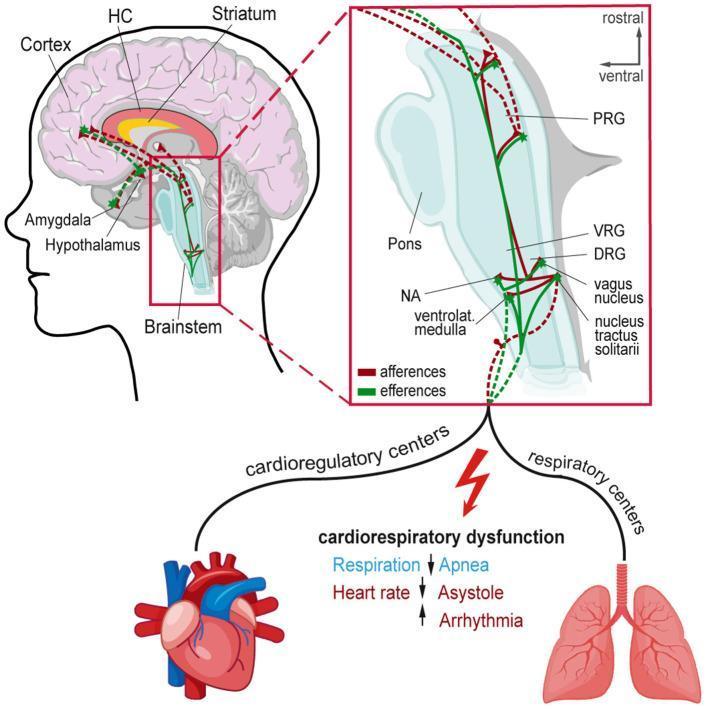
This pathophysiology diagram illustrates the neural circuitry and mechanisms of seizure-induced cardiorespiratory dysfunction leading to Sudden Unexpected Death in Epilepsy (SUDEP). The primary visual features a sagittal view of the human brain highlighting the cortex, striatum, hippocampus (HC), amygdala, and hypothalamus. Red (afferent) and green (efferent) pathways show connections between these higher cortical/limbic regions and the central autonomic network in the brainstem. A magnified inset of the brainstem details specific regulatory nuclei: the pontine respiratory group (PRG) in the pons, and the ventral respiratory group (VRG), dorsal respiratory group (DRG), nucleus ambiguus (NA), vagus nucleus, and nucleus tractus solitarii in the medulla. The diagram maps how seizure activity disrupts these cardioregulatory and respiratory centers, leading to peripheral autonomic failure. The lower section depicts the clinical outcomes of this dysfunction: apnea in the lungs, and asystole or arrhythmia in the heart, symbolized by a lightning bolt indicating acute cardiorespiratory collapse.
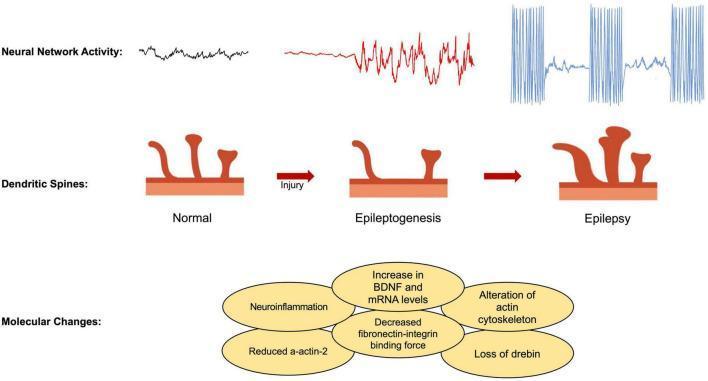
This pathophysiology diagram illustrates the progression of epilepsy through three stages: Normal, Epileptogenesis, and Epilepsy, focusing on neural network activity, dendritic spine morphology, and underlying molecular changes. The top row depicts the evolution of electrical activity from low-amplitude, irregular baseline fluctuations (Normal) to increased amplitude oscillations (Epileptogenesis, red) and finally to high-frequency, paroxysmal spike-and-wave discharges characteristic of seizures (Epilepsy, blue). The middle row shows anatomical changes in dendritic spines following an initial 'Injury'. The 'Normal' stage displays healthy mushroom-shaped and thin spines. 'Epileptogenesis' shows a reduction in spine density and morphological atrophy. The 'Epilepsy' stage demonstrates aberrant spine regrowth or remodeling, showing thickened, dysmorphic spines. The bottom section lists key molecular drivers of this progression within overlapping oval nodes, including neuroinflammation, increased BDNF and mRNA levels, alteration of the actin cytoskeleton, reduced alpha-actin-2, decreased fibronectin-integrin binding force, and loss of drebin. This illustration is intended for medical education regarding the neurobiological mechanisms of seizure development and synaptic plasticity.
"epilepsy"[MeSH Terms] AND "pathophysiology"[MeSH Terms]
Epilepsy: Pathophysiology & Mechanisms
Core Concept: Imbalance Between Excitation and Inhibition
- ROSEN's Emergency Medicine, p. 172
1. The Paroxysmal Depolarizing Shift (PDS) - The Hallmark Cellular Event
- A sudden, large (20-40 mV), long-lasting (50-200 ms) membrane depolarization that triggers a train of action potentials at its peak
- Followed by an afterhyperpolarization (AHP)
- This is essentially a massively amplified version of the normal EPSP-IPSP sequence
| Phase | Mechanism |
|---|---|
| Depolarizing phase | Activation of AMPA and NMDA glutamate receptor-channels + voltage-gated Na⁺ and Ca²⁺ channels |
| NMDA amplification | Depolarization relieves Mg²⁺ blockage of NMDA channels, allowing more Ca²⁺ influx - a positive feedback loop |
| Afterhyperpolarization | Voltage-dependent and Ca²⁺-dependent K⁺ channels + GABA-mediated Cl⁻ (GABA-A) and K⁺ (GABA-B) conductances |
- Kandel's Principles of Neural Science, 6th ed., p. 1502
2. Four Phases of Focal Seizure Development
-
Interictal period - Abnormal burst firing with intact inhibitory surround. Neurons fire the PDS but surrounding neurons suppress spread via GABAergic inhibition. This is what generates interictal spikes on EEG.
-
Synchronization within the focus - A small group of ~1,000 neurons with enhanced excitability synchronize their PDS activity.
-
Seizure spread - The AHP weakens and the inhibitory surround (GABAergic interneurons) fails. Intense pyramidal neuron firing causes a relative decrease in GABAergic synaptic transmission (either pre- or post-synaptic change in GABA release/receptors). Extracellular K⁺ accumulation depolarizes the K⁺ equilibrium potential, further reducing inhibition. Backpropagation via reciprocal thalamocortical connections amplifies the spread.
-
Secondary generalization - Spread to both hemispheres produces a generalized tonic-clonic seizure.
- Kandel's Principles of Neural Science, 6th ed., pp. 1501-1505
3. Generalized Onset Seizures - Thalamocortical Circuits
-
Driven by thalamocortical circuits rather than a focal cortical area
-
In typical absence seizures, there is a depolarization followed by preserved inhibition - this differs from focal PDS where inhibition breaks down
-
The characteristic 3 Hz spike-and-wave discharges on EEG reflect the oscillating thalamocortical loop cycling between excitatory and inhibitory phases
-
T-type Ca²⁺ channels in thalamic relay neurons are critical (hence ethosuximide's mechanism of action - T-channel blockade)
-
Kandel's Principles of Neural Science, 6th ed., p. 1505
4. Seizure Termination
- Reflex inhibition - feedback inhibitory circuits activate
- Neuronal exhaustion - metabolic depletion of the firing neuron
- Neurotransmitter rebalancing - shift from excess glutamate/acetylcholine back toward GABA dominance
- ROSEN's Emergency Medicine, p. 172
5. Failure of Termination - Status Epilepticus
-
GABA-A receptor subunit internalization - receptors migrate inside the cell, reducing surface expression and benzodiazepine efficacy (explaining why benzodiazepines become less effective over time)
-
Parallel increase in NMDA receptors on the cell surface - worsening excitotoxicity
-
This is time-sensitive: the longer seizure activity continues, the more pharmacoresistant it becomes
-
ROSEN's Emergency Medicine, pp. 172-173
6. Epileptogenesis - The Development of a Chronic Epileptic Brain
| Cascade | Mechanism | Outcome |
|---|---|---|
| Mitochondrial oxidative stress | Seizure activity → ROS ↑ → mtDNA damage → membrane potential loss → Ca²⁺ accumulation | Neuronal apoptosis |
| Neuroinflammation | Glial activation → IL-1β, IL-6, TNF-α | Neurodegeneration |
| Excitotoxicity | Glutamate ↑, GABA/ACh ↓ | Synaptic dysfunction and further lowering of seizure threshold |
- Dendritic spine remodeling - initial spine loss → aberrant regrowth with dysmorphic spines
- Mossy fiber sprouting (in temporal lobe epilepsy) - aberrant excitatory connections form within the hippocampus
7. SUDEP - Seizure Spread to Brainstem
- Apnea (respiratory arrest)
- Asystole or arrhythmia (cardiac arrest)
Summary: Drug Targets Map to These Mechanisms
| Mechanism | AED Target |
|---|---|
| Na⁺ channel (reduce high-frequency firing) | Phenytoin, carbamazepine, lamotrigine, valproate |
| GABA-A enhancement | Benzodiazepines, barbiturates, vigabatrin |
| NMDA receptor blockade | Ketamine (in refractory SE) |
| T-type Ca²⁺ channel blockade | Ethosuximide (absence) |
| SV2A synaptic vesicle protein | Levetiracetam |
| GABA reuptake inhibition | Tiagabine |