Systemic erythematous lupus , add mnemnics to remember easily

Reading File
Now let me search the medical library for SLE content in parallel with a web search for mnemonics.
Finding Sources
Searching the Web

SLE systemic lupus erythematosus mnemonics criteria features remember medical

Now let me pull detailed SLE content from the dermatology and rheumatology textbooks in parallel:
Reading File
Finding Sources
Searching Images

systemic lupus erythematosus malar rash butterfly rash clinical features
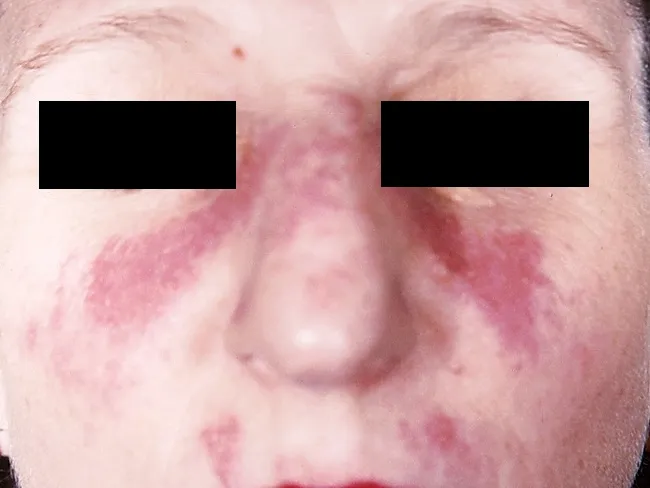
This clinical dermatology photograph displays the classic malar or butterfly rash of systemic lupus erythematosus (SLE) on the central face. Modality is clinical photography using standard white-light illumination; frontal/anterior view; color-balanced, high-resolution capture to depict superficial erythema and patchy hyperemia across the malar eminences and nasal bridge. The rash forms a bilateral, 'butterfly' distribution that typically reaches the cheeks and bridge of the nose while sparing the nasolabial folds. The observed features include confluent to patchy, erythematous macules and plaques with uniform erythema, mild perivascular edema, and subtle textural change without overt crusting or scaling in this image. The clinical morphology is characteristic for acute cutaneous lupus erythematosus; photosensitivity may exacerbate lesions. This cutaneous finding is one of the diagnostic criteria for SLE when aligned with serologic abnormalities (ANA, anti-dsDNA) and systemic features; its presence increases diagnostic probability in a compatible patient. Differential considerations include rosacea, seborrheic dermatitis, contact dermatitis, and dermatomyositis rash; however, the malar distribution and nasal bridge involvement help distinguish lupus. Clinically, this image supports SLE workup and educational reference for recognizing lupus-associated facial rash in medical students, residents, and researchers; useful for pattern-recognition training and multimodal data repository indexing. This image emphasizes clinical-context interpretation and education.
This clinical dermatology photograph displays the classic malar or butterfly rash of systemic lupus erythematosus (SLE) on the central face. Modality is clinical photography using standard white-light illumination; frontal/anterior view; color-balanced, high-resolution capture to depict superficial erythema and patchy hyperemia across the malar eminences and nasal bridge. The rash forms a bilateral, 'butterfly' distribution that typically reaches the cheeks and bridge of the nose while sparing the nasolabial folds. The observed features include confluent to patchy, erythematous macules and plaques with uniform erythema, mild perivascular edema, and subtle textural change without overt crusting or scaling in this image. The clinical morphology is characteristic for acute cutaneous lupus erythematosus; photosensitivity may exacerbate lesions. This cutaneous finding is one of the diagnostic criteria for SLE when aligned with serologic abnormalities (ANA, anti-dsDNA) and systemic features; its presence increases diagnostic probability in a compatible patient. Differential considerations include rosacea, seborrheic dermatitis, contact dermatitis, and dermatomyositis rash; however, the malar distribution and nasal bridge involvement help distinguish lupus. Clinically, this image supports SLE workup and educational reference for recognizing lupus-associated facial rash in medical students, residents, and researchers; useful for pattern-recognition training and multimodal data repository indexing. This image emphasizes clinical-context interpretation and education.

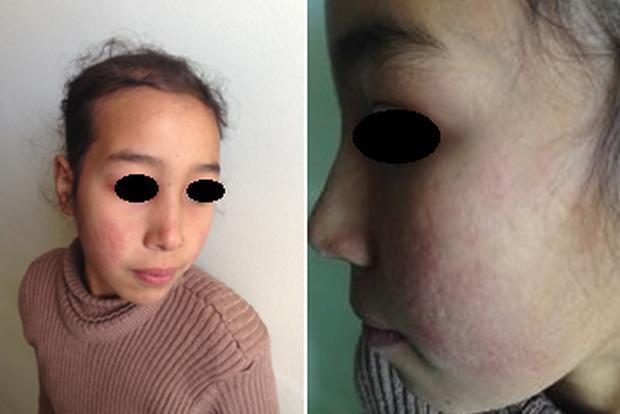
This clinical photograph displays a pediatric patient with dermatological manifestations consistent with Systemic Lupus Erythematosus (SLE). The image consists of two panels: a frontal view and a lateral close-up of the face. A distinctive malar rash, often referred to as a 'butterfly rash,' is visible across the nasal bridge and bilateral cheeks, notably sparing the nasolabial folds. The affected skin exhibits erythematous discoloration and an irregular texture. Higher magnification reveals atrophic scarring within the malar region, characterized by thin, slightly depressed skin with altered pigmentation. The forehead and peri-orbital regions appear relatively unaffected. These visual features are classic diagnostic markers for lupus-related skin involvement, illustrating the chronic inflammatory and sequela phases of the disease. The content is relevant for medical students and clinicians studying rheumatology, dermatology, and autoimmune connective tissue disorders.
This clinical photograph displays a pediatric patient with dermatological manifestations consistent with Systemic Lupus Erythematosus (SLE). The image consists of two panels: a frontal view and a lateral close-up of the face. A distinctive malar rash, often referred to as a 'butterfly rash,' is visible across the nasal bridge and bilateral cheeks, notably sparing the nasolabial folds. The affected skin exhibits erythematous discoloration and an irregular texture. Higher magnification reveals atrophic scarring within the malar region, characterized by thin, slightly depressed skin with altered pigmentation. The forehead and peri-orbital regions appear relatively unaffected. These visual features are classic diagnostic markers for lupus-related skin involvement, illustrating the chronic inflammatory and sequela phases of the disease. The content is relevant for medical students and clinicians studying rheumatology, dermatology, and autoimmune connective tissue disorders.

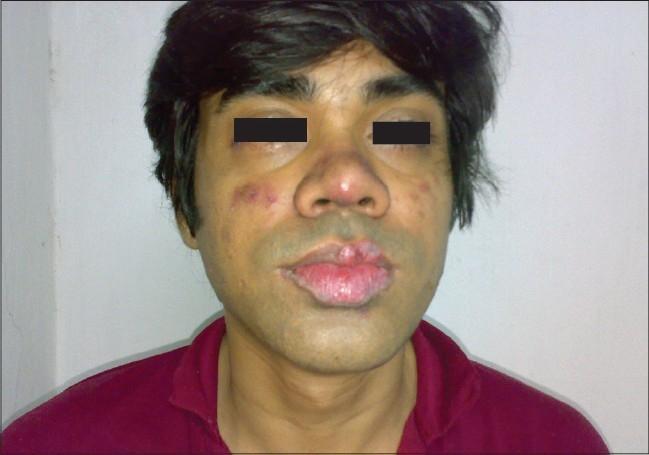
This clinical photograph shows the facial features of a male patient presenting with cutaneous manifestations of Systemic Lupus Erythematosus (SLE). A characteristic malar rash is visible, appearing as erythematous, slightly edematous plaques distributed over the bridge of the nose and extending symmetrically across the cheeks in a 'butterfly' pattern, notably sparing the nasolabial folds. Additional findings include discoid lupus erythematosus (DLE) lesions on the lips, characterized by prominent scaling, crusting, and focal areas of depigmentation and hyperpigmentation along the vermilion border. Scattered erythematous macules are also present on the peri-orbital and malar regions. These visual signs are primary diagnostic indicators for autoimmune connective tissue diseases. The educational focus is on identifying the classic distribution of acute and chronic cutaneous lupus manifestations.
This clinical photograph shows the facial features of a male patient presenting with cutaneous manifestations of Systemic Lupus Erythematosus (SLE). A characteristic malar rash is visible, appearing as erythematous, slightly edematous plaques distributed over the bridge of the nose and extending symmetrically across the cheeks in a 'butterfly' pattern, notably sparing the nasolabial folds. Additional findings include discoid lupus erythematosus (DLE) lesions on the lips, characterized by prominent scaling, crusting, and focal areas of depigmentation and hyperpigmentation along the vermilion border. Scattered erythematous macules are also present on the peri-orbital and malar regions. These visual signs are primary diagnostic indicators for autoimmune connective tissue diseases. The educational focus is on identifying the classic distribution of acute and chronic cutaneous lupus manifestations.

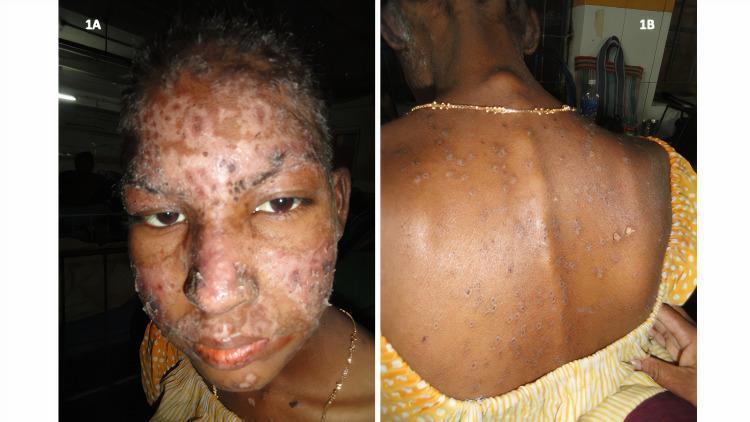
Two-panel clinical photograph (1A and 1B) illustrating cutaneous manifestations of Systemic Lupus Erythematosus (SLE). Image 1A shows a frontal view of a patient's face with a prominent erythematous malar rash extending across the bridge of the nose and cheeks. The rash demonstrates noticeable surface scaling and a characteristic sparing of the nasolabial folds, which is a classic diagnostic feature of the 'butterfly rash' in SLE. Image 1B displays the patient's posterior trunk (back), showing multiple scattered discoid-shaped lesions. These cutaneous lesions are erythematous with varying degrees of heaped-up, adherent scales on their surfaces, consistent with discoid lupus erythematosus (DLE) features. The visual presentation highlights key dermatologic findings used in the diagnosis and classification of autoimmune connective tissue diseases, focusing on morphology, scaling, and anatomical distribution.

Two-panel clinical photograph (1A and 1B) illustrating cutaneous manifestations of Systemic Lupus Erythematosus (SLE). Image 1A shows a frontal view of a patient's face with a prominent erythematous malar rash extending across the bridge of the nose and cheeks. The rash demonstrates noticeable surface scaling and a characteristic sparing of the nasolabial folds, which is a classic diagnostic feature of the 'butterfly rash' in SLE. Image 1B displays the patient's posterior trunk (back), showing multiple scattered discoid-shaped lesions. These cutaneous lesions are erythematous with varying degrees of heaped-up, adherent scales on their surfaces, consistent with discoid lupus erythematosus (DLE) features. The visual presentation highlights key dermatologic findings used in the diagnosis and classification of autoimmune connective tissue diseases, focusing on morphology, scaling, and anatomical distribution.

Now let me get the Robbins pathology content for SLE antibodies and pathogenesis:
Reading File
Searching Images

lupus nephritis immunofluorescence wire loop lesion pathology
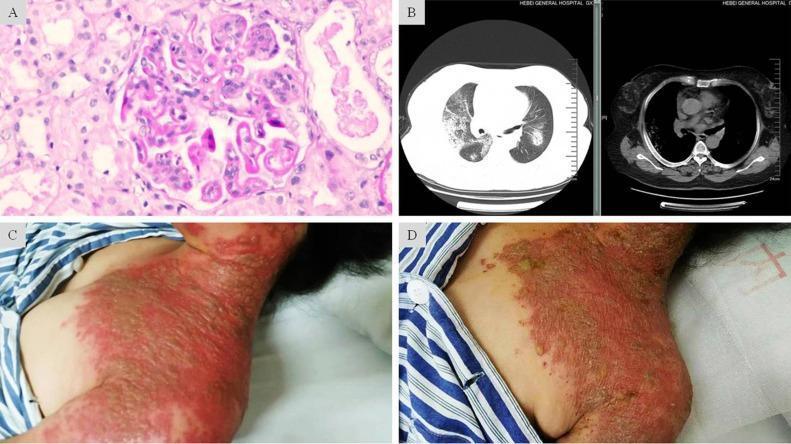
A composite medical image featuring four panels (A-D) illustrating clinical, radiological, and pathological findings of a complex case involving Lupus Nephritis and severe Herpes Zoster. Panel A is a light microscopy image (H&E stain) of a renal biopsy showing glomerular endothelial and mesangial hypercellularity with characteristic 'wire-loop' lesions, consistent with Class IV-G Lupus Nephritis. Panel B presents axial chest CT scans (lung and mediastinal windows) displaying bilateral, scattered patchy and nodular opacities with ill-defined borders, suggestive of diffuse alveolar hemorrhage. Panels C and D are clinical photographs of the neck and chest region showing the progression of skin lesions. Panel C depicts the acute phase of Herpes Zoster, characterized by confluent, grouped vesicles on an intense erythematous base extending across multiple dermatomes. Panel D shows the same region post-antiviral treatment, demonstrating resolving lesions with dried-up exudate and crusting on a fading erythematous base. This figure serves as an educational resource for multi-organ manifestations in immunocompromised patients, specifically highlighting systemic lupus erythematosus complications and disseminated viral infection.
A composite medical image featuring four panels (A-D) illustrating clinical, radiological, and pathological findings of a complex case involving Lupus Nephritis and severe Herpes Zoster. Panel A is a light microscopy image (H&E stain) of a renal biopsy showing glomerular endothelial and mesangial hypercellularity with characteristic 'wire-loop' lesions, consistent with Class IV-G Lupus Nephritis. Panel B presents axial chest CT scans (lung and mediastinal windows) displaying bilateral, scattered patchy and nodular opacities with ill-defined borders, suggestive of diffuse alveolar hemorrhage. Panels C and D are clinical photographs of the neck and chest region showing the progression of skin lesions. Panel C depicts the acute phase of Herpes Zoster, characterized by confluent, grouped vesicles on an intense erythematous base extending across multiple dermatomes. Panel D shows the same region post-antiviral treatment, demonstrating resolving lesions with dried-up exudate and crusting on a fading erythematous base. This figure serves as an educational resource for multi-organ manifestations in immunocompromised patients, specifically highlighting systemic lupus erythematosus complications and disseminated viral infection.

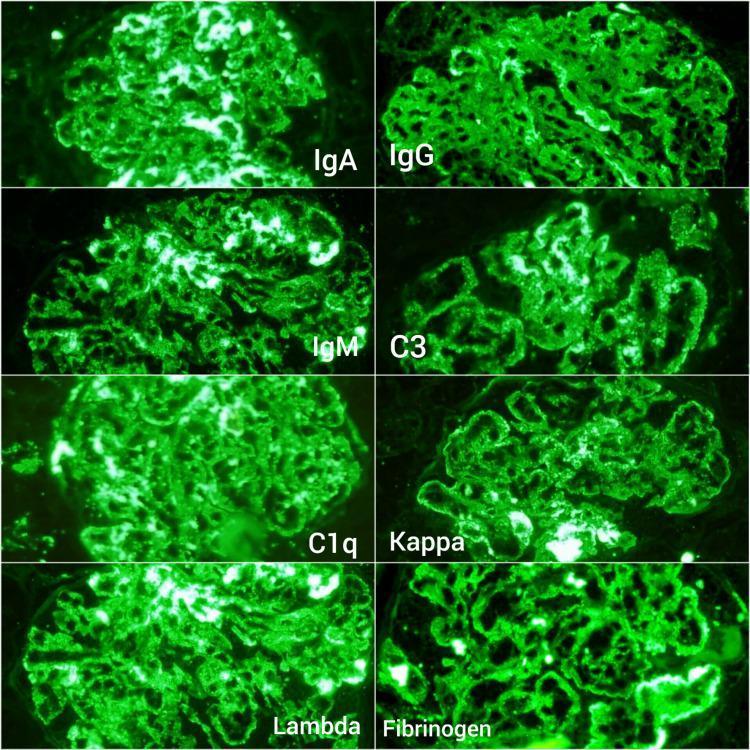
This composite diagnostic image displays eight panels of renal immunofluorescence microscopy at 200x magnification, illustrating a 'full house' staining pattern diagnostic of Lupus Nephritis (LN). The panels show granular deposits of IgA, IgG, IgM, C3, C1q, Kappa, and Lambda light chains within the glomerulus. The staining for these immunoglobulins and complement components is diffuse and granular, involving the mesangium and capillary loops. The final panel demonstrates fibrinogen immunostaining, which exhibits high-intensity (3+) positivity. Unlike the more uniform granular appearance of the immunoglobulins, the fibrinogen staining is specifically localized to glomerular capillary structures, indicating fibrin deposition consistent with intraglomerular thrombi and thrombotic microangiopathy (TMA). This visual evidence is critical for the classification of Class IV Lupus Nephritis and for assessing the activity index of the disease through the presence of necrosis and thrombosis.

This composite diagnostic image displays eight panels of renal immunofluorescence microscopy at 200x magnification, illustrating a 'full house' staining pattern diagnostic of Lupus Nephritis (LN). The panels show granular deposits of IgA, IgG, IgM, C3, C1q, Kappa, and Lambda light chains within the glomerulus. The staining for these immunoglobulins and complement components is diffuse and granular, involving the mesangium and capillary loops. The final panel demonstrates fibrinogen immunostaining, which exhibits high-intensity (3+) positivity. Unlike the more uniform granular appearance of the immunoglobulins, the fibrinogen staining is specifically localized to glomerular capillary structures, indicating fibrin deposition consistent with intraglomerular thrombi and thrombotic microangiopathy (TMA). This visual evidence is critical for the classification of Class IV Lupus Nephritis and for assessing the activity index of the disease through the presence of necrosis and thrombosis.

I now have rich content from the textbooks and images. Let me compile the full answer with mnemonics.

Systemic Lupus Erythematosus (SLE) - Complete Guide with Mnemonics

What is SLE?

SLE is a systemic autoimmune disease involving multiple organs, characterized by a vast array of autoantibodies (particularly antinuclear antibodies), where injury is caused mainly by immune complex deposition and antibody binding to cells and tissues. It is chronic, remitting-relapsing, and highly heterogeneous.
  • Prevalence: ~1 in 2500 in some populations
  • Female:male ratio = 9:1 (reproductive age 17-55 years); drops to 2:1 in childhood or after age 65
  • More prevalent and severe in African, Hispanic, and Asian populations (Robbins Pathologic Basis of Disease)

🧠 MASTER MNEMONIC #1: The ACR 11 Criteria

"I'M DAMN SHARP" (4 of 11 needed for diagnosis)

LetterCriterion
IImmunologic disorders (anti-dsDNA, anti-Sm, antiphospholipid Ab)
MMalar rash (butterfly rash over cheeks, spares nasolabial folds)
DDiscoid rash (erythematous raised patches with keratotic scaling)
AANA positive (antinuclear antibody)
MMucositis / oral/nasal ulcers (usually painless)
NNeurologic disorders (seizures, psychosis, without other cause)
SSerositis (pleuritis or pericarditis)
HHematologic disorders (hemolytic anemia, leukopenia <4000, thrombocytopenia <100k)
AArthritis (non-erosive, β‰₯2 peripheral joints, with tenderness/swelling)
RRenal disorders (proteinuria >0.5 g/day or cellular casts)
PPhotosensitivity (skin rash from UV exposure)
Remember: 4 out of 11 criteria required (serially or simultaneously).

🧠 MNEMONIC #2: The Autoantibodies - "DAMS"

LetterAntibodySignificance
DAnti-dsDNAHighly specific for SLE; correlates with disease activity and nephritis
AANAMost sensitive (~95-99%); screening test
MAnti-Sm (Smith)Highly specific for SLE (virtually diagnostic); does NOT fluctuate with activity
SAnti-SS-A/Ro, Anti-SS-B/LaAssociated with neonatal lupus, congenital heart block
Bonus tip: Anti-dsDNA = Disease activity tracker. Anti-Sm = Most specific (Sm = "Spot-on for SLE").

🧠 MNEMONIC #3: Skin Findings - "HELP OD"

LetterFinding
HHair loss (non-scarring alopecia)
EErythema (malar butterfly rash)
LLibman-Sacks endocarditis (verrucous, non-bacterial)
PPhotosensitivity
OOral/nasal ulcers
DDiscoid rash

Classic Clinical Images

The hallmark butterfly (malar) rash of SLE:
Classic malar butterfly rash of SLE - bilateral erythema over cheeks and nasal bridge, sparing nasolabial folds
Lupus nephritis pathology - "full house" immunofluorescence pattern (IgG, IgA, IgM, C3, C1q all positive):
Full house immunofluorescence in lupus nephritis

🧠 MNEMONIC #4: Organ Systems Affected - "CASH KAN"

LetterSystem
CCardiovascular - Libman-Sacks endocarditis, pericarditis, accelerated atherosclerosis
AArthritis/joints - non-erosive, non-deforming (Jaccoud's arthropathy)
SSkin - malar rash, discoid rash, photosensitivity, alopecia
HHematology - hemolytic anemia, leukopenia, thrombocytopenia
KKidney (renal) - lupus nephritis (most serious; wire-loop lesions in Class IV)
AAuto-antibodies / immunologic
NNeuro-psychiatric - seizures, psychosis, stroke

🧠 MNEMONIC #5: Lupus Nephritis Classes - "MFFD (Mal Focal Full Dense)"

ClassTypeMemory trick
IMinimal mesangialMinimal = "Mild, mesangial only"
IIMesangial proliferativeMesangial proliferative
IIIFocal (< 50% glomeruli)Focal = "Few affected"
IVDiffuse (> 50% glomeruli)Diffuse = "Dangerous, worst prognosis"; wire-loop lesions
VMembranousMembranous = nephrotic syndrome
VISclerosingSclerosis = end-stage
Wire-loop lesion = subendothelial immune complex deposits in Class IV - seen on H&E as thickened, rigid capillary loops.

🧠 MNEMONIC #6: Drug-Induced Lupus - "HIPPS"

Drugs that cause lupus:
LetterDrug
HHydralazine
IIsoniazid (INH)
PProcainamide (most common offender)
PPenicillamine
SSulfonamides
Drug-induced lupus: Anti-histone antibodies are the hallmark. Rare renal/CNS involvement. Resolves on stopping the drug.

🧠 MNEMONIC #7: SLE vs RA Joints - "SANE"

FeatureSLERA
SynovitisMildSevere
AffectsMCP, PIP jointsMCP, PIP, MTP
Non-erosiveYes (SLE)No (erosive in RA)
ErosionsAbsentPresent
SLE arthritis = "SNAP" - Symmetric, Non-erosive, Arthritis, Peripheral

Key Distinguishing Facts to Remember

FeatureMemory Hook
Most specific antibodyAnti-dsDNA & Anti-Sm ("Sm = Specific Marker")
Most sensitive antibodyANA ("Always Noticed in SLE - Sensitive")
Neonatal lupusAnti-Ro/SS-A ("Ro = ROcks the baby")
Antiphospholipid syndromeRecurrent thrombosis + fetal loss ("CLOT = Coagulation, Lupus anticoagulant, Obsteric loss, Thrombocytopenia")
Complement levelsLow C3/C4 in active disease ("Consumed = Active")
Libman-SacksVerrucous endocarditis on BOTH sides of mitral valve ("Both sides = Lupus, not Rheumatic fever")

Treatment Mnemonics - "HAM CHI"

LetterDrug
HHydroxychloroquine (for ALL SLE patients; prevents flares)
AAzathioprine (maintenance immunosuppression)
MMethotrexate (for skin/joints)
CCorticosteroids (for acute flares and organ-threatening disease)
HHigh-dose pulse methylprednisolone (severe nephritis/CNS)
IIV Cyclophosphamide (induction therapy for Class III/IV nephritis)
Belimumab (anti-BLyS monoclonal Ab) and voclosporin are newer targeted agents.

Quick Summary Card

SLE = "9:1 Female, 4 of 11 criteria"
Criteria = I'M DAMN SHARP
Antibodies = ANA (sensitive) + anti-dsDNA/Sm (specific)
Worst organ = KIDNEY (Class IV diffuse proliferative, wire-loop lesions)
Drug-induced = HIPPS (Hydralazine, INH, Procainamide, Penicillamine, Sulfonamides)
Never miss = Hydroxychloroquine for every SLE patient
(Andrews' Diseases of the Skin; Robbins Pathologic Basis of Disease; Dermatology 5e)

Pathogenesis flowchart

Finding Sources
Finding Sources
Reading File
Reading File
Reading File
I now have all the pathogenesis details from Robbins. Let me generate a clear visual flowchart.
Generating Image

A detailed medical pathogenesis flowchart for Systemic Lupus Erythematosus (SLE). Clean, professional medical education style with a white background, clear boxes and arrows. The flowchart should show these sequential and parallel steps: TOP ROW - Triggers (3 boxes side by side): - "Genetic Factors: HLA-DQ alleles, C1q/C2/C4 deficiency, TLR/IFN gene polymorphisms" - "Environmental Triggers: UV light, Drugs (hydralazine, procainamide), Viral infections, Estrogens" - "Apoptotic Cell Failure: Defective clearance of apoptotic debris β†’ nuclear antigens exposed" All three converge with arrows to a central box: "FAILURE OF SELF-TOLERANCE (Loss of central & peripheral B and T cell tolerance)" Then arrow down to: "Activation of Self-Reactive B & T Cells" (with sub-note: TLR engagement by DNA/RNA in immune complexes; Type I IFN surge from plasmacytoid dendritic cells) Arrow down to TWO parallel boxes: LEFT: "Autoantibody Production: ANA (95-99%), Anti-dsDNA (40-60%), Anti-Sm (20-30%), Anti-Ro/La, Antiphospholipid Ab" RIGHT: "Type I IFN Signature (Interferon Storm): Activates DCs, B cells, Th cells β†’ amplification loop" Both arrows converge down to: "IMMUNE COMPLEX FORMATION (Anti-dsDNA + dsDNA complexes)" Arrow down to: "Immune Complex Deposition in Tissues" Arrow down to THREE parallel outcome boxes: - "Kidneys: Glomerulonephritis (Wire-loop lesions, Class IV diffuse proliferative LN)" - "Skin: Malar rash, Vasculitis, Complement activation β†’ inflammation" - "Joints / CNS / Heart / Lungs: Synovitis, Seizures, Libman-Sacks endocarditis, Serositis" Final arrow down to: "TISSUE DAMAGE & ORGAN DYSFUNCTION" (bold, red text box) Use blue and teal for boxes, red for the final outcome box, dark gray arrows. Add a small legend noting: Type I IFN = key amplifier; NETs = neutrophil extracellular traps also activate pDCs
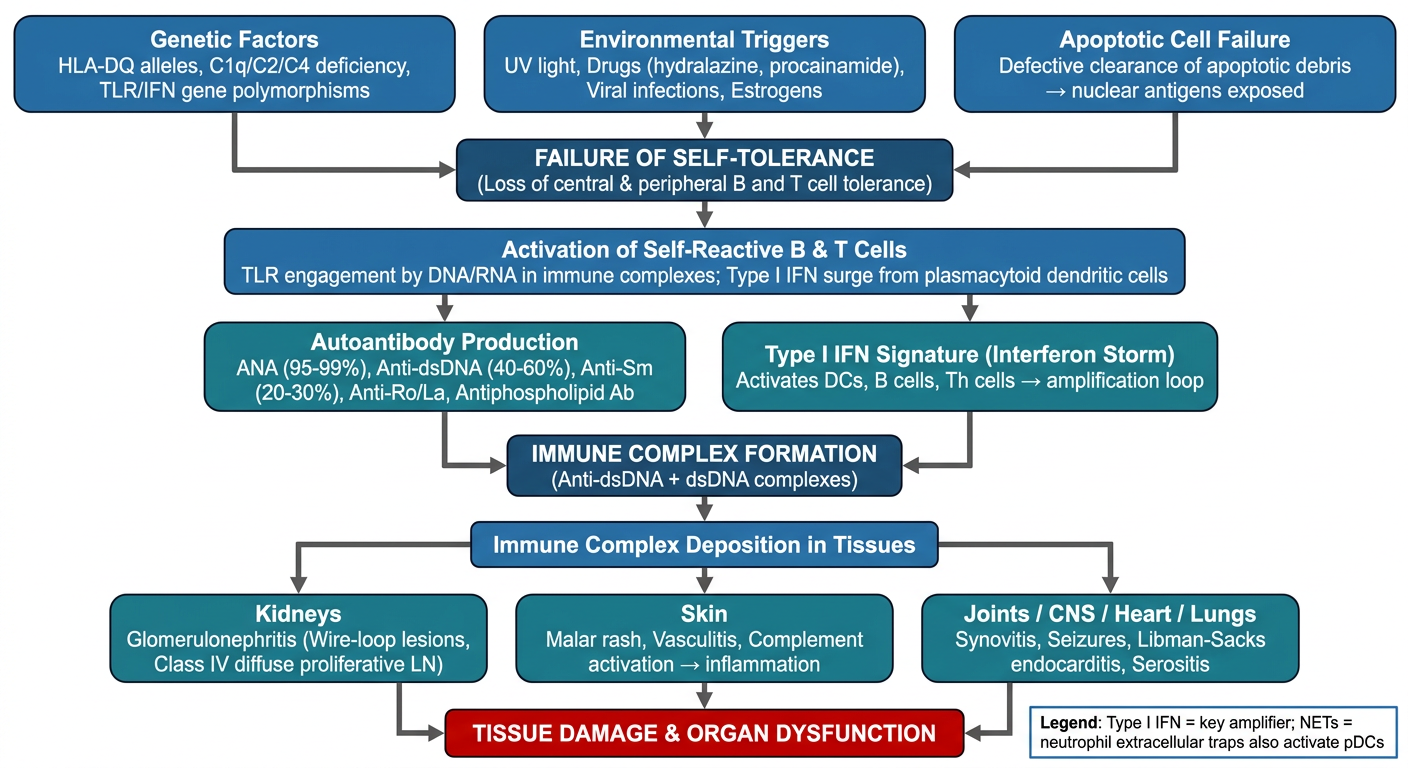
SLE Pathogenesis Flowchart

SLE Pathogenesis - Step-by-Step Explanation

Here is the full breakdown to read alongside the flowchart:

STEP 1 - Three Converging Triggers

A. Genetic Factors
  • HLA-DQ alleles linked to production of anti-dsDNA, anti-Sm, antiphospholipid Abs
  • Inherited complement deficiencies (C1q, C2, C4) β†’ defective clearance of immune complexes and apoptotic cells
  • Polymorphisms in TLR and type I IFN pathway genes
  • Monozygotic twin concordance ~20-25% (proves non-genetic factors also needed)
B. Environmental Triggers
  • UV light - induces apoptosis + alters DNA structure so TLRs recognize it as "foreign"
  • Drugs - hydralazine, procainamide, INH β†’ drug-induced lupus (anti-histone Abs)
  • Viral infections (Epstein-Barr virus implicated) - molecular mimicry
  • Estrogens - explain the 9:1 female predominance
C. Defective Apoptotic Cell Clearance
  • Normally, apoptotic cells are cleared quickly by macrophages
  • In SLE: C1q deficiency + other defects = apoptotic debris accumulates
  • Nuclear antigens (DNA, histones, RNP) become exposed and recognized as foreign
  • This is the primary source of autoantigens

STEP 2 - Failure of Self-Tolerance

The three triggers together break down both central tolerance (bone marrow/thymus) and peripheral tolerance, allowing self-reactive B and T cells to escape deletion and enter circulation.

STEP 3 - Lymphocyte Activation (The Key Amplification Loop)

Two simultaneous processes:
B Cell Activation via TLRs:
  • Self DNA/RNA released from apoptotic cells gets internalized by autoreactive B cells
  • These nucleic acids engage TLR7 (RNA) and TLR9 (DNA) inside B cells
  • TLR signaling provides a co-stimulatory "second signal" β†’ B cells produce more antinuclear autoantibodies
Type I Interferon Storm:
  • Nucleic acid-containing immune complexes activate plasmacytoid dendritic cells (pDCs)
  • pDCs produce massive amounts of IFN-Ξ±/Ξ² (Type I interferons)
  • IFNs activate more DCs, B cells, and Th cells β†’ positive feedback loop
  • This "IFN signature" is detectable in blood of SLE patients and correlates with severity
  • NETs (Neutrophil Extracellular Traps) from low-density granulocytes also activate pDCs and feed this IFN loop

STEP 4 - Autoantibody Production

AntibodyPrevalence in SLEKey Significance
ANA95-99%Most sensitive (screening)
Anti-dsDNA40-60%Specific; tracks disease activity + nephritis
Anti-Sm20-30%Highly specific; diagnostic
Anti-Ro/SS-A~30%Neonatal lupus, congenital heart block
Antiphospholipid~10%Thrombosis, recurrent miscarriage

STEP 5 - Immune Complex Formation & Deposition

  • Anti-dsDNA + free dsDNA β†’ immune complexes (ICs)
  • ICs deposit in glomerular capillaries, skin, synovium, serosal surfaces
  • IC deposition β†’ complement activation (C3a, C5a) β†’ neutrophil/macrophage recruitment β†’ inflammation and tissue damage

STEP 6 - Organ Damage

OrganMechanismLesion
KidneyIC deposition in glomeruliWire-loop lesions (Class IV diffuse proliferative LN)
SkinComplement activation, vasculitisMalar rash, discoid rash
HeartIC deposition on valve leafletsLibman-Sacks endocarditis (both sides of mitral valve)
JointsSynovial inflammationNon-erosive arthritis
CNSVasculitis, antineuronal antibodies, antiphospholipid AbsSeizures, psychosis, stroke
Blood vesselsIC-mediated vasculitisRaynaud's, purpura
Blood cellsAnti-RBC (hemolysis), anti-platelet, anti-WBC AbsHemolytic anemia, thrombocytopenia, leukopenia

The Vicious Cycle (Key Exam Point)

Apoptotic debris β†’ autoantibodies β†’ immune complexes
        ↑                                      ↓
   More tissue damage ← complement activation ← IC deposition
This self-perpetuating cycle explains why SLE is a chronic relapsing-remitting disease.
(Robbins, Cotran & Kumar Pathologic Basis of Disease; Firestein & Kelley's Textbook of Rheumatology)

Aids

Asking for Preferences

What would you like on AIDS?

Overview with pathogenesis

Based on my knowledge, AIDS (Acquired Immunodeficiency Syndrome) is caused by HIV (Human Immunodeficiency Virus), primarily HIV-1. It destroys CD4+ T cells, leading to progressive immunodeficiency and susceptibility to opportunistic infections. The pathogenesis involves viral entry via gp120/CD4 binding, reverse transcription, integration into host DNA, and eventual CD4 cell depletion below 200 cells/Β΅L defining AIDS.
Searching sources...
Reading File
Finding Sources
Finding Sources
Searching Images

HIV AIDS pathogenesis CD4 T cell life cycle replication diagram

Educational comparison diagram illustrating the mechanism of HIV viral suppression in elite controllers and long-term nonprogressors. The diagram is divided into two panels: (A) Normal HIV Life Cycle and (B) Disrupted Life Cycle. Panel A shows a single HIV virion entering a CD4+ T-cell, undergoing a seven-step replication process (binding, fusion, reverse transcription, integration, replication, assembly, and budding), resulting in successful viral replication represented by multiple mature HIV particles. Panel B depicts the same initial process but features a diagonal white bar over the CD4+ T-cell (labeled 'Disrupted Life Cycle') and two HIV particles marked with red 'X' symbols (labeled 'Unsuccessful viral replication'). The text in Panel B explains that inhibition occurs due to host genetic variants, deleterious viral mutations, viral restriction factors (e.g., TRIM5Ξ±), or strong immunological responses. This infographic serves as a medical educational tool to differentiate between typical viraemic progression and the nonprogressive phenotype found in unique HIV-infected cohorts.

Educational comparison diagram illustrating the mechanism of HIV viral suppression in elite controllers and long-term nonprogressors. The diagram is divided into two panels: (A) Normal HIV Life Cycle and (B) Disrupted Life Cycle. Panel A shows a single HIV virion entering a CD4+ T-cell, undergoing a seven-step replication process (binding, fusion, reverse transcription, integration, replication, assembly, and budding), resulting in successful viral replication represented by multiple mature HIV particles. Panel B depicts the same initial process but features a diagonal white bar over the CD4+ T-cell (labeled 'Disrupted Life Cycle') and two HIV particles marked with red 'X' symbols (labeled 'Unsuccessful viral replication'). The text in Panel B explains that inhibition occurs due to host genetic variants, deleterious viral mutations, viral restriction factors (e.g., TRIM5Ξ±), or strong immunological responses. This infographic serves as a medical educational tool to differentiate between typical viraemic progression and the nonprogressive phenotype found in unique HIV-infected cohorts.

This pathophysiology diagram illustrates the life cycle stages of Human Immunodeficiency Virus Type 1 (HIV-1) at the T-lymphocyte plasma membrane, specifically focusing on the role of lipid rafts in viral entry and egress. The illustration is divided into three sequential phases. 1. Viral egress by budding: Depicts the HIV-1 virulence factor Nef promoting viral budding from a lipid raft domain. 2. Receptor recruitment and virus attachment: Shows the mature HIV-1 virion, with labeled glycoproteins gp120 (outer spike) and gp41 (transmembrane component), attaching to the CD4 receptor. Visually, the CXCR4 co-receptor is recruited from the non-lipid raft domain toward the lipid raft containing the CCR5 co-receptor and CD4. 3. Viral entry by raft-dependent fusion: Demonstrates the final stage where the viral envelope fuses with the host plasma membrane within the lipid raft platform. The diagram uses distinct color coding to differentiate membrane microdomains and protein receptors (blue for CD4, pink for CCR5, and orange for CXCR4), highlighting the compartmentalization necessary for viral pathogenesis.

This pathophysiology diagram illustrates the life cycle stages of Human Immunodeficiency Virus Type 1 (HIV-1) at the T-lymphocyte plasma membrane, specifically focusing on the role of lipid rafts in viral entry and egress. The illustration is divided into three sequential phases. 1. Viral egress by budding: Depicts the HIV-1 virulence factor Nef promoting viral budding from a lipid raft domain. 2. Receptor recruitment and virus attachment: Shows the mature HIV-1 virion, with labeled glycoproteins gp120 (outer spike) and gp41 (transmembrane component), attaching to the CD4 receptor. Visually, the CXCR4 co-receptor is recruited from the non-lipid raft domain toward the lipid raft containing the CCR5 co-receptor and CD4. 3. Viral entry by raft-dependent fusion: Demonstrates the final stage where the viral envelope fuses with the host plasma membrane within the lipid raft platform. The diagram uses distinct color coding to differentiate membrane microdomains and protein receptors (blue for CD4, pink for CCR5, and orange for CXCR4), highlighting the compartmentalization necessary for viral pathogenesis.

This pathophysiology diagram illustrates the viral superinfection and co-infection dynamics within a CD4+ T cell latently infected with HIV-1. The top section presents various superinfecting viruses: HIV-1 subtypes, HIV-2, HTLV-1/2, HSV-1, HHV-6/7, GBV-C, and SARS-CoV-2. Each virus is depicted with its specific morphology, accompanied by text boxes detailing clinical outcomes such as pseudotyping, generation of recombinant forms (CRFs/URFs), and modulation of HIV-1 replication (e.g., HIV-2 and GBV-C mediated inhibition versus HSV-1 mediated promotion). The central portion shows the T cell membrane featuring CD4 receptors and CCR5/CXCR4 co-receptors. The lower section focuses on the nucleus, showing host genomic DNA (yellow double helix) with integrated HIV-1 provirus DNA (blue/black double helix). The molecular architecture of the HIV-1 5' Long Terminal Repeat (LTR) is highlighted between nucleosomes Nuc 0 and Nuc 1, representing the site for potential transcriptional reactivation following superinfection. The diagram effectively summarizes how secondary viral infections can influence HIV-1 pathogenesis and the latent reservoir.

This pathophysiology diagram illustrates the viral superinfection and co-infection dynamics within a CD4+ T cell latently infected with HIV-1. The top section presents various superinfecting viruses: HIV-1 subtypes, HIV-2, HTLV-1/2, HSV-1, HHV-6/7, GBV-C, and SARS-CoV-2. Each virus is depicted with its specific morphology, accompanied by text boxes detailing clinical outcomes such as pseudotyping, generation of recombinant forms (CRFs/URFs), and modulation of HIV-1 replication (e.g., HIV-2 and GBV-C mediated inhibition versus HSV-1 mediated promotion). The central portion shows the T cell membrane featuring CD4 receptors and CCR5/CXCR4 co-receptors. The lower section focuses on the nucleus, showing host genomic DNA (yellow double helix) with integrated HIV-1 provirus DNA (blue/black double helix). The molecular architecture of the HIV-1 5' Long Terminal Repeat (LTR) is highlighted between nucleosomes Nuc 0 and Nuc 1, representing the site for potential transcriptional reactivation following superinfection. The diagram effectively summarizes how secondary viral infections can influence HIV-1 pathogenesis and the latent reservoir.

Reading File
Reading File
Reading File
Searching Images

AIDS opportunistic infections oral candidiasis Kaposi sarcoma Pneumocystis pneumonia

This clinical intraoral photograph displays the hard palate and maxillary dentition of a patient, demonstrating classic oral manifestations of advanced immunodeficiency. The primary findings are multifocal, irregular, purple-to-red maculopapular lesions consistent with Kaposi sarcoma (KS). These vascular lesions exhibit poorly defined margins and vary in texture, appearing as both flat discolorations and slightly elevated plaques across the palatal mucosa. Additionally, a distinct white, patchy, friable-looking area is visible on the left side of the hard palate (indicated by a yellow arrow), characteristic of pseudomembranous candidiasis. The concurrent presentation of oral Kaposi sarcoma and candidiasis is highly suggestive of HIV/AIDS-related complications. The photograph serves as an educational resource for identifying opportunistic infections and neoplastic conditions within the oral cavity, highlighting the clinical appearance of vascular tumors and fungal overgrowth in immunocompromised individuals.

This clinical intraoral photograph displays the hard palate and maxillary dentition of a patient, demonstrating classic oral manifestations of advanced immunodeficiency. The primary findings are multifocal, irregular, purple-to-red maculopapular lesions consistent with Kaposi sarcoma (KS). These vascular lesions exhibit poorly defined margins and vary in texture, appearing as both flat discolorations and slightly elevated plaques across the palatal mucosa. Additionally, a distinct white, patchy, friable-looking area is visible on the left side of the hard palate (indicated by a yellow arrow), characteristic of pseudomembranous candidiasis. The concurrent presentation of oral Kaposi sarcoma and candidiasis is highly suggestive of HIV/AIDS-related complications. The photograph serves as an educational resource for identifying opportunistic infections and neoplastic conditions within the oral cavity, highlighting the clinical appearance of vascular tumors and fungal overgrowth in immunocompromised individuals.

This diagnostic image consists of high-resolution computed tomography (HRCT) axial slices of the chest at the level of the carina, alongside a magnified view of the lung parenchyma. The imaging demonstrates classic features of pulmonary Kaposi sarcoma. Key visual findings include prominent thickening of the bronchovascular bundles, reflecting a bronchocentric distribution of disease. There is also evident smooth and nodular thickening of the interlobular septa, characteristic of lymphatic obstruction and lymphangitic spread related to tumor invasion. These septal lines create a distinct pattern that outlines the secondary pulmonary lobules. The perihilar regions show confluent soft tissue opacities extending along the airways. Such HRCT findings are clinically significant for differentiating Kaposi sarcoma from other opportunistic infections, like Pneumocystis jirovecii pneumonia, particularly in the context of advanced HIV/AIDS. The target audience includes radiology residents and infectious disease specialists focusing on pulmonary manifestations of immunosuppression.

This diagnostic image consists of high-resolution computed tomography (HRCT) axial slices of the chest at the level of the carina, alongside a magnified view of the lung parenchyma. The imaging demonstrates classic features of pulmonary Kaposi sarcoma. Key visual findings include prominent thickening of the bronchovascular bundles, reflecting a bronchocentric distribution of disease. There is also evident smooth and nodular thickening of the interlobular septa, characteristic of lymphatic obstruction and lymphangitic spread related to tumor invasion. These septal lines create a distinct pattern that outlines the secondary pulmonary lobules. The perihilar regions show confluent soft tissue opacities extending along the airways. Such HRCT findings are clinically significant for differentiating Kaposi sarcoma from other opportunistic infections, like Pneumocystis jirovecii pneumonia, particularly in the context of advanced HIV/AIDS. The target audience includes radiology residents and infectious disease specialists focusing on pulmonary manifestations of immunosuppression.

This clinical photograph provides an intraoral view of a patient with advanced AIDS-related Kaposi sarcoma (KS). The image demonstrates extensive, multifocal lesions involving the hard palate, soft palate, and the dorsum of the tongue. The lesions appear as large, exophytic, purple-red nodules and lobulated masses with irregular surfaces. In addition to the vascular neoplastic lesions, the oral mucosa shows signs of secondary complications, including patchy white plaques suggestive of oral candidiasis. The surrounding gingival tissues are erythematous and swollen. Notable dental findings include significant brownish staining and plaque accumulation on the maxillary teeth, likely reflecting poor oral hygiene secondary to the pain and mechanical obstruction caused by the large intraoral masses. This image serves as a classic illustration of the severe oral manifestations of Human Herpesvirus 8 (HHV-8) infection in the context of profound immunosuppression, highlighting the clinical presentation of nodular KS which can interfere with speech, mastication, and swallowing.

This clinical photograph provides an intraoral view of a patient with advanced AIDS-related Kaposi sarcoma (KS). The image demonstrates extensive, multifocal lesions involving the hard palate, soft palate, and the dorsum of the tongue. The lesions appear as large, exophytic, purple-red nodules and lobulated masses with irregular surfaces. In addition to the vascular neoplastic lesions, the oral mucosa shows signs of secondary complications, including patchy white plaques suggestive of oral candidiasis. The surrounding gingival tissues are erythematous and swollen. Notable dental findings include significant brownish staining and plaque accumulation on the maxillary teeth, likely reflecting poor oral hygiene secondary to the pain and mechanical obstruction caused by the large intraoral masses. This image serves as a classic illustration of the severe oral manifestations of Human Herpesvirus 8 (HHV-8) infection in the context of profound immunosuppression, highlighting the clinical presentation of nodular KS which can interfere with speech, mastication, and swallowing.

Now I have all the content needed. Let me generate the pathogenesis flowchart and compile the full response.
Generating Image

A detailed medical education pathogenesis flowchart for HIV/AIDS. Clean, professional style, white background, clear labeled boxes with arrows. The flowchart should show: TOP: "HIV-1 (Retrovirus) - RNA virus with gp120, gp41 envelope glycoproteins" Arrow down to "ENTRY INTO HOST (Route: sexual, blood, vertical/mother to child)" Arrow down to a wide box: "VIRAL ENTRY INTO CD4+ T CELLS, Macrophages, Dendritic Cells" Sub-note: "Step 1: gp120 binds CD4 receptor β†’ Step 2: Conformational change β†’ gp120 binds CCR5 (R5/M-tropic) or CXCR4 (X4/T-tropic) co-receptor β†’ Step 3: gp41 fusion peptide inserts into host membrane β†’ FUSION" Arrow down to: "REVERSE TRANSCRIPTION (RNA β†’ DNA) by Reverse Transcriptase enzyme" Arrow down to: "INTEGRATION INTO HOST GENOME β†’ PROVIRUS (by Integrase enzyme)" Now split into two branches: LEFT BRANCH: "LATENCY PHASE - Provirus dormant in resting CD4+ T cells and macrophages; Clinical latency for months to years; Virus replicates continuously in lymph nodes (lymphoid tissue reservoir)" RIGHT BRANCH: "VIRAL ACTIVATION (triggered by cytokines, co-infections, immune stimulation) β†’ Active transcription β†’ Assembly β†’ Budding β†’ Release of new virions (Protease enzyme matures new virions)" Both arrows converge to: "PROGRESSIVE CD4+ T CELL DEPLETION" Sub-boxes: "Direct killing (viral cytopathic effect)" + "Apoptosis (chronic stimulation)" + "CTL (CD8+) killing of infected T cells" + "Thymic dysfunction" Arrow down to: "CD4+ T CELL COUNT < 200 cells/Β΅L β†’ AIDS DEFINED" Arrow down to three parallel outcome boxes: "Opportunistic Infections: PCP, CMV, MAC, Toxoplasmosis, Cryptococcal meningitis, TB" "AIDS-defining Tumors: Kaposi Sarcoma (HHV-8), NHL, Cervical cancer, Primary CNS lymphoma" "AIDS Dementia Complex: Monocyte/macrophage CNS infiltration; HIV encephalopathy" Use blue/teal for main boxes, orange for the viral entry/replication boxes, red for AIDS-defining box at bottom, gray for latency. Label co-receptors clearly. Add viral set point note.

HIV / AIDS - Complete Overview with Pathogenesis


What is AIDS?

AIDS (Acquired Immunodeficiency Syndrome) is the end-stage of infection with HIV (Human Immunodeficiency Virus), a retrovirus that selectively destroys CD4+ T helper cells, causing profound immunodeficiency and susceptibility to opportunistic infections and tumors.
  • Caused by: HIV-1 (worldwide) and HIV-2 (West Africa, milder)
  • Defined by: CD4+ count < 200 cells/Β΅L OR an AIDS-defining illness
  • F:M ratio ~1:1 globally (predominantly heterosexual transmission in sub-Saharan Africa)
(Robbins, Cotran & Kumar Pathologic Basis of Disease)

🧠 MNEMONIC - HIV Basics: "R-GRIP"

LetterFeature
RRetrovirus (RNA virus β†’ DNA via reverse transcriptase)
GGp120 + gp41 envelope glycoproteins (entry molecules)
RReservoir in lymphoid tissue (latent provirus)
IImmunodeficiency (CD4+ T cell destruction)
PProgression to AIDS (CD4 < 200 cells/Β΅L)

HIV Genome - Key Genes: "GAG POL ENV"

GeneEncodesFunction
gagCore proteins (p24, p17)Structural capsid
polReverse transcriptase, Integrase, ProteaseReplication enzymes - drug targets
envgp120 + gp41Envelope glycoproteins for host cell entry
tat/revRegulatory proteinsAmplify viral transcription
vif/vpr/vpu/nefAccessory proteinsImmune evasion, virulence

Pathogenesis Flowchart

HIV/AIDS Pathogenesis Flowchart

Step-by-Step Pathogenesis

STEP 1 - Viral Entry

Route of transmission: sexual contact (mucosal), blood/blood products, vertical (mother-to-child)
Molecular entry mechanism (the "deadly handshake"):
gp120 binds CD4 receptor
        ↓
Conformational change β†’ new binding site on gp120
        ↓
gp120 binds co-receptor:
  β€’ CCR5 β†’ R5/M-tropic HIV (macrophage-tropic, early infection, ~90%)
  β€’ CXCR4 β†’ X4/T-tropic HIV (T-cell tropic, late infection, more virulent)
        ↓
Conformational change in gp41 β†’ fusion peptide exposed
        ↓
gp41 inserts into host cell membrane β†’ FUSION
        ↓
Viral core enters cell
Key fact: CCR5Ξ”32 homozygous mutation = natural resistance to HIV infection (no CCR5 co-receptor)

STEP 2 - Intracellular Replication Cycle

Viral RNA enters cytoplasm
        ↓
Reverse Transcriptase: RNA β†’ double-stranded DNA
        ↓
Nuclear import of viral DNA
        ↓
Integrase: viral DNA integrates into host genome β†’ PROVIRUS
        ↓
Latency (resting T cells, macrophages) OR Activation
        ↓ (on activation by cytokines, co-infections, immune stimuli)
Transcription: provirus DNA β†’ viral RNA (tat protein amplifies this)
        ↓
Translation β†’ viral proteins
        ↓
Assembly β†’ budding at cell membrane
        ↓
Protease cleaves precursor proteins β†’ mature, infectious virion released

STEP 3 - Spread and the Viral Set Point

  • After initial mucosal infection, virus spreads to draining lymph nodes within days
  • Dendritic cells capture HIV and transfer it directly to CD4+ T cells in lymphoid tissue
  • Viremia peak at 3-6 weeks β†’ acute retroviral syndrome (flu-like illness in 40-90% of patients)
  • Host mounts CD8+ CTL and antibody responses β†’ seroconversion at 3-7 weeks
  • Viremia drops to a stable "viral set point" by ~12 weeks
  • Viral set point predicts rate of CD4 decline:
    • < 4,350 copies/Β΅L β†’ only 8% progressed to AIDS in 5 years
    • 36,270 copies/Β΅L β†’ 62% progressed to AIDS in 5 years

STEP 4 - CD4+ T Cell Depletion (Core of Pathogenesis)

Four mechanisms of CD4 loss:
MechanismDetail
Direct viral cytopathicityViral budding disrupts cell membrane β†’ cell death
ApoptosisChronic antigen stimulation β†’ activation-induced cell death
CTL killingCD8+ cytotoxic T cells destroy HIV-infected CD4+ cells
Thymic dysfunctionHIV infects thymic precursors β†’ reduced T cell output
Bystander effects (uninfected cells also die):
  • Pyroptosis (caspase-1 mediated) of bystander CD4+ T cells exposed to abortive HIV replication
  • Chronic immune activation depletes non-infected T cells via apoptosis
  • Loss of gut-associated lymphoid tissue (GALT) CD4+ cells early β†’ microbial translocation β†’ persistent systemic inflammation

STEP 5 - Disease Phases

PhaseCD4 CountFeatures
Acute retroviral syndromeTransient dropFever, sore throat, myalgia, rash, lymphadenopathy (3-6 weeks)
Clinical latency200-500 cells/Β΅LAsymptomatic or mild; continuous lymph node replication; lasts months-years
Symptomatic HIV200-500 cells/Β΅LThrush, herpes zoster, hairy leukoplakia, constitutional symptoms
AIDS< 200 cells/Β΅LOpportunistic infections, AIDS-defining tumors, AIDS dementia

🧠 MNEMONIC - AIDS-Defining Conditions: "TOCK-KP"

LetterCondition
TToxoplasmosis (CNS abscess; CD4 < 100)
OOesophageal candidiasis / Oral thrush
CCryptococcal meningitis, CMV retinitis, Cryptosporidiosis
KKaposi Sarcoma (HHV-8; violaceous skin/mucosal lesions)
KKach (MAC - Mycobacterium avium complex; disseminated; CD4 < 50)
PPCP - Pneumocystis jirovecii pneumonia (most common AIDS OI)
Classic oral findings in AIDS (Kaposi sarcoma + candidiasis):
Oral Kaposi sarcoma and candidiasis in AIDS

🧠 MNEMONIC - Opportunistic Infections by CD4 Level: "5-2-1-5"

CD4 CountInfections to Remember
< 500Herpes zoster, oral candidiasis, TB
< 200PCP, Toxoplasmosis, Histoplasmosis, Coccidioidomycosis
< 100CMV retinitis, Cryptococcal meningitis, Microsporidiosis
< 50MAC (Mycobacterium avium complex), Primary CNS lymphoma

AIDS-Defining Tumors

TumorCauseNotes
Kaposi SarcomaHHV-8Violaceous skin, mucosal, visceral lesions
Non-Hodgkin LymphomaEBVExtranodal (CNS, GI, bone marrow)
Primary CNS LymphomaEBVCD4 < 50; ring-enhancing lesions on MRI (mimic toxo)
Cervical carcinoma (invasive)HPVHigh-risk HPV 16/18

🧠 MNEMONIC - ART Drug Classes: "NNIPI"

LetterClassExample
NNRTIs (Nucleoside Reverse Transcriptase Inhibitors)Tenofovir, Emtricitabine, Zidovudine
NNNRTIs (Non-nucleoside RTIs)Efavirenz, Nevirapine
IIntegrase InhibitorsDolutegravir, Raltegravir
PProtease InhibitorsLopinavir, Ritonavir (boosted)
IInhibitors of entry/fusionEnfuvirtide (gp41), Maraviroc (CCR5 blocker)
Standard first-line ART: Tenofovir + Emtricitabine + Dolutegravir (TDF/FTC/DTG)

Quick Summary

HIV = Retrovirus β†’ CD4 cell destruction via gp120-CD4-CCR5/CXCR4 binding
Life cycle = Bind β†’ Fuse β†’ Reverse Transcribe β†’ Integrate β†’ Activate β†’ Bud
Viral set point = predictor of disease progression
AIDS = CD4 < 200 OR AIDS-defining illness
Most common OI = PCP (Pneumocystis jirovecii pneumonia)
Most specific tumor = Kaposi Sarcoma (HHV-8)
ART goal = undetectable viral load β†’ immune reconstitution
(Robbins, Cotran & Kumar Pathologic Basis of Disease; Harrison's Principles of Internal Medicine 22e)
This is a shared conversation. Sign in to Orris to start your own chat.