
Explain echo report
echocardiography report cardiac measurements
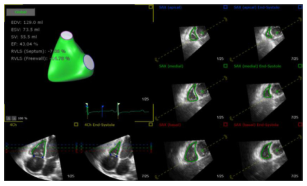
Summary : This figure presents a multi-panel echocardiographic analysis of the right ventricle, including 3D modeling, quantitative measurements, and multiple ultrasound image slices at different cardiac phases. photo (echocardiography analysis) : # Scene Overview : • Main subject is a composite echocardiography report showing right ventricular (RV) function. • Central 3D model of the RV (green) with labeled regions. • Multiple ultrasound image slices (grayscale) of the heart in different views and time points. • Overlaid colored contours and measurement lines on ultrasound images. • ECG trace shown below the 3D model, synchronized with image frames. # Technical Details : • Quantitative measurements listed (left side): – EDV: 128.0 ml – ESV: 73.5 ml – SV: 55.1 ml – EF: 43.0 % – RVLS (Septum): -8.7 % – RVLS (Freewall): -16.7 % • 3D model highlights septal and freewall regions. • Image panels labeled with cardiac phase (e.g., End Systole, End Diastole). • Color-coded overlays (green, yellow, red) on ultrasound images indicate tracked myocardial regions. • ECG trace with markers for cardiac cycle timing. # Spatial Relationships : • 3D model and measurements on the left; ultrasound image panels arranged in a grid on the right. • Each ultrasound panel corresponds to a specific cardiac phase and anatomical slice. • ECG trace aligns temporally with image frames. # Analysis : • The figure provides a comprehensive visual and quantitative assessment of right ventricular function, including volumetric and strain measurements. • The 3D model and color overlays facilitate regional analysis of RV motion. • The arrangement allows for temporal and spatial correlation between cardiac cycle, anatomy, and function.
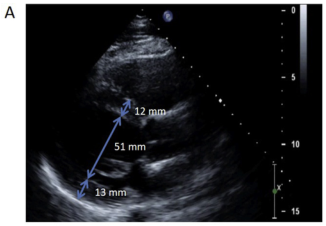
Summary : This image shows a cardiac ultrasound (echocardiogram) with three key measurements annotated in millimeters, likely assessing heart chamber dimensions and wall thickness. photo: Scene Overview : • Main subject is a grayscale echocardiogram image of the heart, oriented in a standard parasternal long-axis view. • The image is annotated with three blue double-headed arrows indicating measured distances within the heart. • The measurements are labeled as 12 mm, 51 mm, and 13 mm. Technical Details : • Imaging modality: ultrasound (echocardiography). • Measurement arrows: – 12 mm: likely represents anterior wall thickness or chamber dimension. – 51 mm: likely represents the left ventricular internal diameter. – 13 mm: likely represents posterior wall thickness or another chamber dimension. • Right side of the image includes a vertical scale (0 to 15), possibly depth in centimeters. • No scale bar, but measurements are directly annotated. Spatial Relationships : • The 12 mm and 13 mm arrows are perpendicular to the long axis of the ventricle, suggesting wall thickness measurements. • The 51 mm arrow spans the largest distance, likely across the left ventricle. • All measurements are taken at approximately the same depth within the image. Analysis : • The image provides quantitative assessment of cardiac structure, with clear visualization of chamber size and wall thickness. • The measured values (12 mm, 51 mm, 13 mm) are typical for evaluating cardiac function and morphology. • No obvious abnormalities or anomalies are visible in the measured regions; the heart structures appear well-defined.
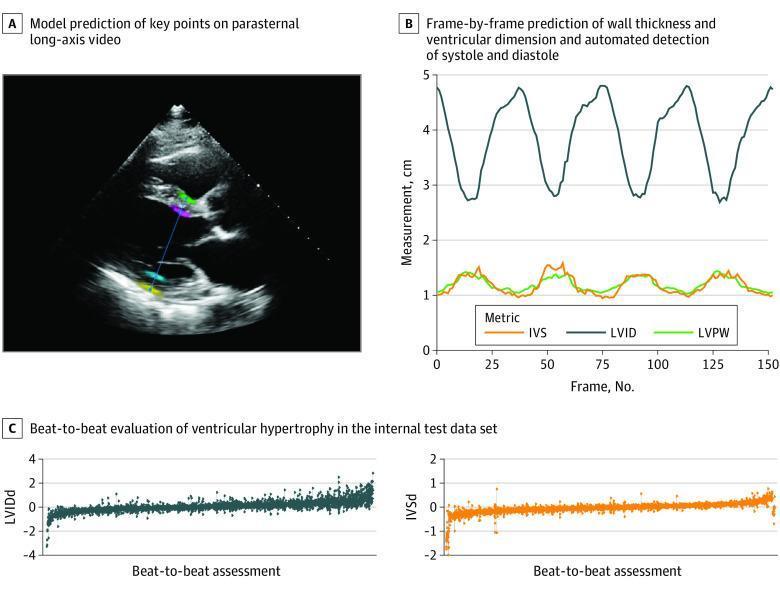
This composite educational image illustrates automated deep learning assessments of cardiac dimensions using echocardiography. Panel A displays a grayscale transthoracic echocardiogram in a parasternal long-axis (PLAX) view. It features overlaid colored landmark points and a measurement vector identified by AI to segment the intraventricular septum (IVS), left ventricular internal dimension (LVID), and left ventricular posterior wall (LVPW). Visible structures include the left ventricle, aortic root, and mitral valve. Panel B is a time-series line graph tracking cardiac measurements in centimeters across approximately 150 video frames. It shows cyclical oscillations corresponding to the cardiac cycle for LVID (dark blue), IVS (orange), and LVPW (green), demonstrating automated detection of systolic and diastolic phases. Panel C presents two waterfall scatter plots showing beat-to-beat evaluation of ventricular hypertrophy across a large dataset. The plots display individual measurement variations for diastolic left ventricular internal dimension (LVIDd) and diastolic intraventricular septum (IVSd). This figure demonstrates the clinical application of AI in high-throughput, automated screening for conditions like hypertrophic cardiomyopathy and cardiac amyloidosis.
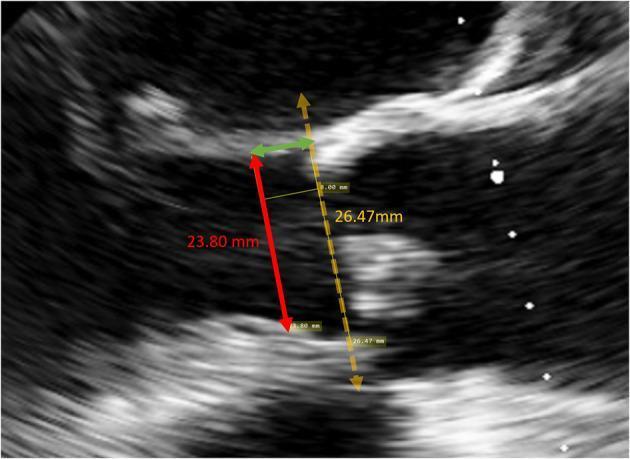
A mid-esophageal long-axis view obtained via Transesophageal Echocardiography (TEE) showing preoperative measurements of the Left Ventricular Outflow Tract (LVOT). The diagnostic image demonstrates critical cardiac anatomy for surgical planning, including the interventricular septum, aortic valve region, and the anterior mitral leaflet. Three distinct measurement lines are annotated: a dashed yellow line (26.47 mm) representing the aortic annulus diameter; a solid red line (23.80 mm) measuring the LVOT diameter at the theoretical landing site; and a horizontal green arrow indicating an 8.00 mm distance apical to the annulus to define that landing site. This imagery is essential for determining valve sizing and the degree of over-sizing required for sub-annular stent placement. The echogenicity highlights the boundaries of the septal endocardium and the valvular apparatus, providing a reference for cardiac anesthesiologists and surgeons during transcatheter or surgical aortic valve replacement evaluations.
echocardiogram diastolic function E wave A wave tissue Doppler
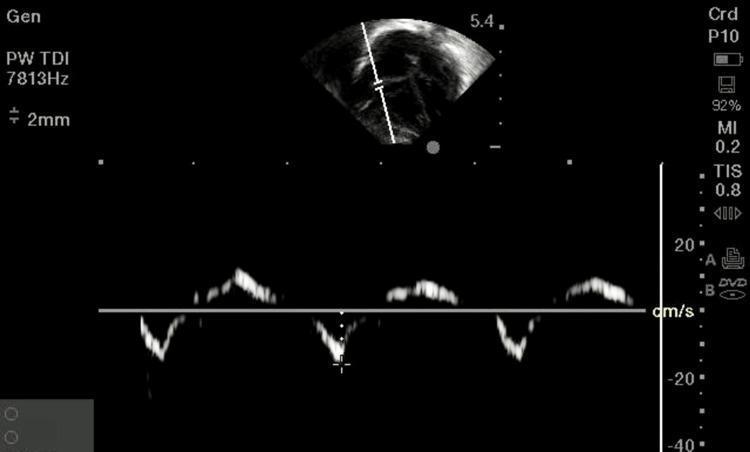
This diagnostic image displays a Pulsed-Wave Tissue Doppler Imaging (PW TDI) echocardiogram used to evaluate right ventricular (RV) diastolic function in a pediatric or neonatal context. The top portion features a 2D grayscale sector view of the heart, with a Doppler cursor and a 2mm sample volume gate positioned at the lateral tricuspid annulus. Below, the spectral Doppler waveform illustrates myocardial velocities over three cardiac cycles. The vertical axis is scaled in cm/s (ranging from +20 to -40), depicting early diastolic (E') and late diastolic (A') velocities. Key technical parameters visible include a Pulse Repetition Frequency (PRF) of 7813 Hz, a Mechanical Index (MI) of 0.2, and a Thermal Index for Soft Tissue (TIS) of 0.8. This modality is essential for quantifying longitudinal myocardial motion and assessing diastolic dysfunction, which is clinically relevant in neonatal conditions such as sepsis, perinatal hypoxia, or meconium aspiration syndrome.
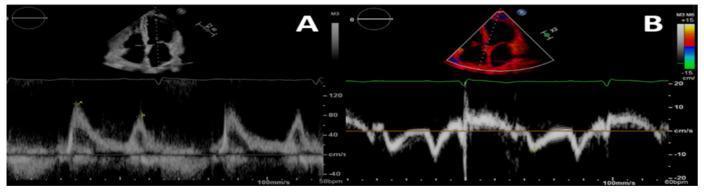
This diagnostic echocardiogram comparison demonstrates two primary modalities used to assess cardiac diastolic function. Panel A features Pulsed-Wave (PW) Doppler imaging of mitral inflow. The top section shows a grayscale B-mode apical four-chamber view, while the bottom section displays a spectral Doppler waveform. The waveform reveals a tall 'E' wave and a smaller 'A' wave, with the E/A ratio and deceleration time suggesting a grade II (pseudonormal) diastolic dysfunction pattern. Panel B displays Tissue Doppler Imaging (TDI) of the left ventricular basal septum. The B-mode image includes a superimposed color Doppler sector highlighting myocardial tissue velocity. The corresponding spectral waveform below shows lower-velocity signals representing myocardial wall motion (s', e', and a' waves). The integration of PW Doppler inflow velocities (E) from Panel A and TDI annular velocities (e') from Panel B allows for the calculation of the E/e' ratio, a critical clinical marker for estimating left ventricular filling pressures in patients with chronic kidney disease (CKD) and suspected uremic cardiomyopathy.
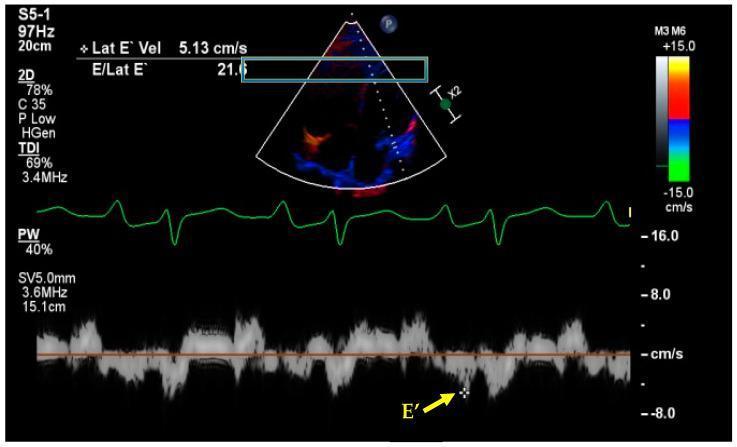
This diagnostic image demonstrates a Tissue Doppler Imaging (TDI) echocardiogram used to assess myocardial velocity and diastolic function. The display is divided into three primary sections: Top: A 2D sector image of the heart (likely an apical four-chamber view) with color-coded Doppler overlays. The color scale on the right indicates flow direction, with red representing movement toward the transducer and blue away. Middle: A simultaneous green electrocardiogram (ECG) tracing providing cardiac cycle synchronization. Bottom: A pulsed-wave (PW) tissue Doppler spectral waveform showing myocardial velocities over time. A yellow arrow identifies the 'E\' peak', which represents the early diastolic mitral annular velocity. Quantitative measurements are overlaid in the upper-left corner, showing a lateral E' velocity (Lat E' Vel) of 5.13 cm/s and an elevated E/Lat E' ratio of 21.6. These findings are clinically significant as an elevated E/E' ratio (typically >14) is a primary indicator of increased left ventricular filling pressures and diastolic dysfunction.
Understanding an Echocardiography (Echo) Report
1. Patient & Study Information
- Patient demographics (name, age, sex, BSA - body surface area)
- Indication for the study (e.g., dyspnea, murmur, pre-op)
- Study type: transthoracic (TTE), transesophageal (TEE), or stress echo
- Image quality (adequate, suboptimal, enhanced with contrast)
2. Left Ventricle (LV) - The Most Critical Section
Systolic Function
| LVEF | Interpretation |
|---|---|
| ≥ 55% | Normal |
| 50-54% | Low-normal |
| 41-49% | HF with mid-range EF (HFmrEF) |
| ≤ 40% | HF with reduced EF (HFrEF) |
| ≤ 35% | ICD threshold (non-ischemic DCM or >40 days post-MI) |
Chamber Dimensions (M-Mode / 2D)
- IVSd - Interventricular septum thickness at diastole (normal: 6-10 mm)
- LVIDd - LV internal diameter at diastole (normal: 42-58 mm in men)
- LVIDs - LV internal diameter at systole
- LVPWd - LV posterior wall thickness at diastole (normal: 6-10 mm)
Wall Motion
- 1 = Normal
- 2 = Hypokinetic (reduced motion)
- 3 = Akinetic (no motion)
- 4 = Dyskinetic (paradoxical motion)
- 5 = Aneurysmal
Global Longitudinal Strain (GLS)
3. Diastolic Function
- E wave - peak early passive mitral inflow velocity
- A wave - peak late atrial contraction velocity
- E/A ratio
- Deceleration time (DT) of E wave
- e' velocity (tissue Doppler at mitral annulus) - reflects myocardial relaxation
- E/e' ratio - estimates LV filling pressures (E/e' > 14 = elevated filling pressures)
- Left Atrial Volume Index (LAVI) - normal < 34 mL/m²
- Tricuspid Regurgitation velocity (TRV)
| Grade | Pattern | Clinical Meaning |
|---|---|---|
| Grade I | Impaired relaxation (E/A < 0.8) | Mild - early diastolic dysfunction |
| Grade II | Pseudonormal (E/A 0.8-2, E/e' 9-14) | Moderate - elevated filling pressures |
| Grade III | Restrictive (E/A > 2, short DT) | Severe - high filling pressures, poor prognosis |
4. Right Ventricle (RV)
| Parameter | Normal |
|---|---|
| RV basal diameter | < 41 mm |
| TAPSE (Tricuspid Annular Plane Systolic Excursion) | > 17 mm |
| RV fractional area change | > 35% |
| RV systolic pressure (RVSP) | Estimated from TR jet |
5. Valvular Assessment
Aortic Valve (AV)
- Peak velocity (normal < 2 m/s; severe AS ≥ 4 m/s)
- Mean gradient (severe AS ≥ 40 mmHg)
- AVA by continuity equation (severe AS < 1.0 cm²)
- Velocity ratio (< 0.25 = severe AS)
Mitral Valve (MV)
- Stenosis: Pressure half-time method → MVA = 220 / T½
- Regurgitation: Vena contracta width, PISA/EROA, regurgitant volume, pulmonary vein flow reversal
Tricuspid and Pulmonic Valves
- TR jet velocity → estimates RVSP (= 4V² + RAP)
- PR jet → estimates PA diastolic pressure
6. Pulmonary Pressures
| Measurement | Formula |
|---|---|
| PA systolic pressure | 4(V_TR)² + RAP |
| PA mean pressure | 4(V_MeanRV-RA)² + RAP |
| PA diastolic pressure | 4(V_PR)² + RAP |
| PVR (Wood units) | 10 × V_TR / VTI_RVOT |
7. Left Atrium (LA) & Right Atrium (RA)
- LA volume index (LAVI): normal < 34 mL/m². Enlarged LA is a marker of chronic diastolic dysfunction and atrial fibrillation.
- LA diameter (M-mode): normal < 40 mm
- RA area: normal < 18 cm²
8. Pericardium
- Pericardial effusion: graded as trivial/small/moderate/large; circumferential vs. loculated
- Tamponade signs: RA systolic collapse, RV diastolic collapse, IVC plethora, respiratory variation in Doppler flows
- Constrictive pericarditis: septal bounce, IVC plethora, annulus reversus on tissue Doppler
9. Aortic Root & Great Vessels
- Adults 18-40 years: 0.97 + (1.12 × BSA)
- Adults >40 years: 1.92 + (0.74 × BSA)
10. Impression / Summary
- Overall LV and RV function
- Valvular diagnoses with severity grading
- Hemodynamic significance
- Changes from prior studies (if serial)
- Recommendation for follow-up or further imaging
Key Clinical Decision Points from Echo Data
| Echo Finding | Clinical Action |
|---|---|
| LVEF ≤ 35%, post-MI or DCM | ICD consideration |
| LVEF ≤ 40% | HFrEF therapy (ACEi, beta-blocker, MRA, SGLT2i) |
| AVA < 1.0 cm², symptoms | Valve replacement |
| Severe AR + LVEF ≤ 55% or ESD > 50 mm | Surgery indicated |
| TR velocity > 2.8 m/s | Pulmonary hypertension work-up |
| LAVI > 34 mL/m² + E/e' > 14 | Elevated LV filling pressures |
- Textbook of Clinical Echocardiography (Otto), 6th Ed.
- Braunwald's Heart Disease, 11th Ed.
- Harrison's Principles of Internal Medicine, 22nd Ed.