
Nationalnutrition policy
- India's NNP was formulated in 1993 by the Department of Women and Child Development
- It aims to reduce malnutrition through direct nutrition interventions and indirect policy measures across multiple sectors
- Key goals include reducing undernutrition, micronutrient deficiencies, and diet-related non-communicable diseases
- It operates alongside programs like ICDS (Integrated Child Development Services), Mid-Day Meal Scheme, and PDS (Public Distribution System)
National Nutrition Policy India 1993 objectives components
https://icds.gov.in/sites/default/files/policies-document/Na…
National Nutrition Policy (NNP) 1993 - India
Background
Strategy of NNP: Two-Track Approach
A. Direct Interventions (Short-term)
- Universal Immunization Programme (UIP)
- Oral Rehydration Therapy (ORT)
- Integrated Child Development Services (ICDS) - to cover all vulnerable children aged 0-6 years
- These have considerable impact on child survival and extreme forms of malnutrition
- Improving growth monitoring for children aged 0-3 years with closer involvement of mothers
- Mothers should be active participants, not passive observers, in the child's nutrition management
- Reaching adolescent girls through ICDS to prepare them for safe motherhood
- Ensuring better coverage of pregnant women to reduce the incidence of low birth weight babies
- Fortifying staple foods (e.g., iodized salt, vitamin A-fortified oil, iron-fortified foods)
- Promoting affordable, locally available nutritious food options
- Targeting vulnerable groups for deficiencies of iron, iodine, vitamin A
B. Indirect Policy Instruments (Long-term)
| # | Instrument |
|---|---|
| 1 | Food Security - Per capita availability of 215 kg/person/year of food grain |
| 2 | Improvement of dietary pattern through production and demonstration |
| 3 | Improving purchasing power of urban and rural poor + strengthening Public Distribution System (PDS) |
| 4 | Land reforms |
| 5 | Health and family welfare |
| 6 | Basic health and nutrition knowledge (nutrition education) |
| 7 | Prevention of food adulteration |
| 8 | Nutrition surveillance |
| 9 | Monitoring of nutrition programmes |
| 10 | Research into consumption-side and supply-side aspects of nutrition |
| 11 | Equal remuneration for women (enforcement of Equal Remuneration Act) |
| 12 | Communication through established media for policy implementation |
| 13 | Minimum wage administration |
| 14 | Community participation |
| 15 | Education and literacy - particularly of women |
| 16 | Improvement of the status of women |
Implementation Structure
- National Nutrition Council: Constituted in the Planning Commission with the Prime Minister as President; includes concerned Union Ministers, State Ministers (by rotation), experts, NGO representatives, and grassroots leaders (especially women)
- Inter-Ministerial Coordination Committee: All ministries whose activities influence nutritional status are represented
- State Governments & UTs: Effective implementation largely depends on State-level action
- NGOs, Cooperatives, Local Bodies (Panchayat and Municipal): Mobilize community resources to ensure sustainability
Key Associated Programmes
| Programme | Ministry |
|---|---|
| Vitamin A Prophylaxis Programme | Health and Family Welfare |
| Prophylaxis against Nutritional Anaemia | Health and Family Welfare |
| Iodine Deficiency Disorders (IDD) Control | Health and Family Welfare |
| ICDS | Women and Child Development |
| Mid-Day Meal Scheme | Human Resource Development |
| Public Distribution System (PDS) | Consumer Affairs, Food and Public Distribution |
Recent Extension: Anaemia Mukt Bharat Strategy
- Prophylactic iron and folic acid (IFA) supplementation
- Deworming
- Behaviour change communication (compliance with IFA, IYCF practices, iron-rich diet, delayed cord clamping)
- Testing and treatment of anaemia using digital/point-of-care methods
- Mandatory IFA-fortified foods in government-funded programmes
- Screening and treatment of non-nutritional anaemia (malaria, haemoglobinopathies, fluorosis)
Key Points to Remember (Exam-Focused)
- NNP adopted in 1993 by Dept. of Women & Child Development
- Multi-sectoral, dual-track strategy: direct (short-term) + indirect (long-term)
- Target: reduce severe/moderate malnutrition by half by year 2000 AD
- Food security target: 215 kg/person/year of food grain
- Special emphasis on women and children as most vulnerable groups
- Implementation backed by National Nutrition Council (PM as President)
Create a comparison chart of Direct vs Indirect NNP interventions
A clean, professional comparison chart titled "National Nutrition Policy 1993 - Direct vs Indirect Interventions". Two-column layout with a bold header row. Left column header: "Direct Interventions (Short-Term)" with a green color theme. Right column header: "Indirect Policy Instruments (Long-Term)" with a blue color theme. Left column rows: 1. Expanding the Safety Net - UIP, ORT, ICDS for children 0-6 yrs 2. Growth Monitoring - Children 0-3 yrs with active mother involvement 3. Adolescent Girls - Through ICDS for safe motherhood preparedness 4. Expectant Women - Coverage to reduce low birth weight babies 5. Fortification of Essential Foods - Iodized salt, Vitamin A, Iron 6. Low-Cost Nutritious Food - Popularization of affordable options 7. Micronutrient Deficiency Control - Iron, Iodine, Vitamin A for vulnerable groups Right column rows: 1. Food Security - 215 kg/person/year food grain availability 2. Dietary Pattern Improvement - Production and demonstration 3. Purchasing Power - Poverty alleviation + strengthen PDS 4. Land Reforms 5. Health and Family Welfare 6. Nutrition Knowledge - Health and nutrition education 7. Prevention of Food Adulteration 8. Nutrition Surveillance and Monitoring 9. Research - Supply side and consumption side 10. Equal Remuneration for Women 11. Media Communication for policy 12. Minimum Wage Administration 13. Community Participation 14. Education and Literacy - Especially women 15. Improvement of Status of Women Bottom note: "Target Groups: Women, Children, Adolescent Girls, Pregnant & Lactating Mothers" Include a small government of India emblem style icon at the top. Clean medical/public health infographic style with clear fonts and organized layout.
Epidemological apporioches
epidemiological approaches types descriptive analytical experimental study designs
Epidemiological Approaches
The Epidemiological Approach (Park's Framework)
1. Asking Questions
- What is the event (the problem)?
- What is its magnitude?
- Where did it happen?
- When did it happen?
- Who are affected?
- Why did it happen?
- What can be done to reduce the problem?
- How can it be prevented in the future?
- What action should the community / health services / other sectors take?
- What resources are required and how should activities be organized?
2. Making Comparisons
- Comparability: "Like compared with like" - groups must be similar in age, sex, and other pertinent variables
- Randomization: Best method to ensure comparability (used in trials)
- Matching: Used when randomization is not possible (case-control, cohort)
- Standardization: Usually limited to age, sex, parity
Classification of Epidemiological Study Designs
EPIDEMIOLOGICAL STUDIES
├── OBSERVATIONAL (No intervention by researcher)
│   ├── Descriptive
│   │   ├── Case reports / Case series
│   │   ├── Cross-sectional (Prevalence) surveys
│   │   └── Ecological / Correlational studies
│   └── Analytical
│       ├── Case-Control (Retrospective)
│       └── Cohort (Prospective / Retrospective)
└── EXPERIMENTAL (Researcher intervenes)
    ├── Randomized Controlled Trials (RCTs)
    ├── Community / Field Trials
    └── Quasi-experimental studies
A. Descriptive Epidemiology
| Variable | Questions Asked |
|---|---|
| Person | Who is affected? Age, sex, race, occupation, SES, habits |
| Place | Where? Urban/rural, geographic distribution, clustering |
| Time | When? Secular trends, seasonal variation, epidemic curves |
- Case reports / Case series: Describe individual or small cluster of cases; no control group; useful for rare/new diseases
- Cross-sectional study: Measures disease prevalence and exposure simultaneously in a population at a single point in time; gives prevalence rates; cannot establish causality
- Ecological study: Uses group-level (population) data; unit of analysis is a population, not an individual; subject to ecological fallacy
B. Analytical Epidemiology
1. Case-Control Study (Retrospective)
- Also called retrospective study
- Starts with outcome (disease) and looks backward for exposure
- Compares cases (with disease) vs. controls (without disease)
- Measures: Odds Ratio (OR)
- Both exposure and outcome have already occurred before the study starts
- Study proceeds backwards - from effect to cause
- Uses a control/comparison group
- Selection of cases (clear diagnostic criteria)
- Selection of controls (comparable - matched for confounders like age, sex)
- Measurement of exposure (interviews, records, questionnaires)
- Analysis - calculate exposure rates in cases vs. controls, then Odds Ratio
2. Cohort Study (Prospective / Follow-up)
- Also called prospective study (when looking forward) or longitudinal study
- Starts with exposure status and follows forward to see who develops disease
- Compares exposed vs. unexposed groups
- Measures: Relative Risk (RR) / Incidence Rate Ratio
- Prospective cohort: Follow people forward in time from now
- Retrospective (historical) cohort: Uses past records to construct a cohort and follow to the present
- Define the cohort (exposed and non-exposed groups)
- Ensure cohort is free of the disease at start
- Follow up over time
- Compare incidence rates in exposed vs. unexposed
C. Experimental Epidemiology
1. Randomized Controlled Trial (RCT)
- Gold standard for evaluating interventions
- Participants randomly allocated to intervention or control group
- Double-blind (neither participant nor researcher knows allocation) eliminates bias
- Measures: Relative Risk Reduction, Absolute Risk Reduction, NNT
2. Field Trial
- Conducted in the community (not hospital)
- Used when studying healthy people at risk (e.g., vaccine trials)
- Example: Salk polio vaccine trial
3. Community Trial
- Unit of allocation is the community, not the individual
- Used for interventions targeting community-wide risk factors
- Example: Water fluoridation studies
Comparison: Key Epidemiological Study Designs
| Feature | Case-Control | Cohort | RCT |
|---|---|---|---|
| Direction | Backward (retrospective) | Forward (prospective) | Forward |
| Starting point | Outcome (disease) | Exposure | Randomization |
| Measure of association | Odds Ratio (OR) | Relative Risk (RR) | RR / NNT |
| Incidence calculable? | No | Yes | Yes |
| Best for | Rare diseases | Rare exposures | Intervention evaluation |
| Time & cost | Low | High | High |
| Bias risk | Recall bias | Loss to follow-up | Lowest |
| Evidence level | Moderate | Moderate-high | Highest |
Epidemiological Triad (Agent-Host-Environment)
- Agent: Cause of disease (bacteria, virus, chemical, nutritional deficiency)
- Host: The human/animal harbouring the disease (immunity, genetics, age, sex)
- Environment: Biological, social, cultural, physical surroundings
- Time: Incubation period, duration, epidemic threshold
Measurements in Epidemiology
| Measurement Type | Examples |
|---|---|
| Mortality | CMR, IMR, CFR |
| Morbidity | Incidence, Prevalence, Attack rate |
| Disability | DALY, YLD |
| Natality | Birth rate, TFR |
| Risk measures | OR, RR, AR, PAR |
| Tools | Rates, Ratios, Proportions |
Make a visual diagram showing the epidemiological triad and its components
A clean medical education diagram of the Epidemiological Triad. Central equilateral triangle with three corners labeled: top corner "AGENT" in red, bottom-left corner "HOST" in blue, bottom-right corner "ENVIRONMENT" in green. The word "TIME" is written in the center of the triangle in purple/dark color. Each corner has a detailed bullet-point box with components: AGENT (top, red box): - Biological: bacteria, viruses, parasites, fungi - Chemical: toxins, drugs, pollutants - Physical: radiation, heat, trauma - Nutritional: deficiencies, excesses - Infectivity, Pathogenicity, Virulence HOST (bottom-left, blue box): - Age, Sex, Race - Genetic makeup - Immunity status - Nutritional status - Occupation, habits - Physiological state ENVIRONMENT (bottom-right, green box): - Biological: vectors, reservoirs - Physical: climate, geography, sanitation - Social: culture, socioeconomic status - Psychological: stress, lifestyle TIME (center, purple): - Incubation period - Duration of illness - Epidemic threshold - Seasonal variation The three sides of the triangle have bidirectional arrows labeled: - Left side: "Agent-Host Interaction" - Right side: "Host-Environment Interaction" - Bottom: "Agent-Environment Interaction" Title at top: "EPIDEMIOLOGICAL TRIAD" in bold dark font Subtitle: "Model of Disease Causation" Footer note: "Disease occurs when Agent overcomes Host resistance in a favorable Environment" Clean white background, professional medical infographic style, color-coded sections, modern flat design.
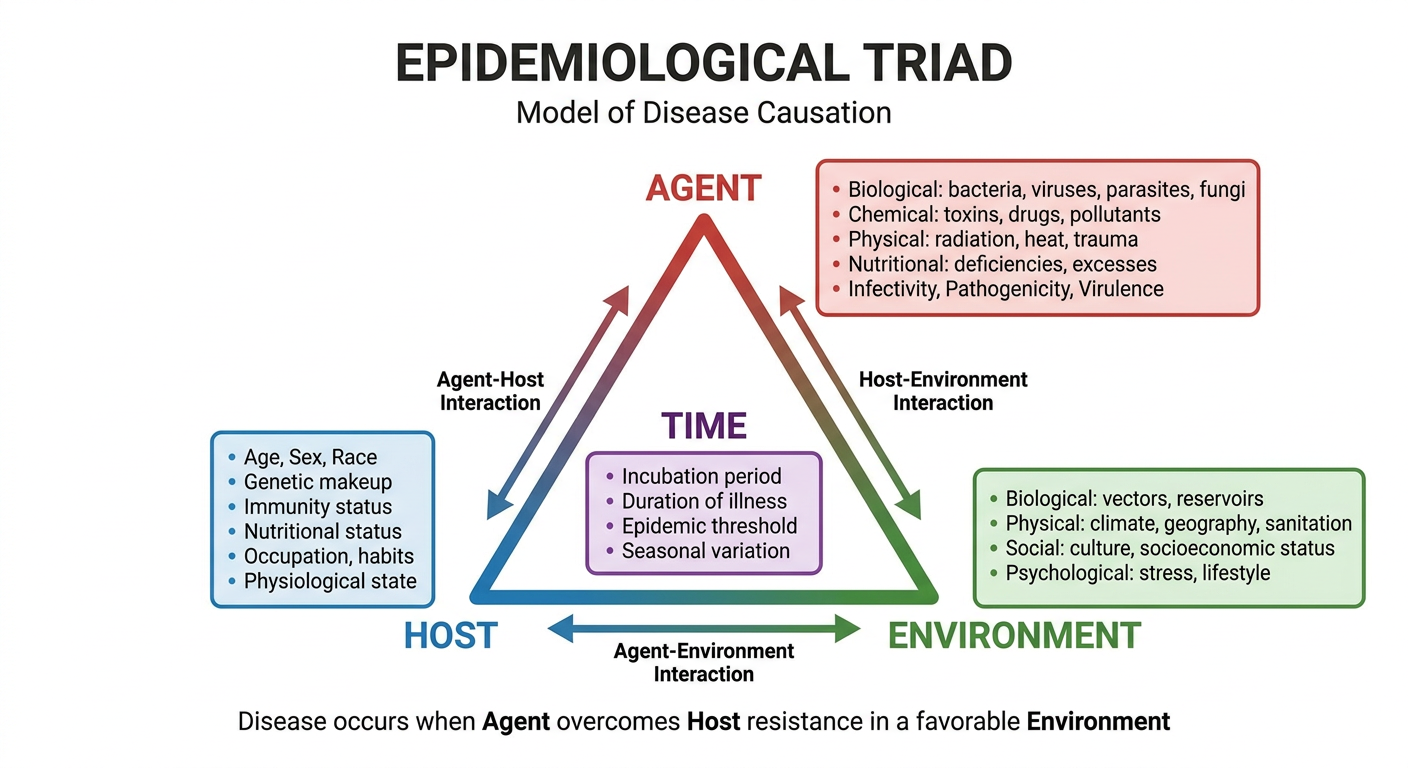
- AGENT (red) - the causative factor: biological, chemical, physical, or nutritional
- HOST (blue) - the susceptible human: age, immunity, genetics, habits
- ENVIRONMENT (green) - external conditions: biological, physical, social, psychological
- TIME (center) - cuts across all three: incubation period, seasonal trends, epidemic duration