Suggest me 10 abnornal ecg with images
Reading File
Finding Sources
Finding Sources
Finding Sources
Finding Sources
Reading File
Reading File
Finding Sources
Finding Sources
Reading File
Reading File
Finding Sources
Finding Sources
Reading File
Reading File
Reading File
Reading File
Reading File
Reading File
I now have all the images and descriptions needed. Let me compile the comprehensive answer with 10 abnormal ECGs with real textbook images.
10 Abnormal ECG Patterns with Images
Here are 10 classic abnormal ECG patterns drawn from authoritative medical textbooks, each with a real ECG tracing image.
1. Inferior STEMI (Right Coronary Artery Occlusion)
Key features: ST-segment elevation in leads III > II, ST-segment depression in leads I and aVL ("reciprocal changes"). This pattern points to 100% occlusion of the right coronary artery.
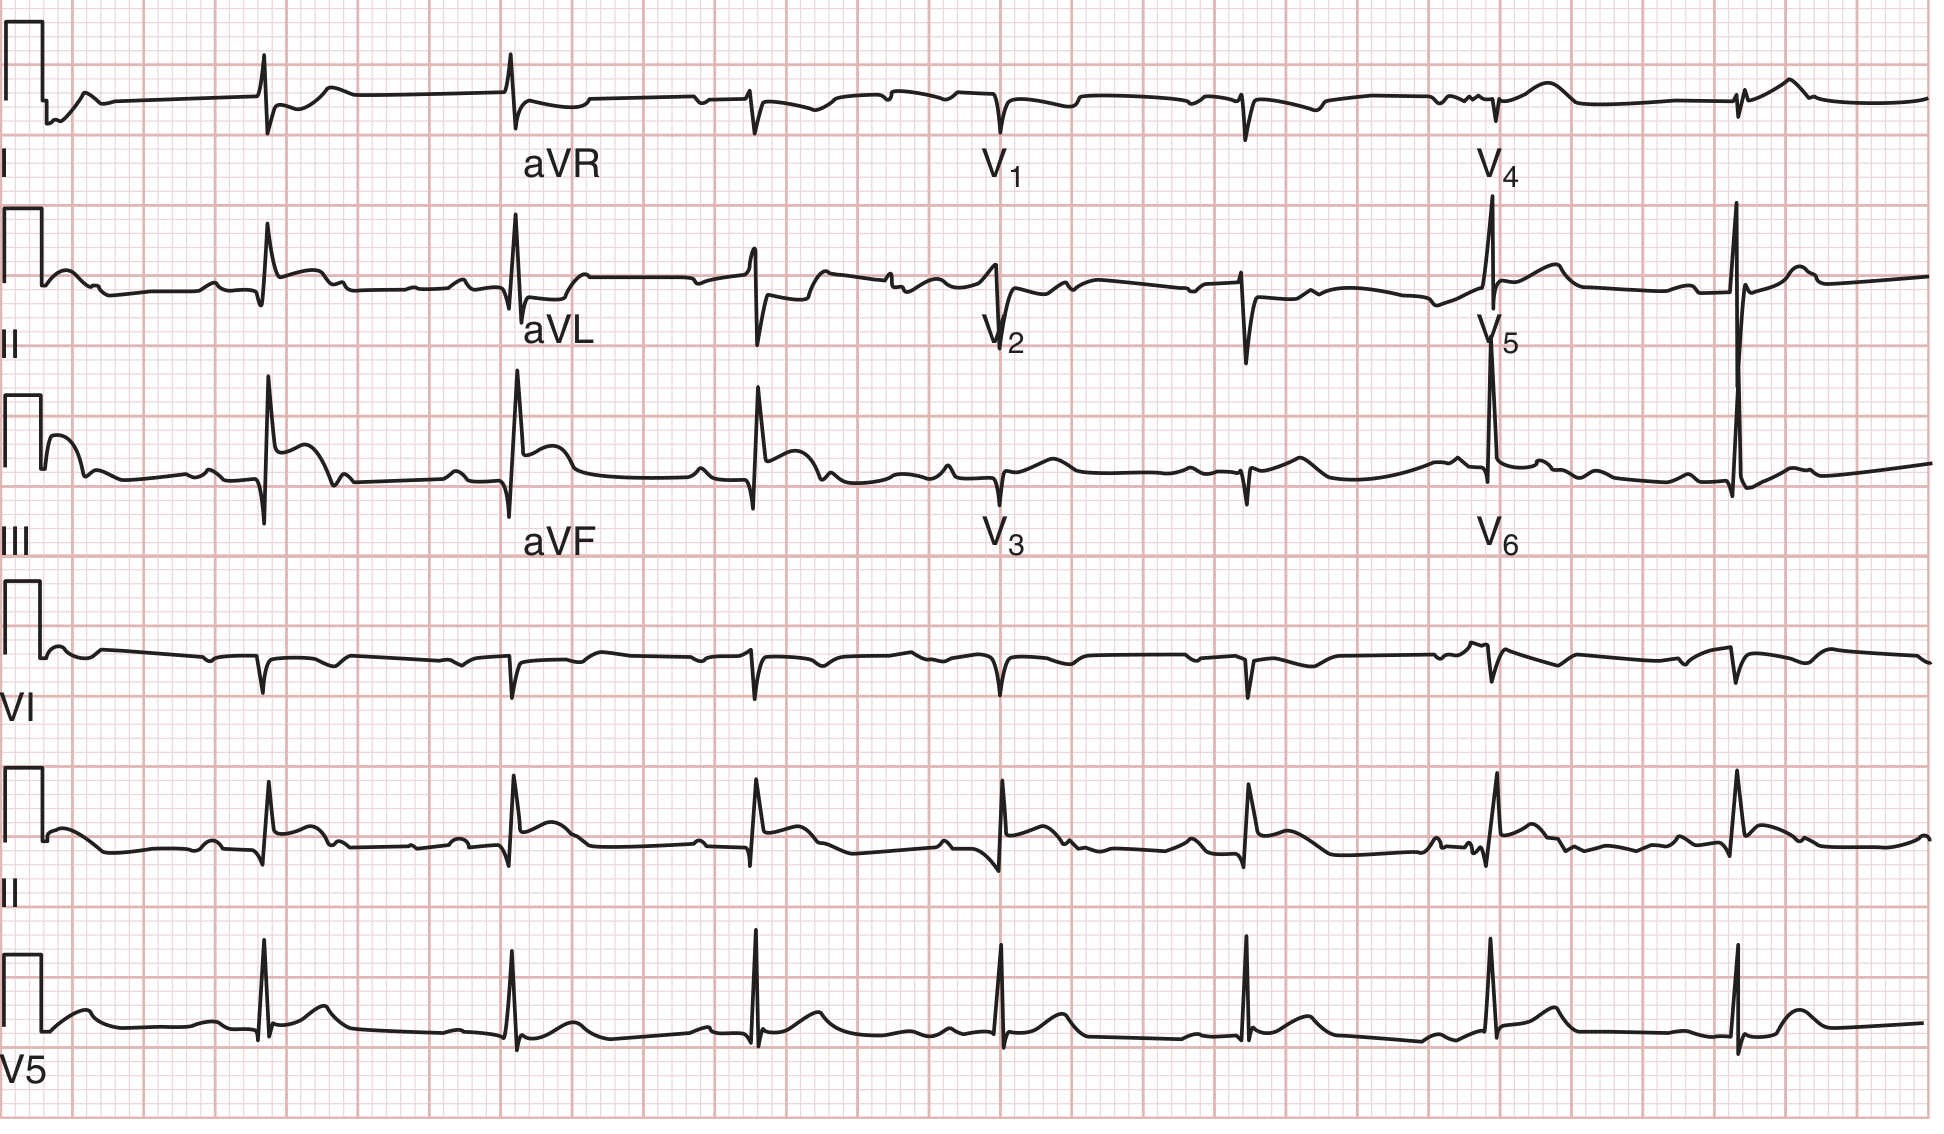
ECG from an 80-year-old man with acute chest pain showing inferior MI from right coronary artery occlusion. - Tintinalli's Emergency Medicine
2. Anterior STEMI (Left Anterior Descending Artery Occlusion)
Key features: ST-segment elevation in leads I, V1, V2, and V3 without reciprocal ST depression in II, III, and aVF. Caused by occlusion of the distal left anterior descending coronary artery.
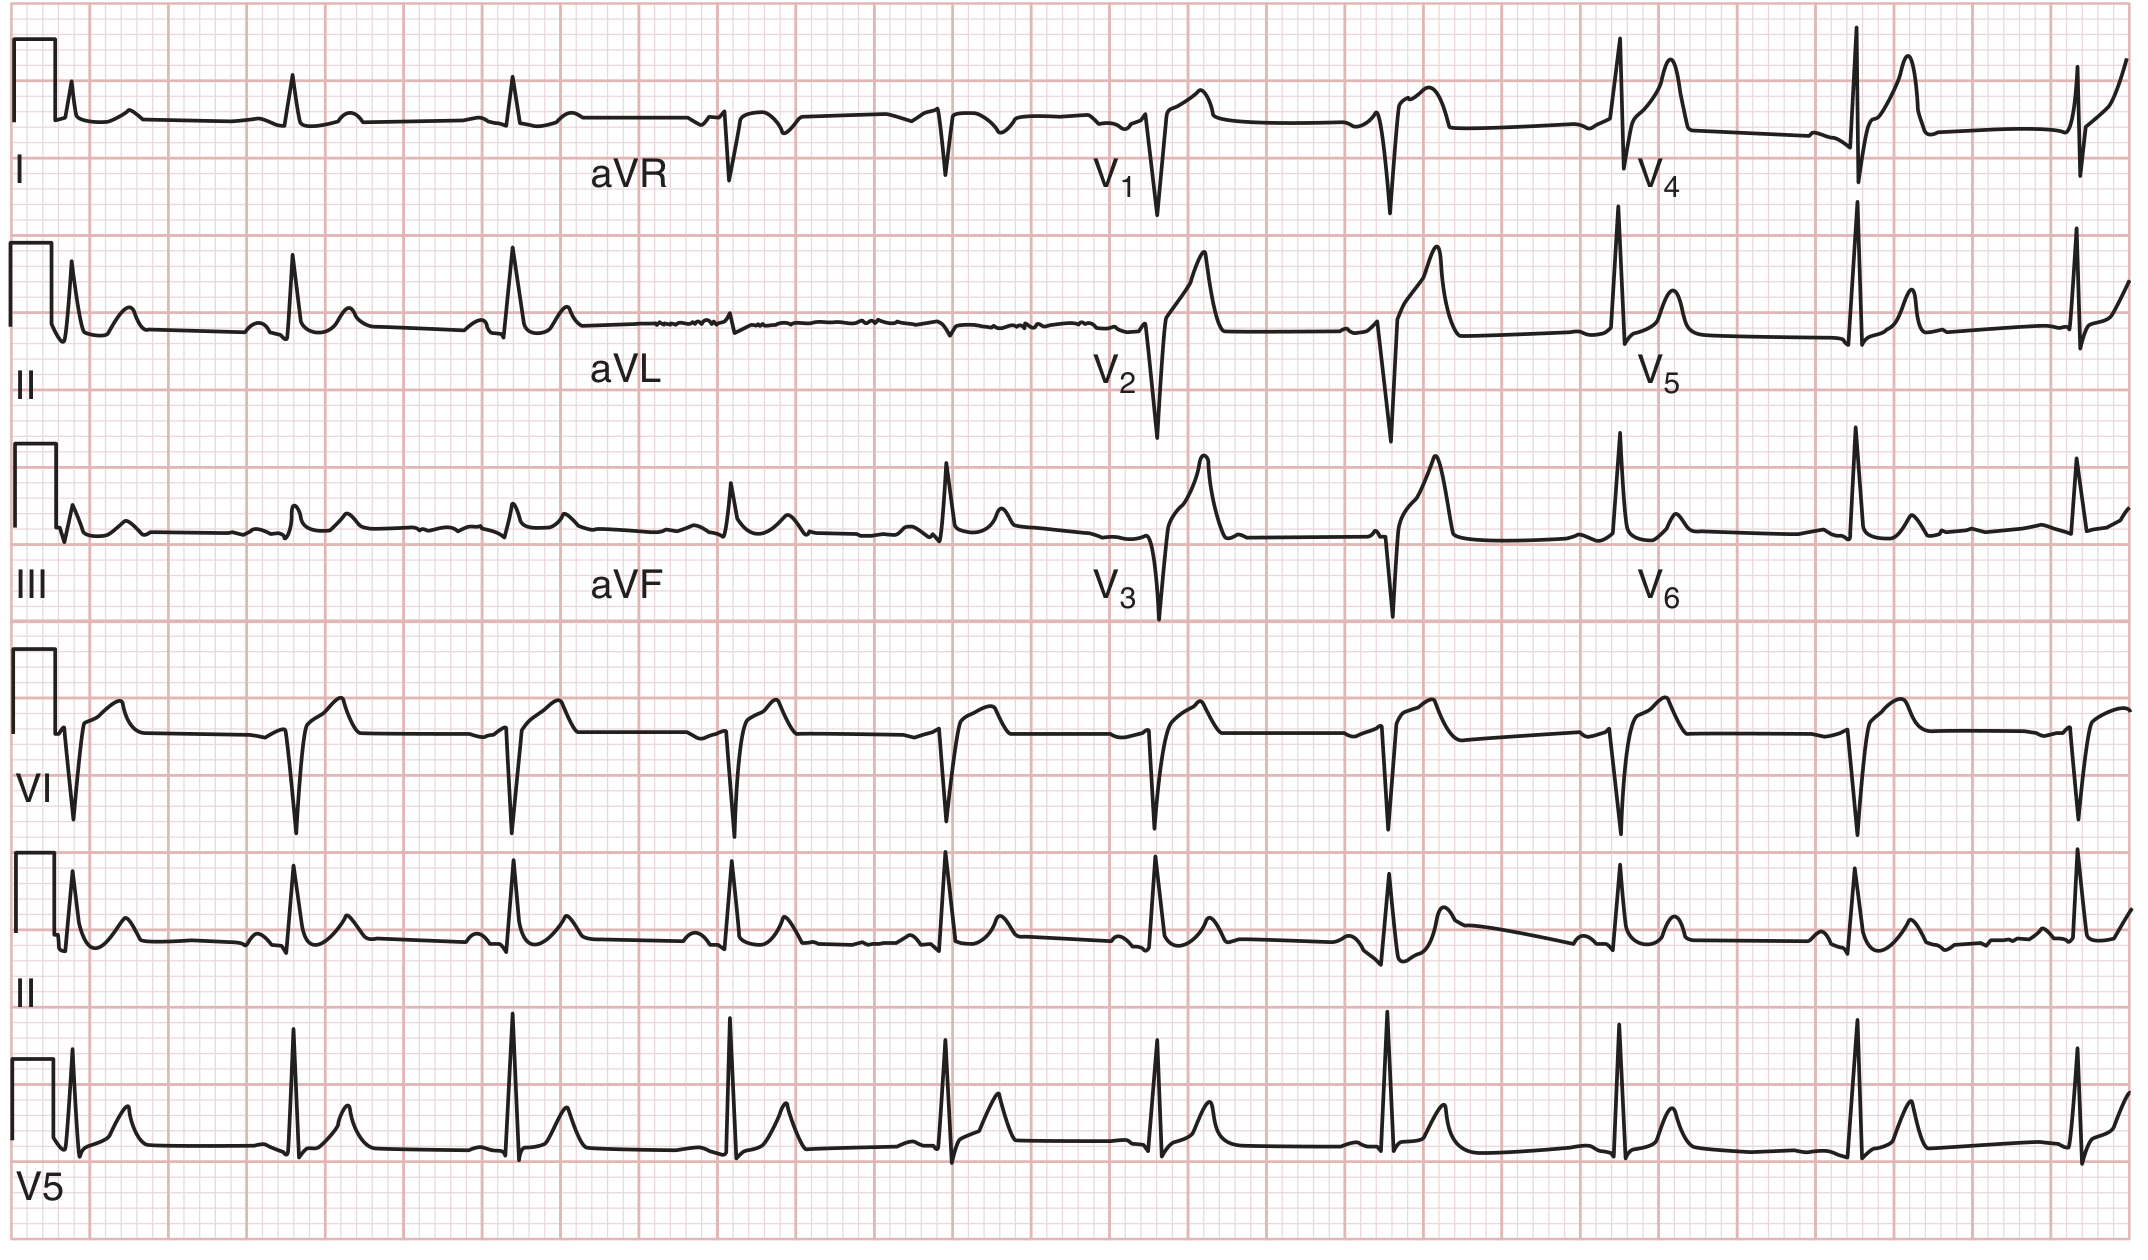
ECG from a 52-year-old man with chest pain showing anterior MI from distal LAD occlusion. - Tintinalli's Emergency Medicine
3. Right Ventricular Infarction
Key features: ST-elevation in inferior leads PLUS ST-elevation in right precordial leads (V3R, V4R, V5R). A critical finding because nitrates and diuretics are contraindicated.
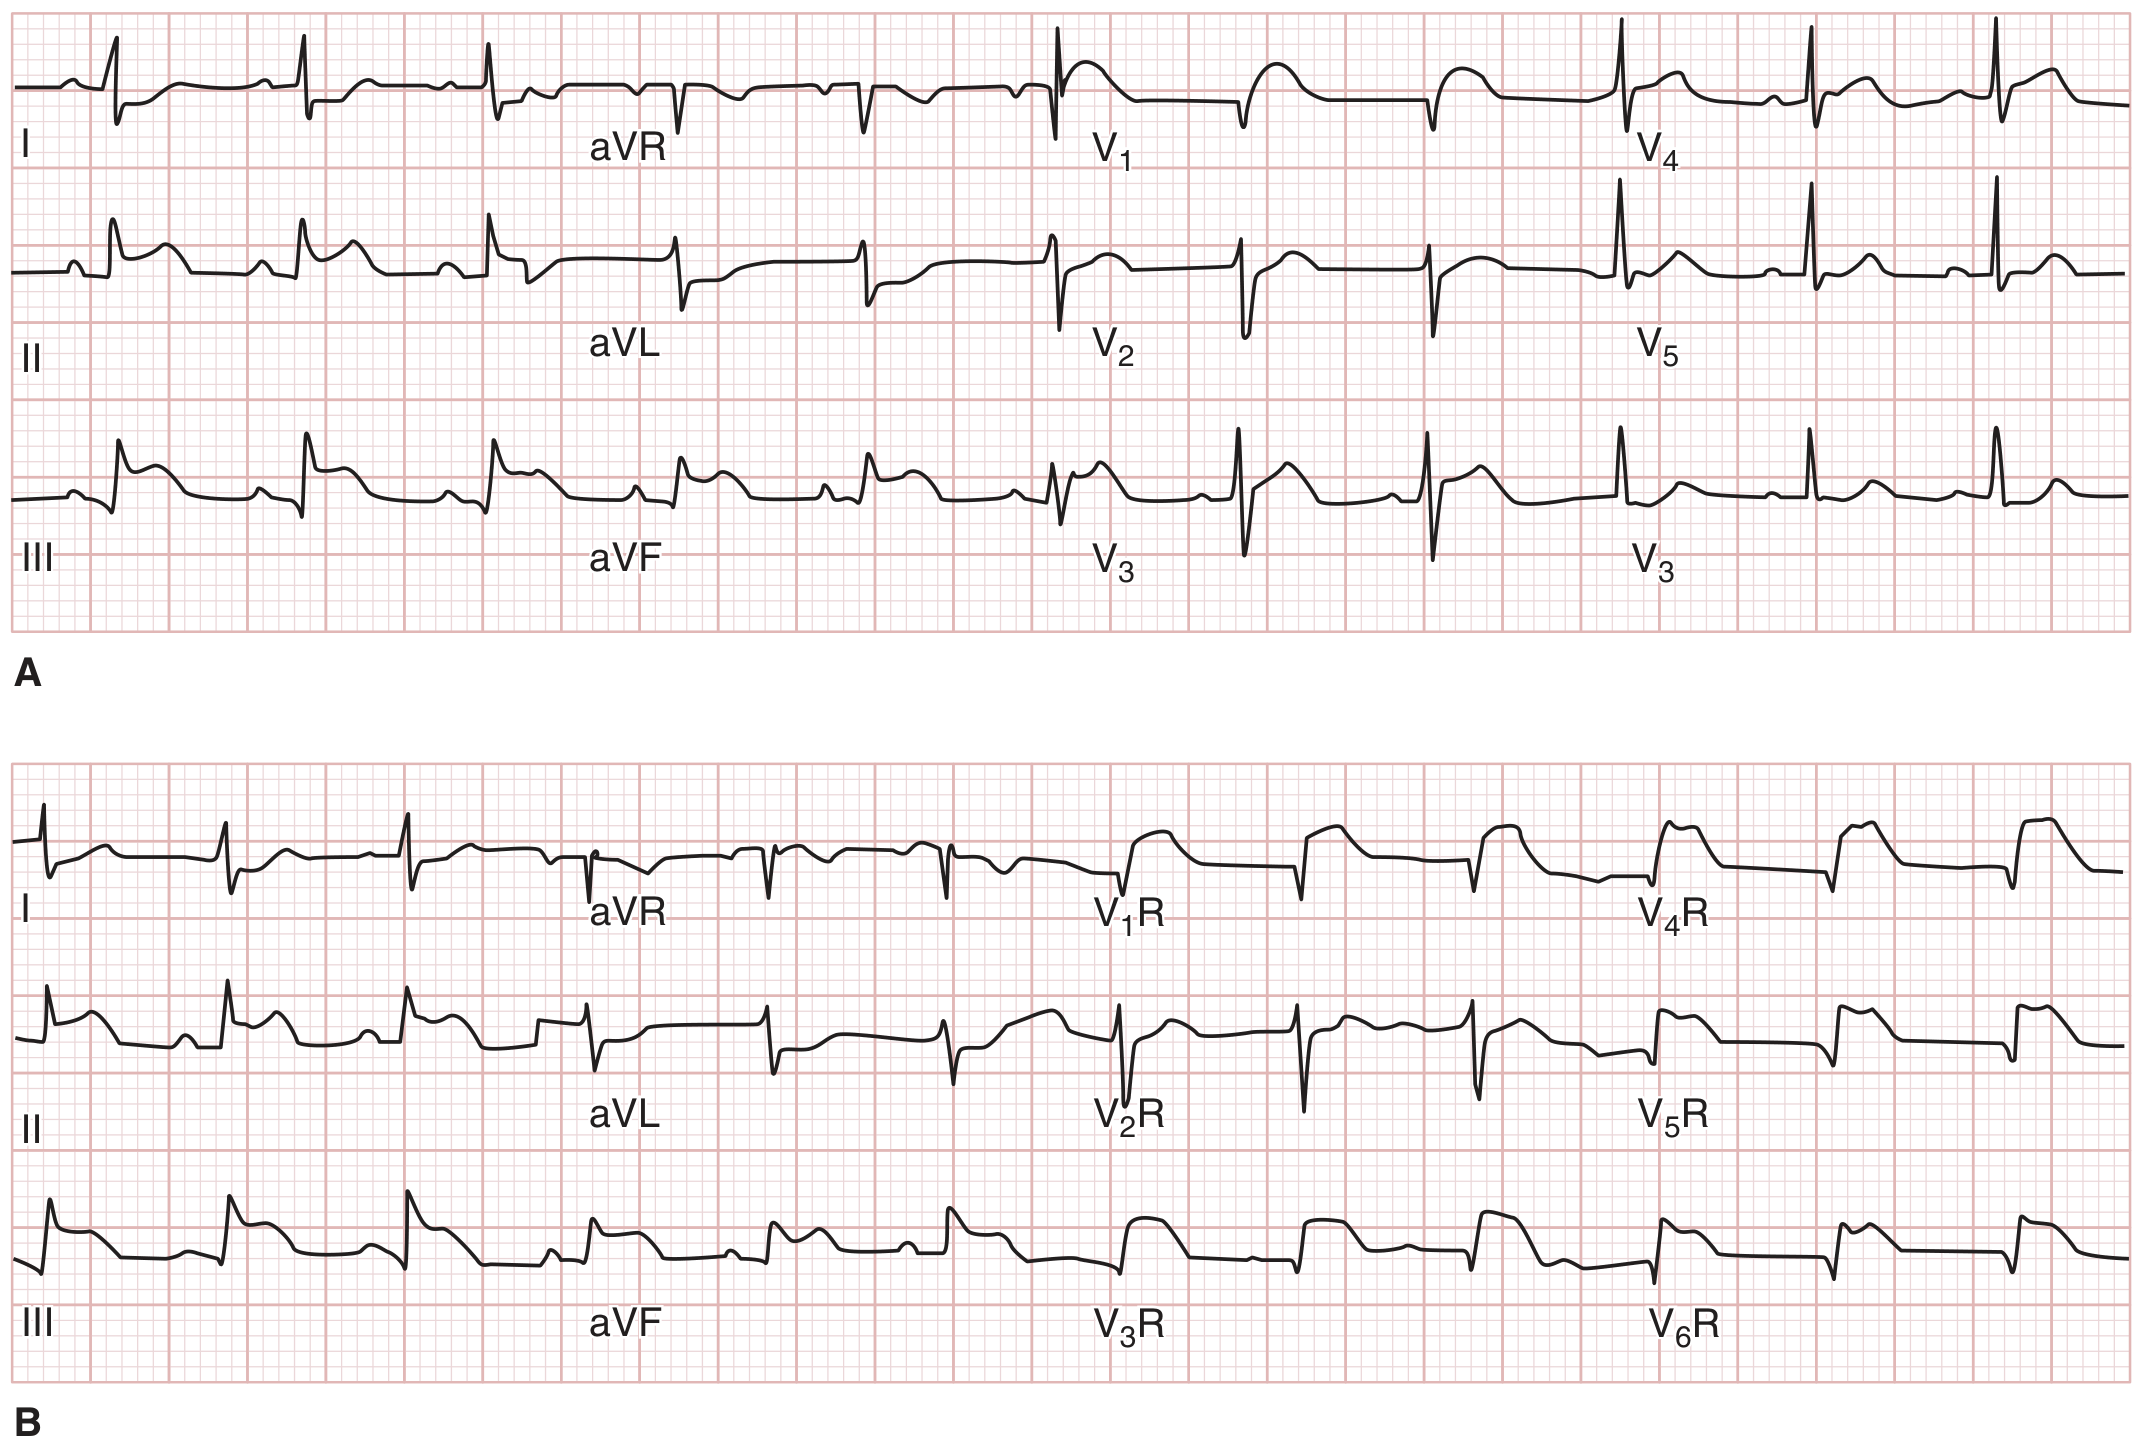
Inferior STEMI with right ventricular infarction confirmed by right-sided precordial leads. - Tintinalli's Emergency Medicine
4. Left Bundle Branch Block (LBBB) with Concordant ST Changes
Key features: Wide QRS with discordant ST changes (normal in LBBB). Concordant ST elevation (same direction as QRS) is strongly suggestive of acute MI in the setting of LBBB.
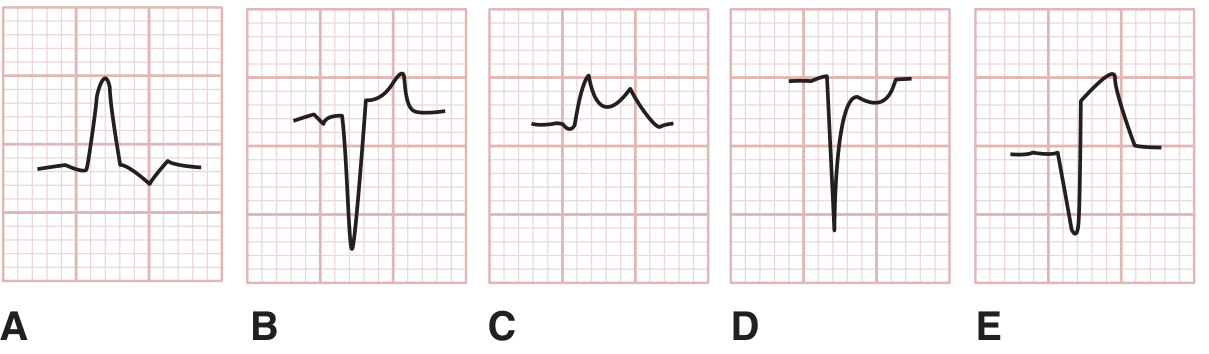
ST-segment abnormalities in LBBB. A=discordant depression (normal). B=discordant elevation (normal). C=concordant elevation (strongly suggestive of AMI). D=concordant depression (suggestive of AMI). E=excessive discordant elevation. - Tintinalli's Emergency Medicine
5. Atrial Fibrillation (AF)
Key features: Irregularly irregular RR intervals, no discernible P waves (replaced by fine fibrillatory baseline), and normal QRS morphology (unless aberrant conduction). Ventricular rate typically 125-150 bpm.
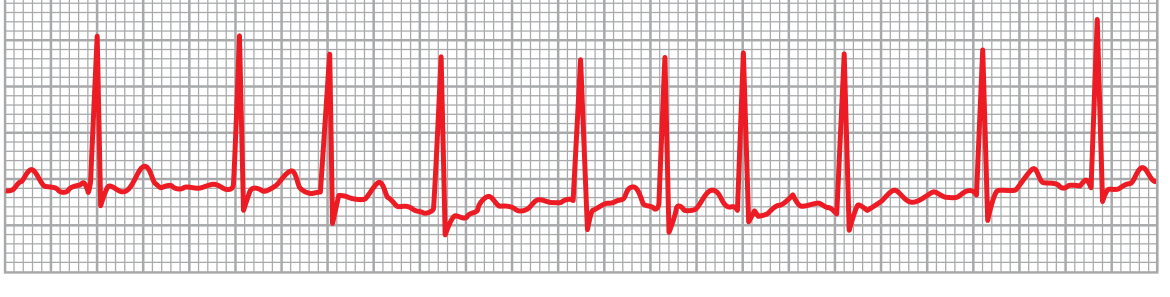
Atrial fibrillation (lead II). Only ventricular QRS and T waves are visible - no P waves. - Guyton & Hall Textbook of Medical Physiology
6. Atrial Flutter
Key features: Classic "sawtooth" flutter waves (F waves) at 250-350 bpm, with a fixed conduction ratio (typically 2:1 or 4:1) producing a ventricular rate of ~125-175 bpm. P waves are strong because semicoordinated atrial muscle masses are contracting.
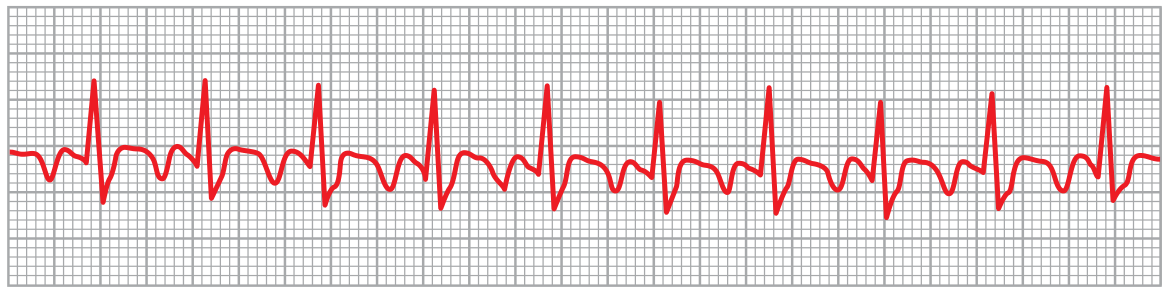
Atrial flutter at 250 bpm with 2:1 AV conduction giving ventricular rate of 125 bpm (lead II). - Guyton & Hall Textbook of Medical Physiology
7. Wolff-Parkinson-White (WPW) Syndrome
Key features: Short PR interval (<0.12 s), widened QRS with a slurred delta wave at the upstroke, and a secondary T-wave change. Caused by an accessory pathway (Bundle of Kent) bypassing the AV node.
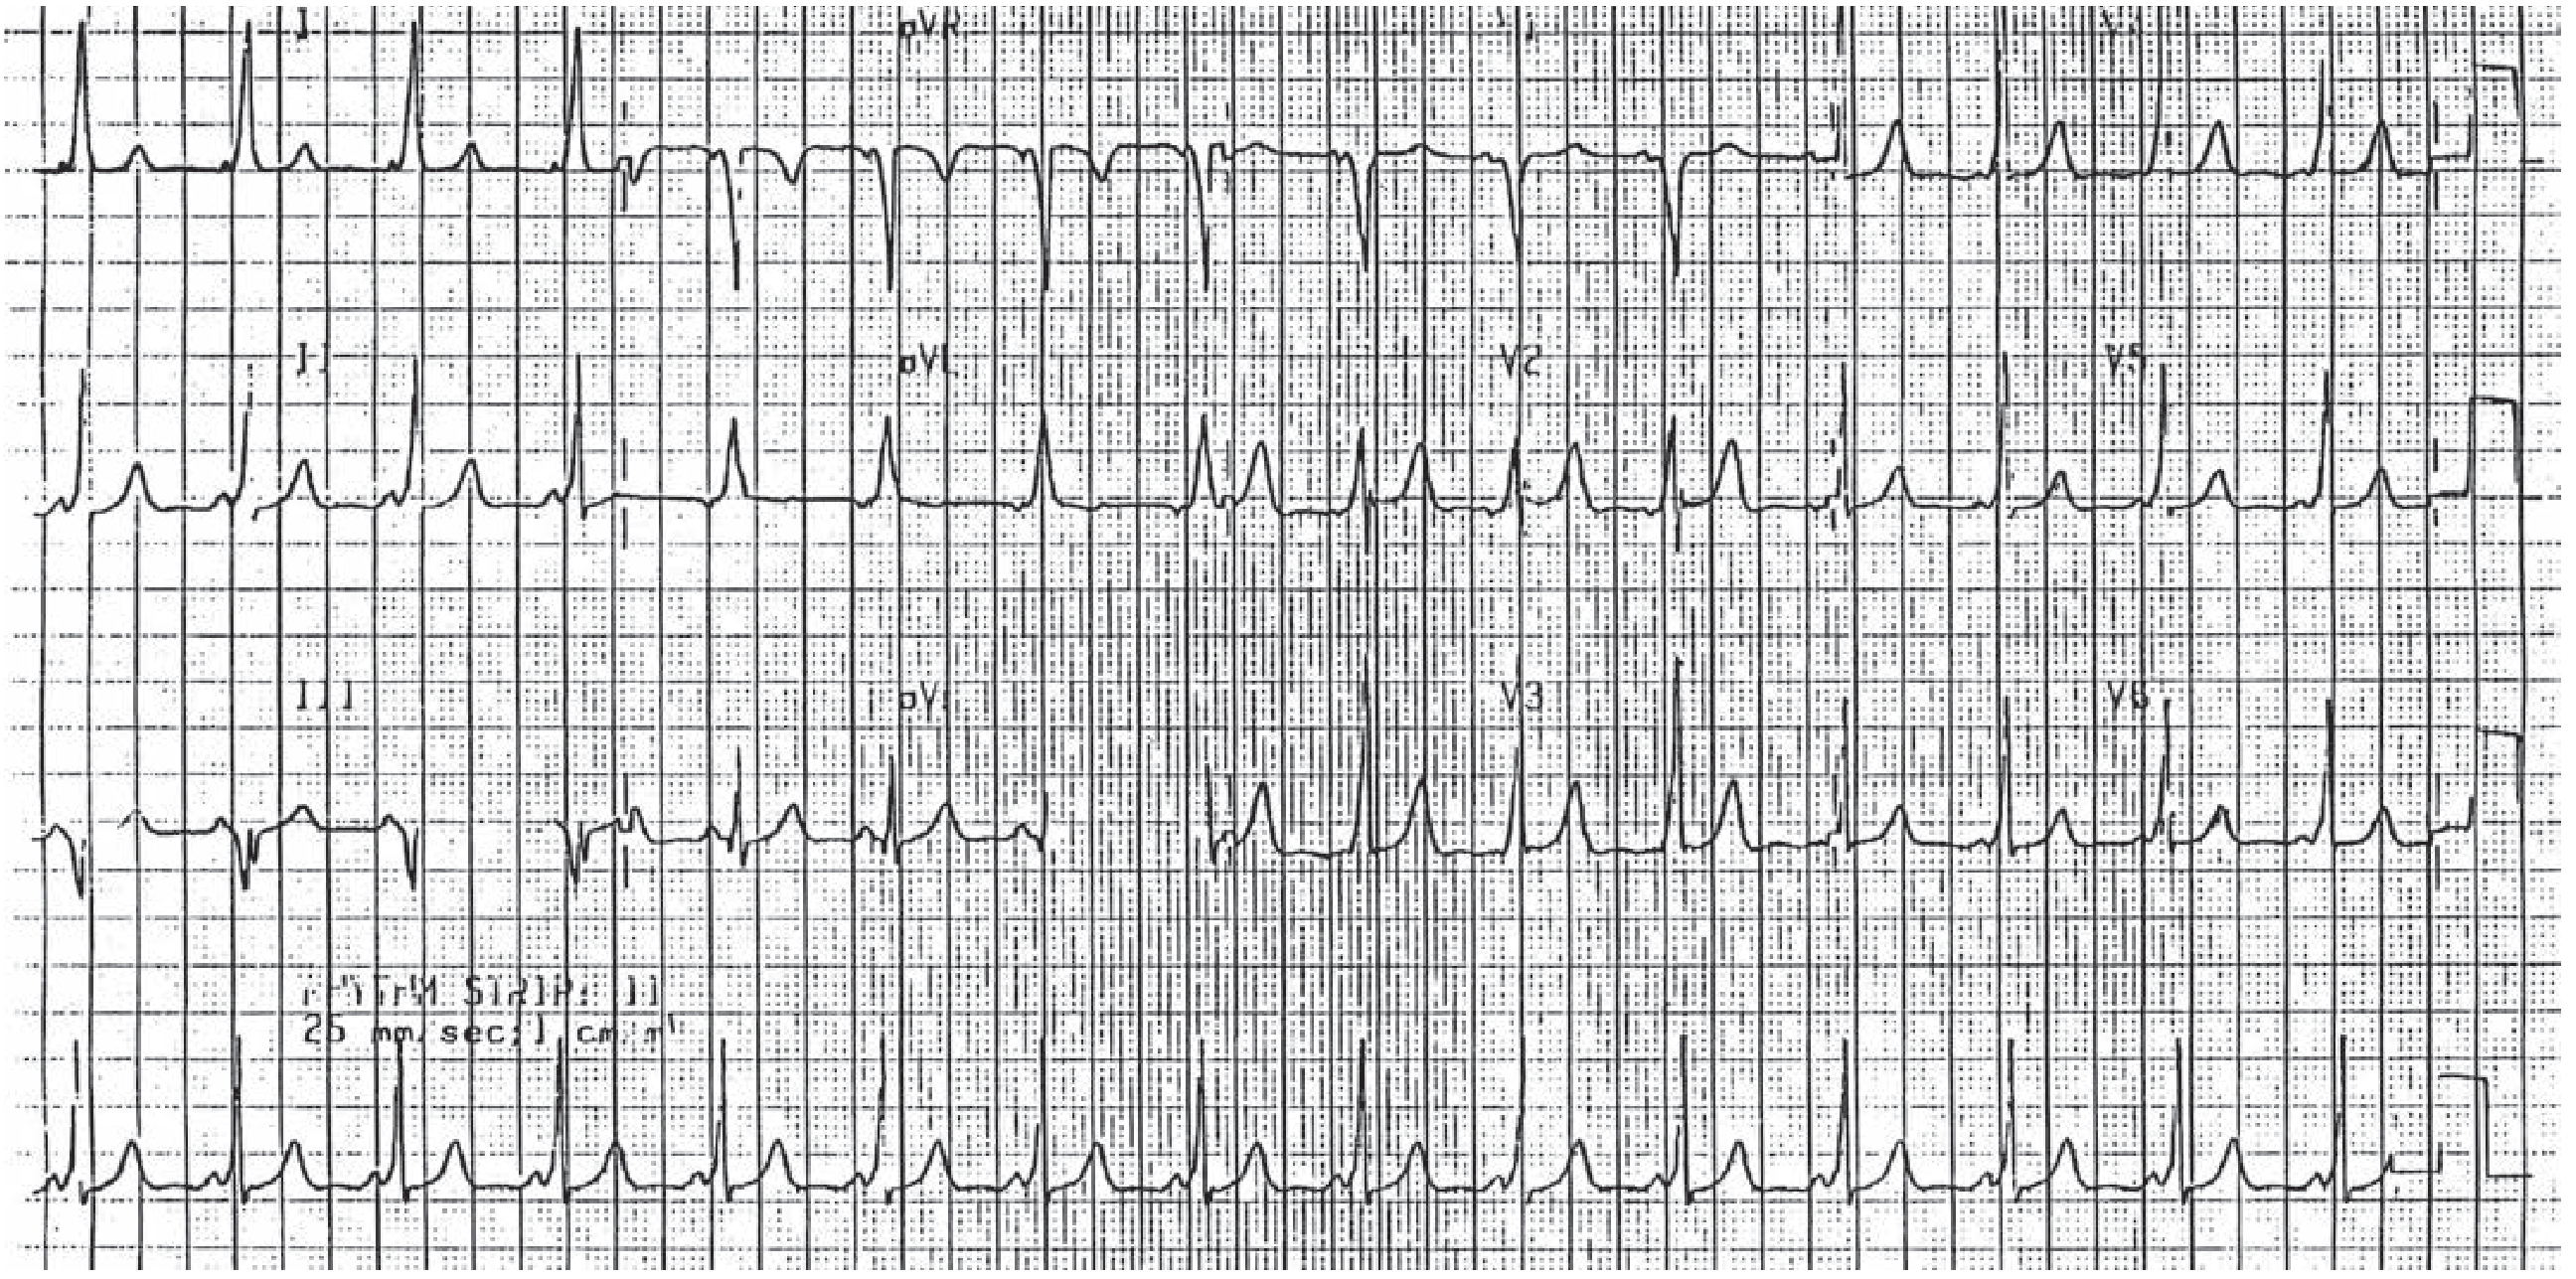
Wolff-Parkinson-White syndrome: short PR interval and widened QRS with delta waves. - Tintinalli's Emergency Medicine
8. Complete (Third-Degree) AV Heart Block
Key features: Complete dissociation between atrial (P waves) and ventricular (QRS) activity. P waves march through regularly at their own rate; QRS complexes are regular but at a much slower escape rate (<40 bpm). The atrial rate is faster than the ventricular rate.
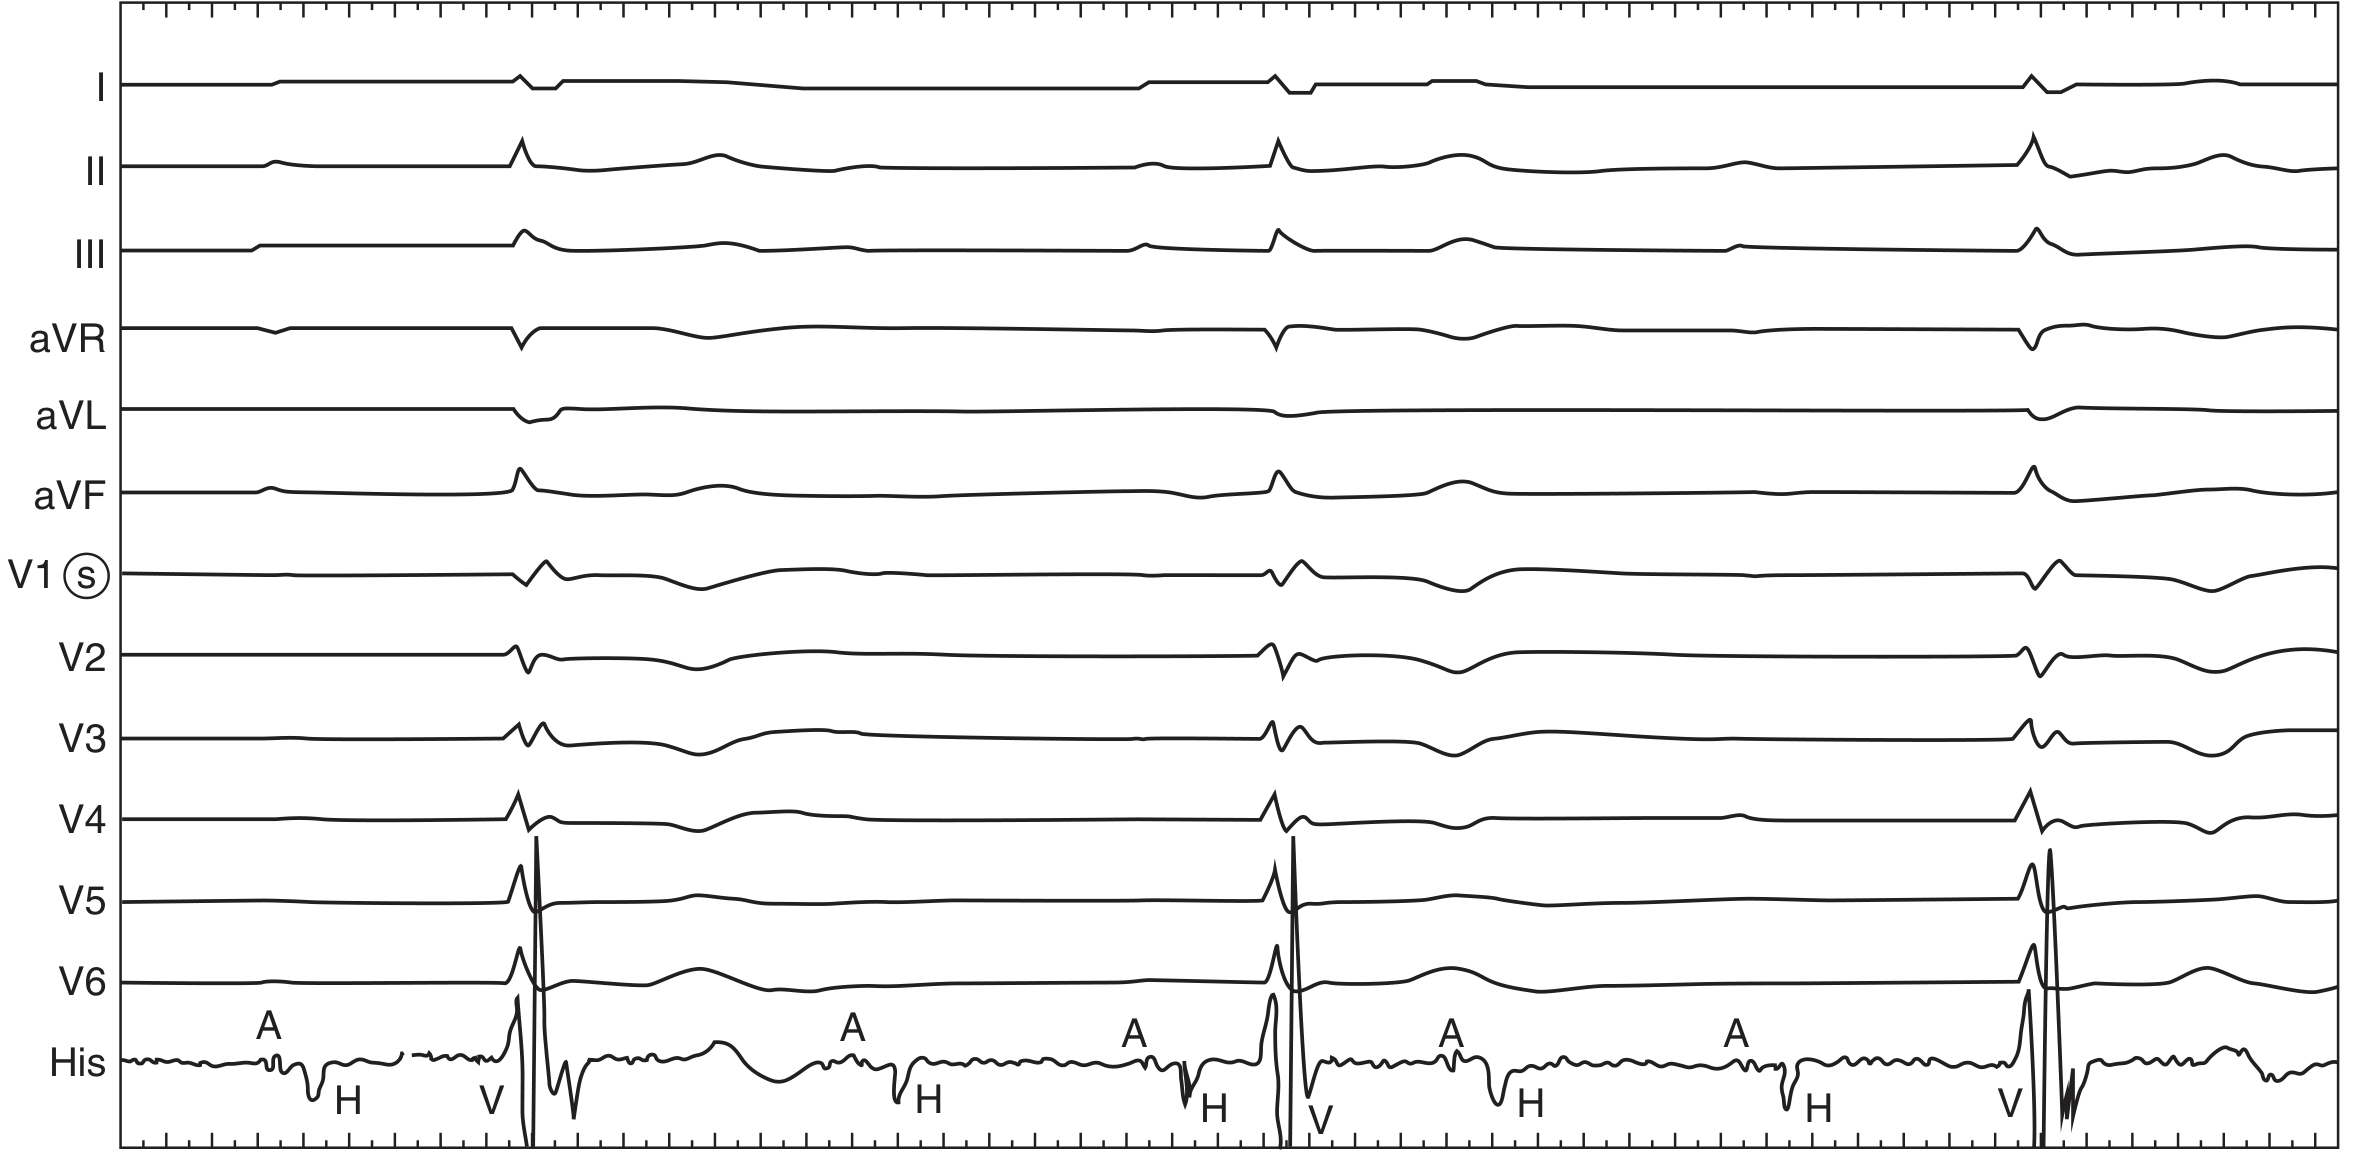
Complete heart block with right bundle branch block morphology escape rhythm. His bundle electrogram shows block below the level of the His. - Fuster and Hurst's The Heart
9. Ventricular Tachycardia (Monomorphic)
Key features: Wide complex tachycardia (QRS >120 ms) with a rapid, regular rate (typically 140-270 bpm), consistent QRS morphology beat-to-beat, AV dissociation, and no associated P waves. Most commonly caused by ischemic heart disease.
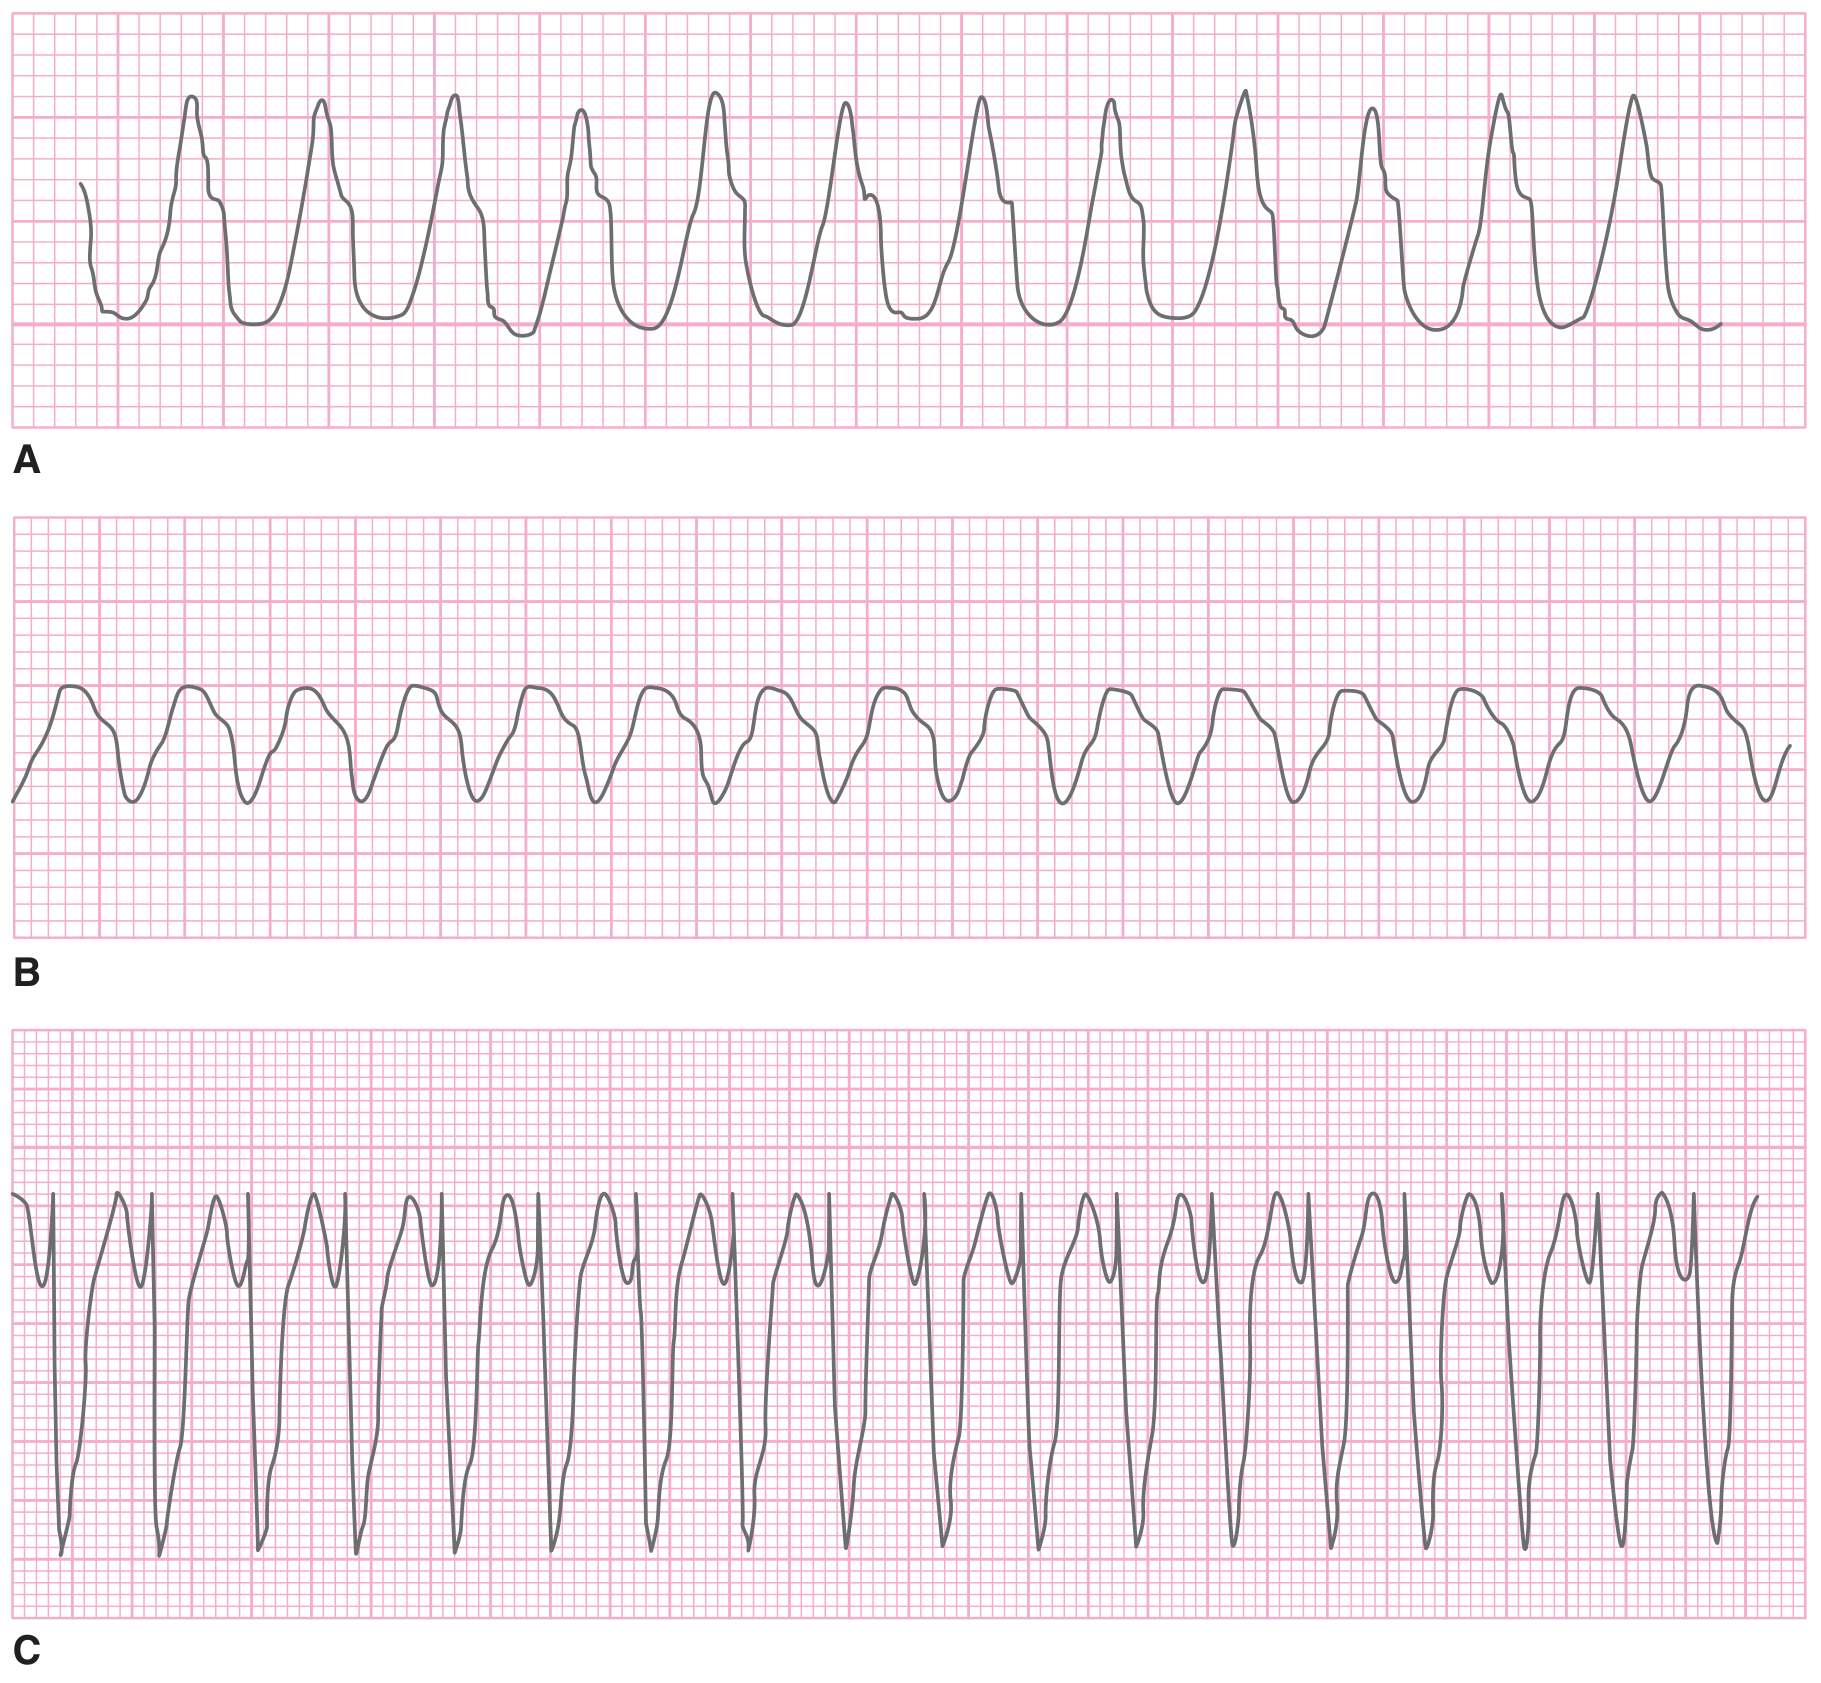
Three examples of monomorphic ventricular tachycardia: A=270 bpm, B=220 bpm, C=180 bpm. - Tintinalli's Emergency Medicine
10. Ventricular Arrhythmias Panel (PVC, VT, VF)
Key features panel: This composite shows PVCs (premature wide QRS with full compensatory pause), ventricular tachycardia (rapid regular wide-complex rhythm), and ventricular fibrillation (chaotic, disorganized electrical activity with no discernible QRS complexes - requires immediate defibrillation).
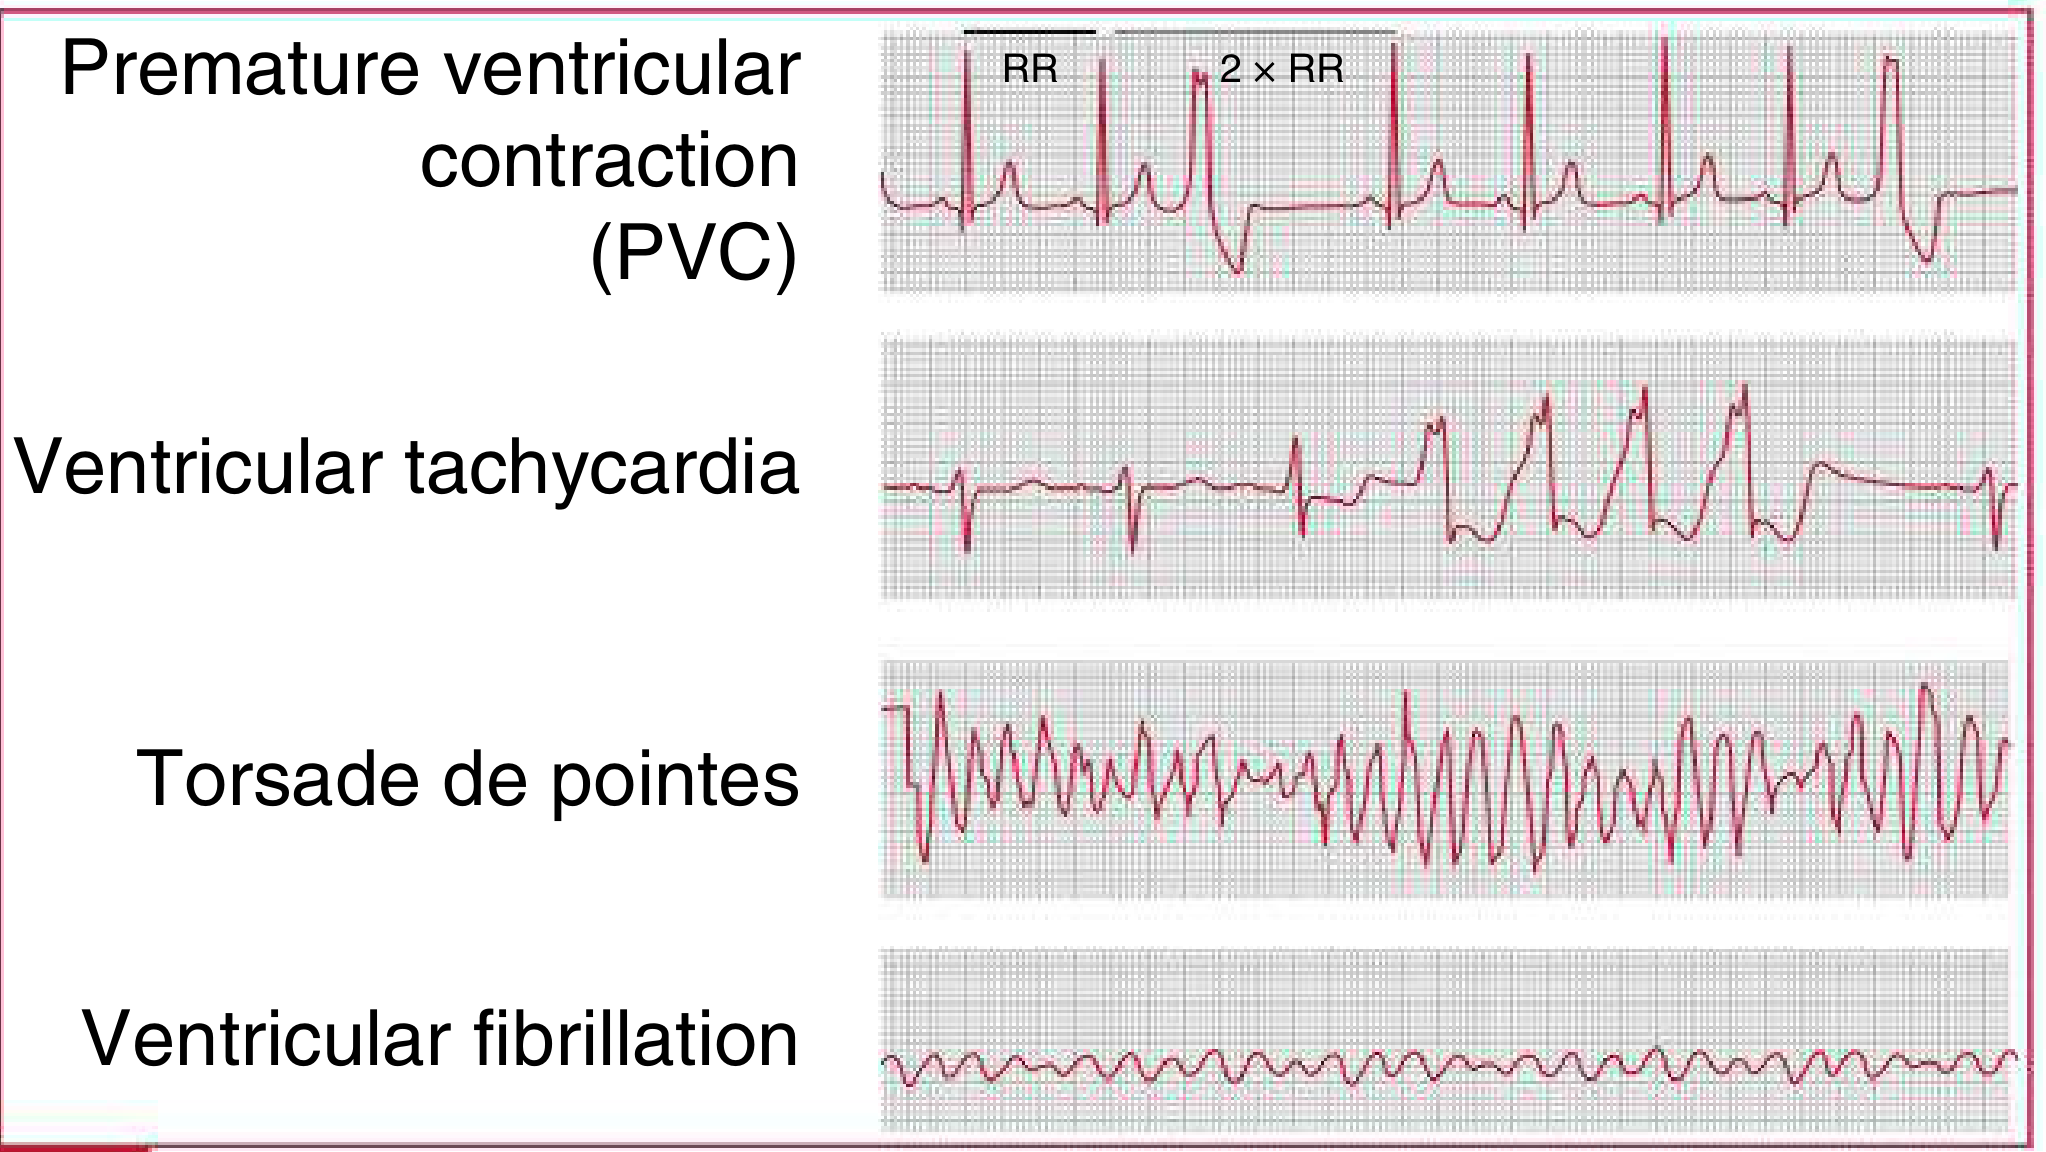
Ventricular arrhythmias: PVC, ventricular tachycardia, and ventricular fibrillation waveform patterns. - The Harriet Lane Handbook (Johns Hopkins Hospital)
Quick Reference Summary
| # | Abnormal ECG | Key Hallmark |
|---|---|---|
| 1 | Inferior STEMI | ST elevation III > II, reciprocal in I/aVL |
| 2 | Anterior STEMI | ST elevation V1-V3, I |
| 3 | RV Infarction | ST elevation in right precordial leads |
| 4 | LBBB with AMI | Concordant ST changes |
| 5 | Atrial Fibrillation | Irregularly irregular, no P waves |
| 6 | Atrial Flutter | Sawtooth F waves, 2:1 or 4:1 block |
| 7 | WPW Syndrome | Short PR, delta wave, wide QRS |
| 8 | Complete Heart Block | P-QRS dissociation, slow escape rate |
| 9 | Ventricular Tachycardia | Wide complex, regular, 140-270 bpm |
| 10 | Ventricular Fibrillation | Chaotic, no QRS - cardiac emergency |
Sources: Tintinalli's Emergency Medicine, Guyton & Hall Medical Physiology, Fuster & Hurst's The Heart, The Harriet Lane Handbook (Johns Hopkins).
This is a shared conversation. Sign in to Orris to start your own chat.