
Spinocerebellar tract
spinocerebellar tract anatomy spinal cord cerebellum
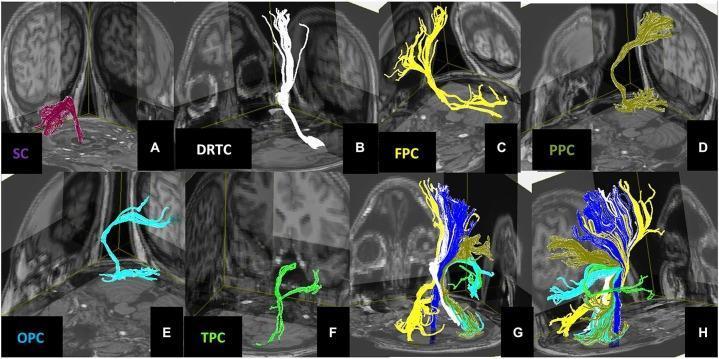
This diagnostic image displays 3D Diffusion Tensor Imaging (DTI) tractography reconstructions of human cerebellar pathways, overlaid on anatomical MRI slices. Panels A through F demonstrate individual pathways: (A) Spinocerebellar (SC) in magenta, originating in the medulla/spinal cord and entering the cerebellum via the inferior cerebellar peduncle; (B) Dentate-Rubro-Thalamo-Cortical (DRTC) in white, showing the efferent path from the dentate nucleus to the thalamus and cortex; (C) Fronto-Ponto-Cerebellar (FPC) in yellow; (D) Parieto-Ponto-Cerebellar (PPC) in mustard-yellow; (E) Occipito-Ponto-Cerebellar (OPC) in cyan; and (F) Temporo-Ponto-Cerebellar (TPC) in green. Panels G and H provide composite views, including the Corticospinal Tract (CST) in dark blue, illustrating the spatial relationship and integration of feed-forward and feed-backward cerebrocerebellar loops. The visual content highlights the distinct cortical termination points—frontal, parietal, occipital, and temporal lobes—essential for understanding the cerebellum's role in motor coordination, sensory integration, and higher cognitive functions. This visualization serves as an educational resource for neuroanatomy and clinical neurology.
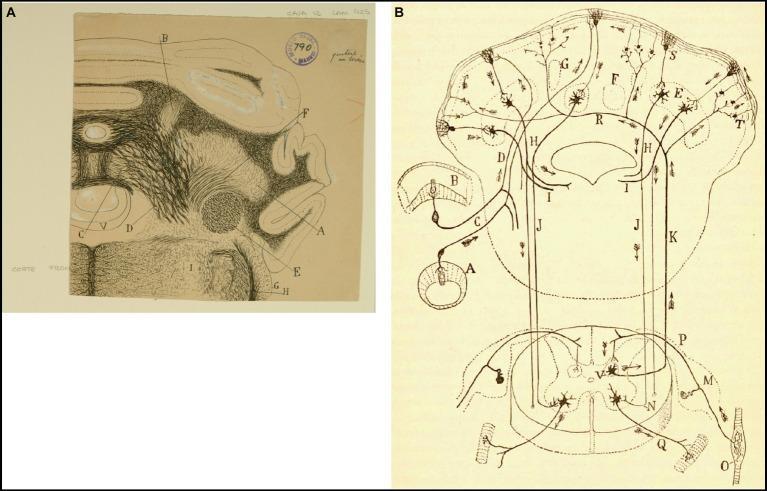
Historical anatomical diagrams by Ramón y Cajal depicting the neuroanatomical connectivity between the vestibular system, cerebellum, and spinal cord. Panel A is a detailed frontal section through the medulla oblongata and cerebellum. It identifies the deep cerebellar nuclei, including the lateral dentate nucleus (A), the more medial emboliform nucleus (B), and the fastigial nucleus (C) positioned near the fourth ventricle (V). Other visible structures include the inferior and superior cerebellar peduncles (E, F) and the trigeminal root (H). Panel B is a schematic algorithm of afferent and efferent pathways. It illustrates sensory input from the semicircular canals (A, B) traveling via the vestibular nerve (C) and its ascending branch (D) to the cerebellum. The diagram further details spinal connections, showing the dorsal spinocerebellar tract (R) originating from Clarke's column (V, P) and the descending pathways from the superior cerebellar peduncle (H, I, J) terminating in the ventral horn of the spinal cord (N) for motor control. Arrows indicate the direction of nerve impulse flow, highlighting the integration of vestibular and proprioceptive information for motor coordination.
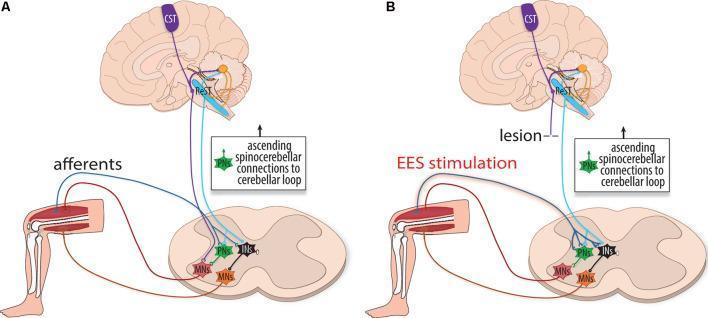
This medical schematic illustration depicts the internal motor copy circuitry and neural pathways involved in rehabilitation after spinal cord injury (SCI). The diagram is divided into two panels: (A) Healthy physiology and (B) Physiology following a lesion with Epidural Electrical Stimulation (EES). Key components include supraspinal networks like the Corticospinal Tract (CST, purple) and Reticulospinal Tract (ReST, blue) relaying motor commands from the brain to the spinal cord. Within the spinal cord, these tracts converge on interneurons (INs, black) and propriospinal neurons (PNs, green), which subsequently activate motoneurons (MNs, red/orange) to innervate the leg. Sensory afferents (red) return proprioceptive information from the leg to the spinal cord and cerebellum via the spinocerebellar tracts. In panel B, a lesion interrupts the primary descending tracts. However, EES stimulation is shown augmenting group Ia afferent activity, which spatiotemporally integrates with spared ReST fibers to reach the threshold required for interneuronal and motoneuronal activation. This illustrates the role of external neuromodulation in facilitating motor recovery by bypassing or reorganizing damaged descending pathways.
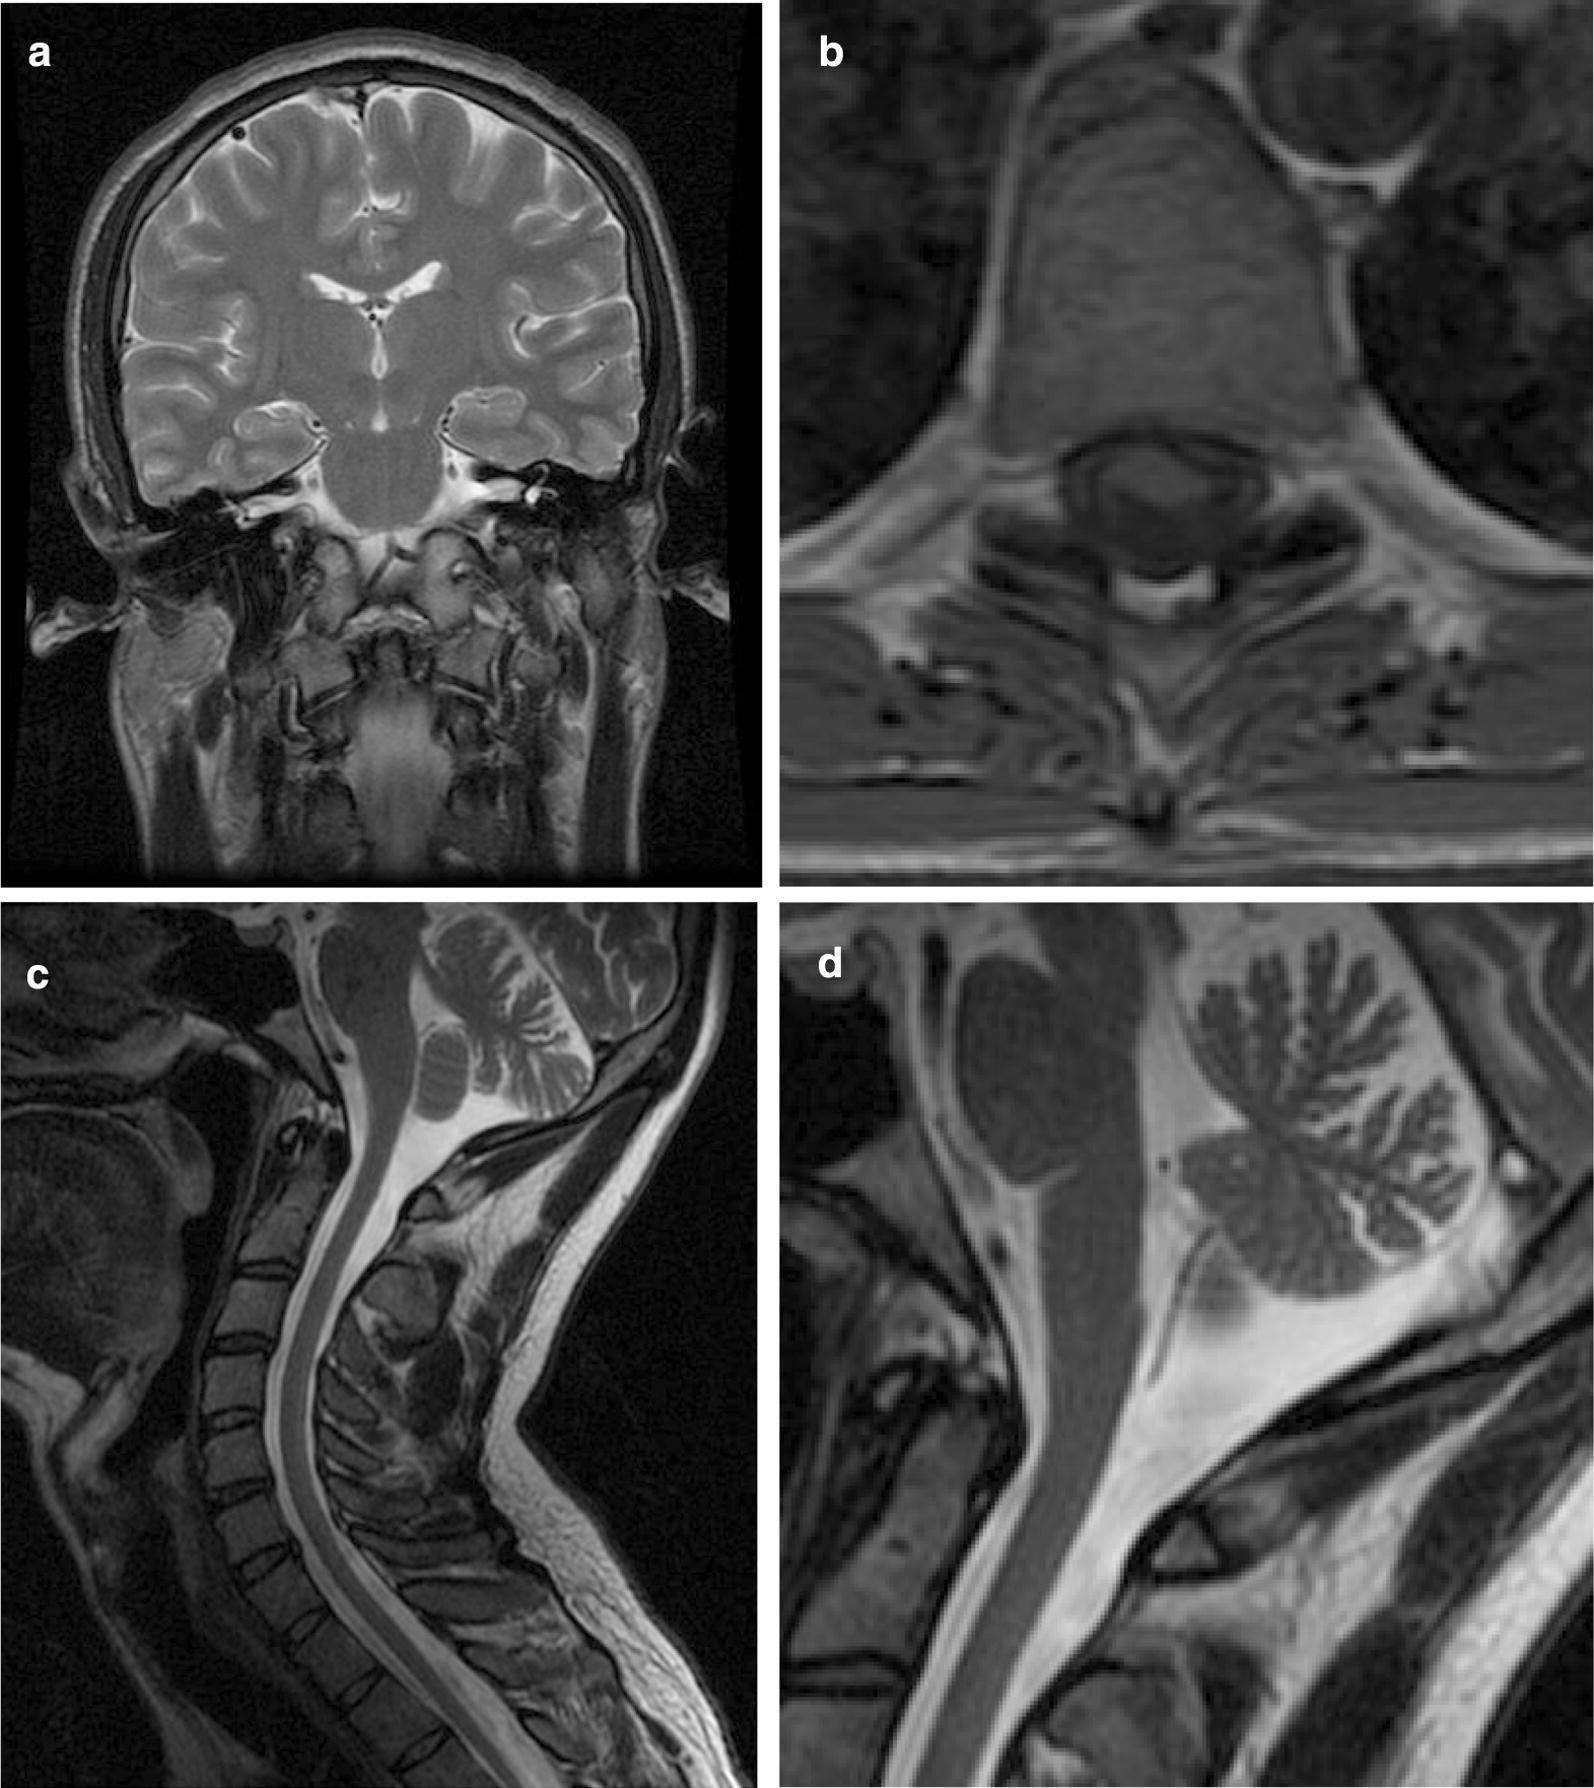
This composite of four MRI images displays neuroanatomical findings in a patient with spinocerebellar ataxia. Image (a) is a T2-weighted coronal section showing normal brain parenchyma, brainstem, inner ears, and vestibulocochlear nerves. Image (b) is a T1-weighted axial section of the dorsal spine, illustrating significant anteroposterior flattening of the spinal cord. Image (c) presents a T2-weighted sagittal view of the head and neck, demonstrating marked cervical kyphosis and both cervical spinal cord and cerebellar atrophy. Image (d) provides a high-magnification sagittal detail of the cerebellum, highlighting prominent folia and widened sulci indicative of cerebellar atrophy. These findings are clinically relevant for diagnosing syndromic neurological conditions such as Perrault syndrome or other spinocerebellar degenerations involving mitochondrial dysfunction.
Spinocerebellar Tracts
Overview Table
| Tract | Limb Served | Origin of Input | Relay Nucleus | Peduncle | Sidedness |
|---|---|---|---|---|---|
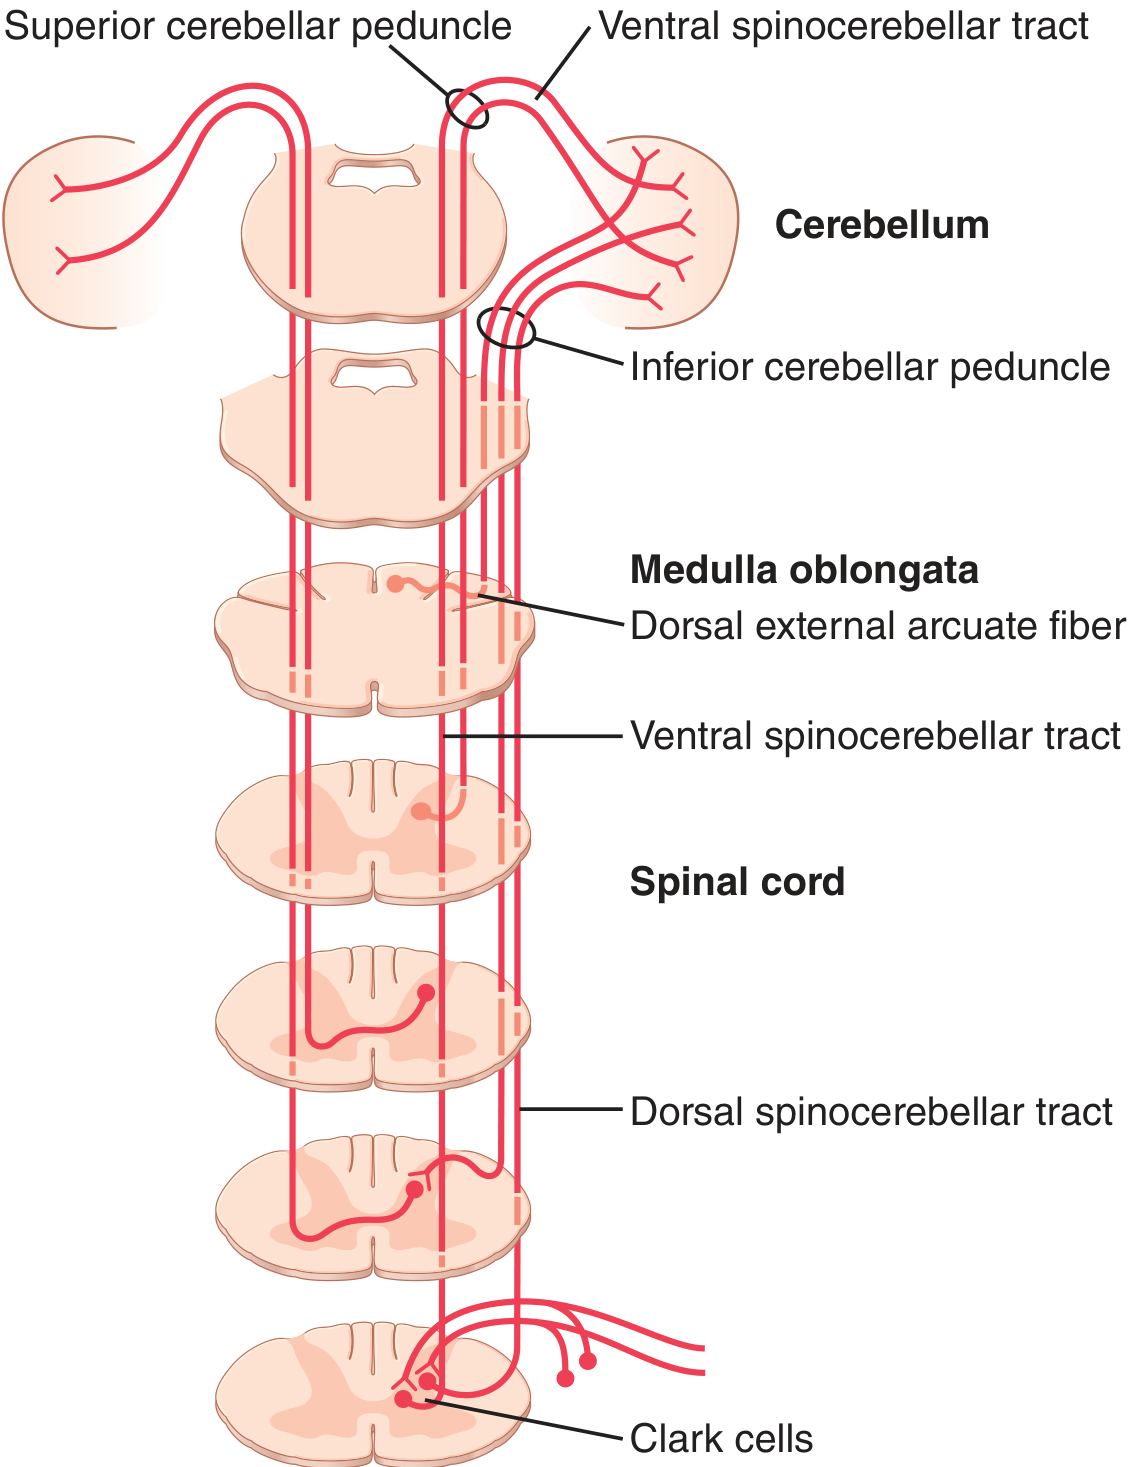
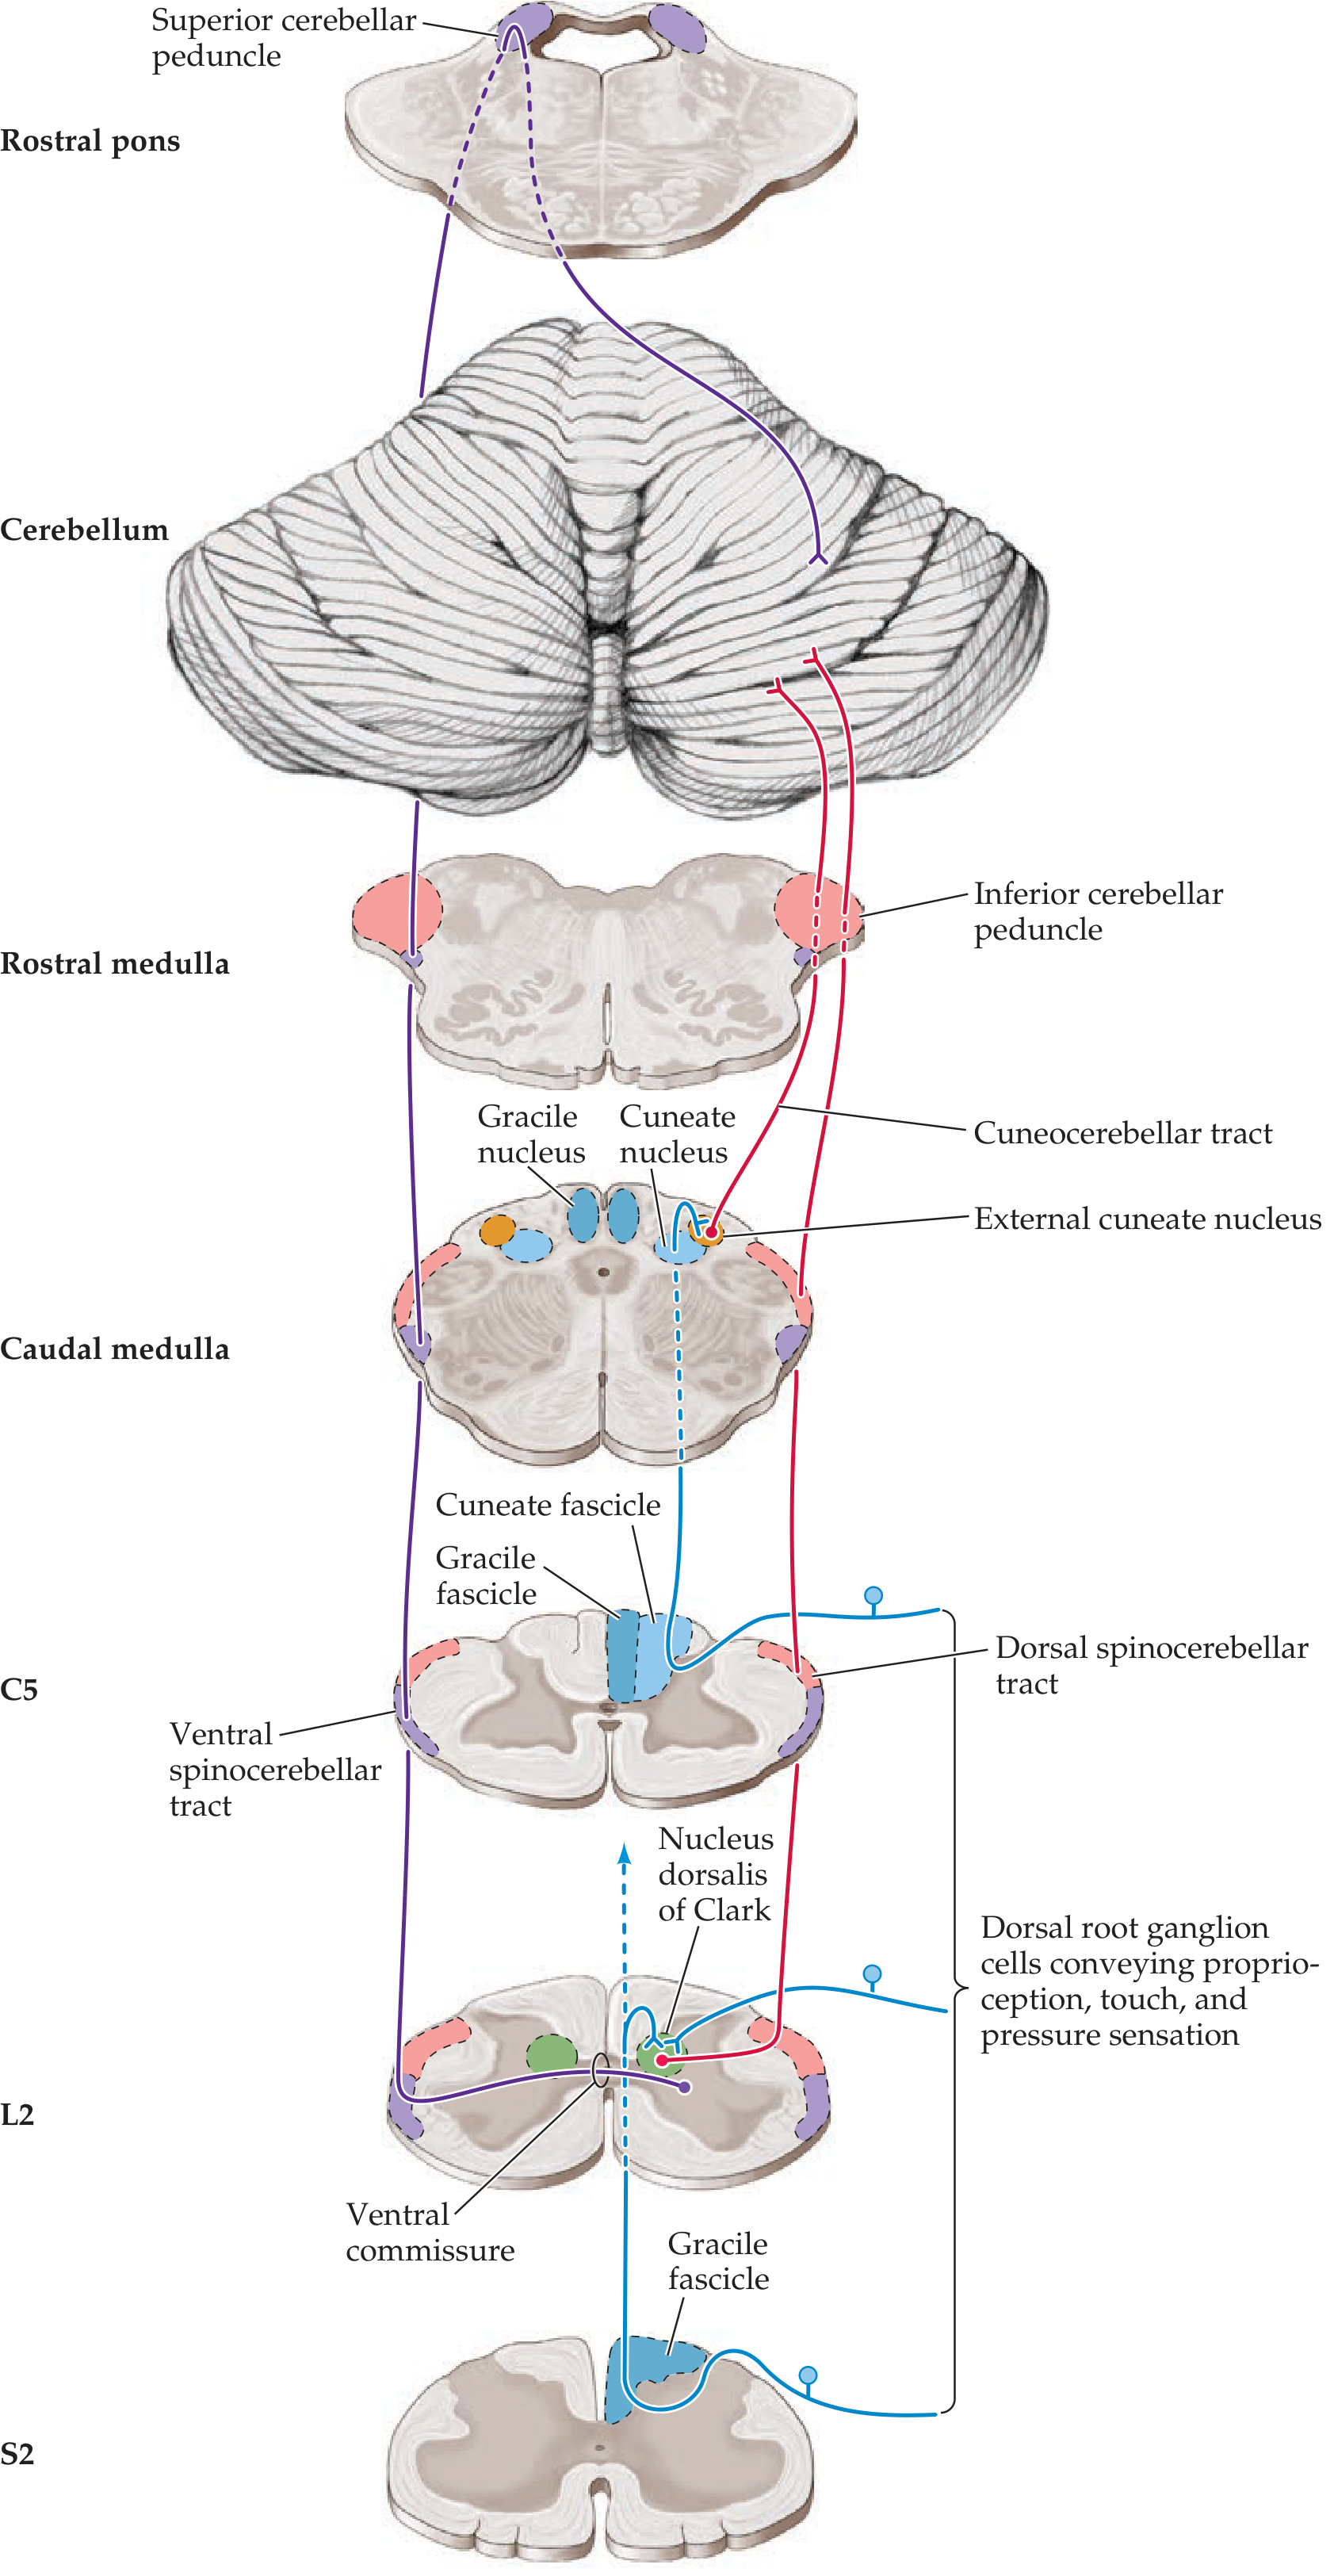
| Dorsal spinocerebellar (DSCT) | Lower extremity | Muscle spindles, Golgi tendon organs, skin/joint receptors | Nucleus dorsalis of Clark (C8-L2/3) | Inferior cerebellar peduncle | Ipsilateral (uncrossed) |
| Cuneocerebellar | Upper extremity + neck | Same peripheral receptors as DSCT | External (accessory/lateral) cuneate nucleus (medulla) | Inferior cerebellar peduncle | Ipsilateral (uncrossed) |
| Ventral spinocerebellar (VSCT) | Lower extremity | Spinal cord interneurons (efference copy) | Spinal border cells (outer central gray) | Superior cerebellar peduncle (double-crossed) | Ipsilateral (net) |
| Rostral spinocerebellar | Upper extremity | Spinal cord interneurons | Scattered cervical cord neurons | Both peduncles | Ipsilateral (net) |
1. Dorsal (Posterior) Spinocerebellar Tract (DSCT)
- Primary sensory neurons (dorsal root ganglion cells) conveying proprioception/touch from the lower body ascend ipsilaterally in the gracile fasciculus of the posterior columns.
- Rather than continuing to the gracile nucleus, collaterals synapse in the nucleus dorsalis of Clark (Clarke's column) - a column of cells in the dorsomedial spinal cord intermediate zone running from C8 to L2/3.
- Second-order fibers ascend ipsilaterally in the dorsolateral funiculus (just lateral to the lateral corticospinal tract) as the DSCT.
- The tract enters the cerebellum via the inferior cerebellar peduncle, terminating in the vermis and intermediate zone ipsilaterally as mossy fibers.
2. Cuneocerebellar Tract
- Primary afferents ascend ipsilaterally in the cuneate fasciculus.
- Synapse in the external (accessory/lateral) cuneate nucleus in the medulla, located just lateral and rostral to the standard cuneate nucleus. This nucleus is the upper-extremity equivalent of Clarke's column.
- Cuneocerebellar fibers then travel through the inferior cerebellar peduncle to the ipsilateral cerebellum.
3. Ventral (Anterior) Spinocerebellar Tract (VSCT)
- Arises from spinal border cells (neurons along the outer edge of central gray) and scattered intermediate zone neurons.
- Axons cross the midline via the ventral commissure.
- Ascend in the ventral spinocerebellar tract (ventrolateral funiculus, peripheral to the anterolateral system).
- Pass through the superior cerebellar peduncle and cross again within the cerebellum, ending up in the cerebellar cortex ipsilateral to the side of origin.
- This double-crossing ensures the final destination is ipsilateral.
4. Rostral Spinocerebellar Tract
Why All Spinocerebellar Input is Ipsilateral
Conduction Speed
Detailed Anatomy Diagram
Clinical Relevance
- Friedreich's ataxia and other spinocerebellar ataxias involve degeneration of spinocerebellar tracts, producing gait ataxia, limb ataxia, and loss of proprioception.
- Lateral medullary (Wallenberg) syndrome can interrupt the ascending DSCT, contributing to ipsilateral body lateropulsion with limb ataxia. - Localization in Clinical Neurology, 8th Ed.
- Because spinocerebellar signals are unconscious, their loss does not produce sensory symptoms on standard neurological testing of conscious sensation - dysfunction manifests as ataxia, not numbness.