
Difference between bipolar 1 and 2 disorders
bipolar disorder mood episodes spectrum comparison
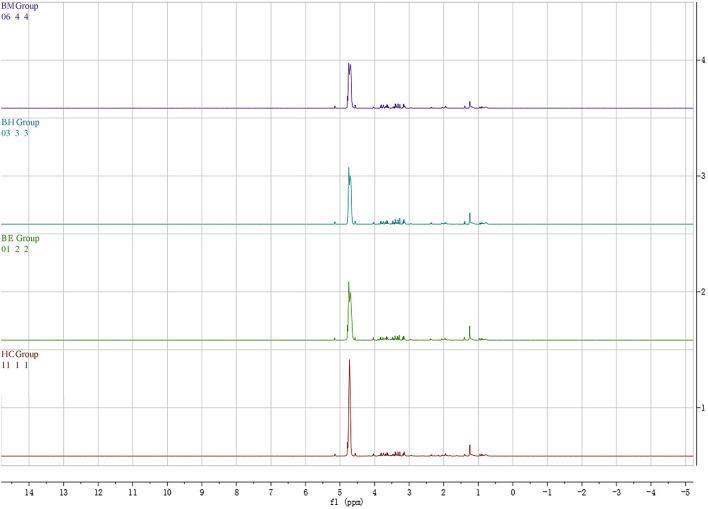
This diagnostic comparison chart displays four stacked Proton Nuclear Magnetic Resonance (1H NMR) spectra of human plasma, used in metabolomics research to identify potential biomarkers for Bipolar Disorder (BD). The spectra are arranged vertically and share a common horizontal x-axis representing chemical shift (f1) in parts per million (ppm), ranging from -5 to 14 ppm. The four groups represented include three clinical phases of Bipolar Disorder: BM (mixed episodes), BH (mania/hypomania episodes), and BE (depressive episodes), alongside an HC (healthy control) group. Visually, each spectrum shows a prominent peak at approximately 4.8 ppm (typically associated with water suppression or specific serum metabolites) and a cluster of smaller peaks in the aliphatic region between 0 and 4 ppm, containing markers like lipids, N-acetyl-glycoprotein, and organic acids. Differences in peak height and area across the groups indicate variations in metabolite concentrations, suggesting distinct metabolic profiles for different BD clinical states compared to controls. This image illustrates the application of spectroscopy in psychiatry for metabolic phenotyping.
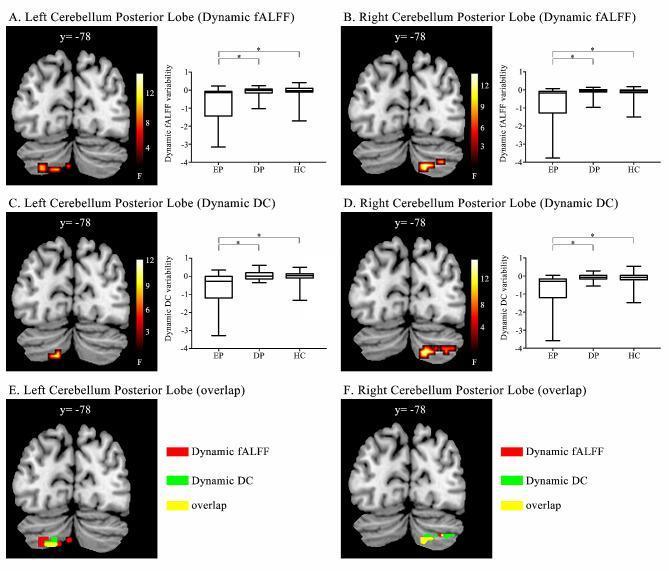
This composite diagnostic image presents findings from a functional magnetic resonance imaging (fMRI) study focusing on neuroimaging biomarkers in Bipolar Disorder (BD). The figure is divided into six panels (A–F), displaying coronal brain sections at y = -78, specifically targeting the left and right Cerebellum Posterior Lobe (CPL). Panels A and B illustrate clusters of altered dynamic fractional amplitude of low-frequency fluctuations (dfALFF), while C and D show changes in dynamic degree centrality (dDC). Heat maps overlaid on grayscale structural templates indicate the intensity of these dynamic variabilities. Panels E and F provide a spatial comparison using a color-coded overlap analysis: red represents dfALFF regions, green represents dDC regions, and yellow indicates voxels where both parameters overlap. Accompanying each fMRI slice is a box plot comparing euthymic BD patients (EP), depressed BD patients (DP), and healthy controls (HC). The charts demonstrate significantly lower variability in the euthymic group compared to both depressed patients and healthy controls. This educational graphic illustrates the use of resting-state fMRI metrics to distinguish clinical states within the bipolar spectrum, highlighting the cerebellum's involvement in the pathophysiology of mood disorders.
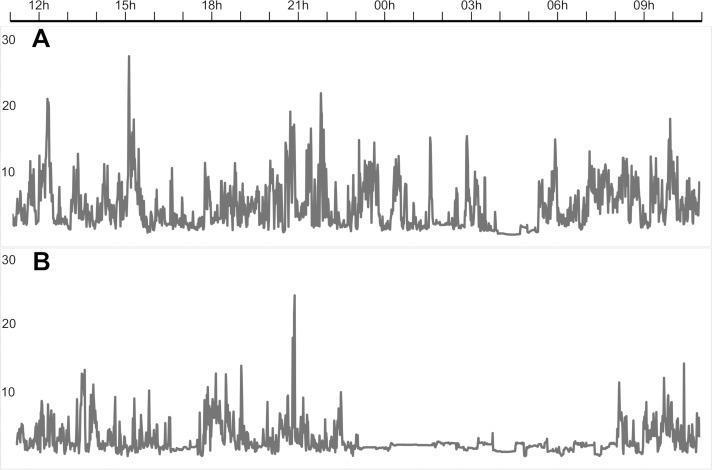
This Comparison Chart displays two 24-hour actigraph recordings (accelerometry) from a single patient with bipolar disorder, illustrating motor activity patterns during different clinical states. The x-axis represents time from 11:00 (11h) to 11:00 the following day, while the y-axis measures activity counts in gravitational force equivalents. Graph A depicts the patient in a manic state, characterized by high-amplitude, high-frequency activity peaks and sustained nocturnal movements, particularly between 00h and 06h, indicating significant psychomotor agitation and reduced sleep. Graph B represents the same patient in remission (euthymic state), showing a marked reduction in overall motor activity. Notably, Graph B demonstrates a flattened baseline with minimal fluctuations during the overnight hours (00h to 06h), reflecting a more regular circadian rhythm and normalized sleep-wake patterns. This visual data serves as an educational tool in psychiatry for understanding the objective physiological manifestations of mood episodes and the quantification of psychomotor activity changes in affective disorders.
Bipolar I vs. Bipolar II Disorder
The Core Distinction
| Feature | Bipolar I | Bipolar II |
|---|---|---|
| Elevated mood episode | Full mania | Hypomania only (never full mania) |
| Depressive episodes | May or may not occur | Always present (required for diagnosis) |
| Psychosis | Can occur during mania | Does NOT occur |
| Hospitalization | Often required for mania | Not required for hypomanic episodes |
| Functional impairment | Marked, during mania | Minimal during hypomania; impairment from depression |
| Prevalence | ~1% of population | ~0.6-1% (some studies show bipolar II is more prevalent in outpatient settings) |
Mania vs. Hypomania - The Key Difference
- Inflated self-esteem or grandiosity
- Decreased need for sleep
- Pressured speech / increased talkativeness
- Racing thoughts / flight of ideas
- Distractibility
- Increased goal-directed activity or psychomotor agitation
- Reckless behavior (spending sprees, hypersexuality, poor judgment)
- Lasts at least 4 consecutive days
- Does not cause marked functional impairment
- Does not require hospitalization
- Does not include psychotic features
- May actually manifest as increased efficiency, creativity, or productivity
- Is often ego-syntonic - patients may enjoy it and not spontaneously report it
"Hypomania is distinguished from mere happiness in that it tends to recur (happiness does not!)" - Kaplan & Sadock's Comprehensive Textbook of Psychiatry
Diagnostic Criteria Summary (DSM-5)
Clinical Differences in Detail
- In Bipolar II, the dominant burden is actually depression, not hypomania. Patients spend far more time depressed than hypomanic. The hypomanic phases tend to be brief (often only a few days at the end of a depressive episode).
- Bipolar II depression often has "admixtures" - depressive mixed states with some features of elevated energy, flight of ideas, or increased impulsivity co-existing with depressed mood. These occur in ~60% of Bipolar II cases. - Kaplan & Sadock's Comprehensive Textbook of Psychiatry
- Counterintuitively, Bipolar II carries a higher suicide risk than Bipolar I. Of the three major mood disorder groups (unipolar depression, Bipolar I, Bipolar II), Bipolar II patients carry the highest risk of both attempted and completed suicide.
- Bipolar patients in general have a lower ratio of attempts to completed suicides (5-10:1) compared to the general population (15-40:1), indicating higher lethality of methods. - Kaplan & Sadock's Comprehensive Textbook of Psychiatry
- Bipolar I: roughly equal in men and women (~1.1:1 ratio).
- Bipolar II: women are more likely to have hypomania with mixed depressive features and rapid-cycling progression. - Swanson's Family Medicine Review
- About 20% of patients diagnosed with Bipolar II will eventually convert to Bipolar I over follow-up (especially children and adolescents, in whom the Bipolar II diagnosis is less stable). - Kaplan & Sadock's Synopsis of Psychiatry
- Bipolar II should NOT be seen as a "milder" disorder - it is associated with high chronicity, stormy interpersonal relationships, and significant long-term impairment due to recurrent depression.
Treatment Differences
| Aspect | Bipolar I | Bipolar II |
|---|---|---|
| Acute mania | Antipsychotics (olanzapine, quetiapine, risperidone) ± benzodiazepines for agitation | Not applicable (no mania) |
| Maintenance | Lithium (drug of choice), valproate, carbamazepine, atypical antipsychotics | Lithium, lamotrigine; quetiapine has some evidence for bipolar II depression |
| Antidepressants | Used cautiously - risk of switching to mania (~14% acute, ~23% maintenance) | Slightly lower switch risk (~7% acute, ~14% maintenance), but still used with caution |
Quick Summary
- Bipolar I = mania (full, severe, potentially psychotic) ± depression
- Bipolar II = hypomania (mild, non-psychotic, non-impairing) + mandatory major depression
- Bipolar II is not a milder form - its high depression burden and suicide risk make it equally serious, just differently characterized
- The distinction matters clinically because it affects treatment choices, hospitalization decisions, and prognostic counseling