
Multiple myeloma pathology
multiple myeloma plasma cells bone marrow histology
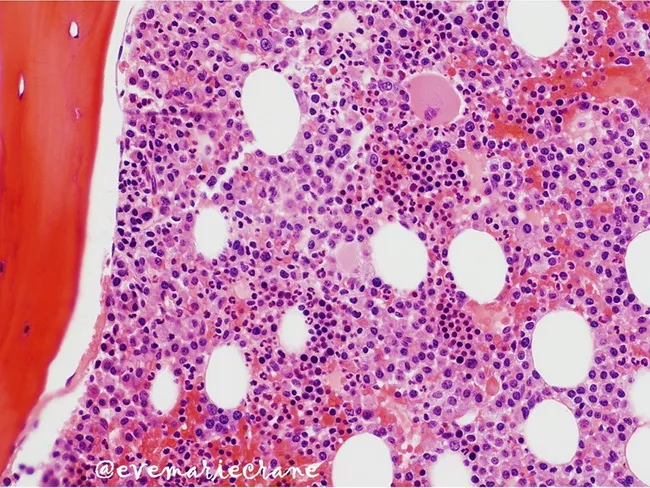
Bone marrow trephine biopsy, Hematoxylin and Eosin stained, evaluated by light microscopy. This histopathology image depicts medullary marrow with cellular admixture dominated by clonal plasma cells. Plasma cells comprise approximately 50% of nucleated cells, demonstrating interstitial (non-follicular) infiltration in a background of residual hematopoietic elements and adipocytes. The architectural pattern is interstitial rather than diffuse sheets at this stage, consistent with stage II myeloma by marrow involvement (Stage II: 20–50% replacement). The plasma cells show hyperchromatic nuclei with clumped chromatin and moderate cytoplasm; occasional binucleation may be present; cytoplasmic features not fully assessable at this magnification. Normal hematopoiesis is variably preserved in focal areas but is increasingly suppressed toward representing marrow replacement. The image correlates with increasing tumor burden and is used for staging, risk assessment, and monitoring response to therapy. In clinical practice, plasmacytosis of this magnitude suggests symptomatic multiple myeloma with potential cytopenias and immunoparesis; cytomorphology must be correlated with flow cytometry and serum/urine studies to confirm clonality. Differential considerations include reactive plasmacytosis, MGUS, and plasmacytoma; however, the extensive involvement and pattern here favor a systemic plasma cell neoplasm. This histology guides prognosis and therapeutic decisions.
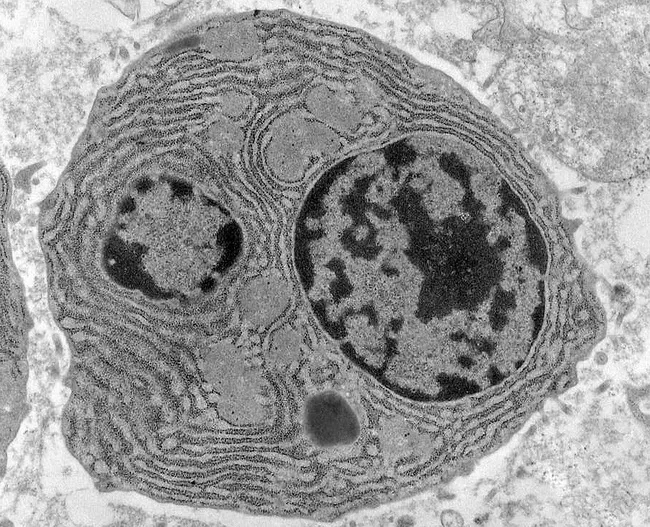
Transmission electron microscopy image of bone marrow plasma cells in multiple myeloma, highlighting ultrastructural features of malignant plasmacytosis. The specimen is a bone marrow biopsy/aspirate subjected to TEM to reveal subcellular architecture at high magnification. The primary subject is a plasma cell characterized by a prominent, eccentrically placed nucleus with chunky, irregular clumped chromatin and abundant cytoplasm. Bi- or multinucleation is frequently observed in myeloma cells. The cytoplasm shows extensive rough endoplasmic reticulum organized in parallel lamellae, reflecting heavy immunoglobulin synthesis. Light gray, round to ovoid cytoplasmic inclusions known as Russell bodies are evident within the cytoplasm, representing condensed immunoglobulin within intact endoplasmic reticulum. The cellular borders are well defined, and there is sometimes distension of the ER cisternae near the perinuclear region. The image underscores hallmark features of malignant plasma cells in multiple myeloma and demonstrates both proliferative activity and high secretory load. Clinically, these ultrastructural findings correlate with a high monoclonal immunoglobulin production and marrow infiltration, informing prognosis and therapeutic decisions when integrated with light-chain studies and routine histology. This EM view complements light microscopy by providing evidence of intracellular organelle expansion and intracellular inclusions that are not discernible with conventional staining. Potential educational use includes teaching plasmacytosis, plasma cell neoplasia morphology, and EM-based diagnostic histopathology.
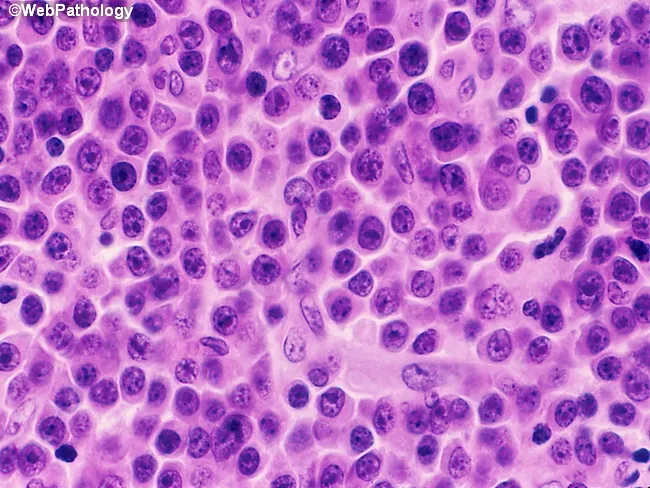
Histology, Light microscopy; bone marrow trephine biopsy stained with Hematoxylin and Eosin (H&E). The specimen shows extensive replacement of normal hematopoietic elements by sheets of immature plasma cells, consistent with marrow involvement by plasma cell myeloma. The infiltrate is markedly cellular with high nuclear-to-cytoplasmic ratio, round to oval nuclei, coarse clumped chromatin, and inconspicuous nucleoli in many cells. Nucleoli are more prominent in a subset of plasma blasts, and some cells display multinucleation. The cytoplasm is variably basophilic and often abundant, contributing to a purple to pink background. The normal marrow architecture is effaced; residual hematopoiesis is sparse. Occasional binucleated or trinucleated plasma cells may be seen; mitotic figures can be present, reflecting active proliferation. The overall pattern is diffuse, with possible focal aggregates. In non-secretory myeloma, as in this case, monoclonal plasma cell proliferation can be demonstrated by immunohistochemistry for kappa or lambda light chains and by molecular studies showing clonal rearrangements, even in the absence of detectable M protein in serum or urine. However, this image itself shows characteristic plasma cell morphology and marrow effacement; clinical correlation with serum free light chains and immunophenotyping is essential for diagnosis and staging. This histopathology supports a diagnosis of multiple myeloma with marrow involvement.
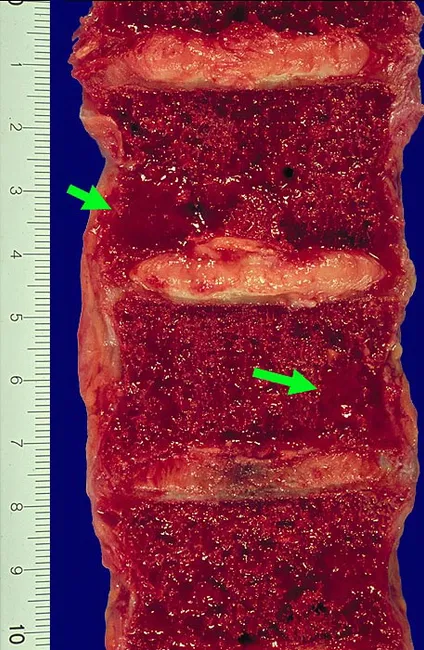
Gross pathology photograph of a spinal vertebral section showing multiple destructive lytic lesions characteristic of plasma cell myeloma involving the axial skeleton. The specimen comprises several contiguous vertebral bodies with preserved posterior elements, oriented in a sagittal plane to expose the cancellous marrow and trabecular bone within. Lesions are red-brown, gelatinous, soft-tissue masses within the vertebral bodies, replacing normal bone marrow and producing conspicuous cortical thinning. The surrounding marrow is dark red and congested, with focal areas of hemorrhagic discoloration. The left side features a centimeter-scale ruler for gross correlation, underscoring the lesion's extent and the degree of vertebral body destruction. Clinically, such lytic vertebral involvement commonly presents with axial bone pain, especially in the back, and may lead to vertebral collapse and potential spinal cord compression. Hypercalcemia from bone resorption can manifest as confusion, weakness, lethargy, constipation, and polyuria. While histology would show sheets of malignant plasma cells with CD138 positivity and light-chain restriction, this gross image emphasizes the destructive bone disease pattern. The image supports radiographic correlation, biopsy planning, and staging assessment in multiple myeloma management. For diagnostic, educational utility, and research applications.
"multiple myeloma"[MeSH Terms] AND pathophysiology
Multiple Myeloma - Pathology
Overview
- Robbins & Kumar Basic Pathology, p. 422
- Grainger & Allison's Diagnostic Radiology, p. 1700
Pathogenesis
Cell of Origin and Preclinical Phase
- Comprehensive Clinical Nephrology, 7th Ed., p. 5273
Key Molecular Events
| Mechanism | Detail |
|---|---|
| IgH chromosomal translocations | Chromosome 14 IgH locus fuses to oncogenes (cyclin D1, cyclin D3), dysregulating D cyclins and driving proliferation |
| MYC translocations | Appear late in disease; associated with aggressive phenotype |
| IL-6 signalling | Principal growth/survival cytokine; secreted by bone marrow stromal cells, fibroblasts, macrophages, osteoclasts; supports autocrine/paracrine myeloma cell growth |
| RANKL upregulation | Myeloma-derived factors upregulate RANKL on stromal cells → osteoclast activation → bone resorption |
| Osteoblast inhibition | Tumor-released factors actively suppress osteoblast function → net increase in resorption |
- Robbins & Kumar Basic Pathology, p. 422
M Protein Production
- IgG: most common (~60%)
- IgA: ~20-25%
- Light chains only (Bence Jones): ~20% - κ or λ chains alone
- IgM, IgD, IgE: rare
- Non-secretory: ~1% (no detectable M protein)
- Robbins & Kumar Basic Pathology, p. 422
Morphology
Gross / Skeletal Pathology
- Vertebral column, ribs, skull, pelvis, femur, clavicle, scapula
Bone Marrow Histology
- Prominent nucleoli
- Russell bodies - cytoplasmic inclusions of immunoglobulin within distended ER
- Binucleation or multinucleation
- High nuclear-to-cytoplasmic ratio in more aggressive disease
Myeloma Kidney (Renal Involvement)
-
Cast nephropathy - Bence Jones (free light chain) proteins combine with uromodulin (Tamm-Horsfall protein) secreted by thick ascending loop of Henle cells to form obstructive casts in distal convoluted tubules and collecting ducts. Multinucleate giant cells (macrophage-derived) surround the casts.
-
Proximal tubular toxicity - Free light chains are filtered at the glomerulus (κ monomers ~25 kDa, λ dimers ~50 kDa) and endocytosed via cubilin receptors in the proximal tubule. Overload causes lysosomal rupture, cytosolic enzyme release, and release of IL-6, IL-8, and MCP-1 via NF-κB activation. This can cause crystalline inclusions and Fanconi syndrome (especially with κ light chains).
-
AL amyloidosis - Light chain deposition in glomeruli and vessel walls as amyloid.
-
Metastatic calcification - From hypercalcemia due to bone resorption.
-
Bacterial pyelonephritis - Secondary to immunoparesis.
- Comprehensive Clinical Nephrology, 7th Ed., p. 5280
- Robbins & Kumar Basic Pathology, p. 422
Systemic Effects and Complications
CRAB Criteria (Key Clinical Features)
| Feature | Mechanism |
|---|---|
| C - Hypercalcemia | RANKL-driven osteoclast activation → bone resorption → Ca²⁺ release |
| R - Renal insufficiency | Cast nephropathy, light chain toxicity, AL amyloidosis, hypercalcemia |
| A - Anaemia | Marrow replacement by plasma cells → suppressed erythropoiesis; normocytic normochromic |
| B - Bone lesions | Lytic lesions, pathologic fractures, diffuse osteopenia |
Immune Dysfunction (Immunoparesis)
Laboratory Findings
| Test | Finding |
|---|---|
| Serum protein electrophoresis (SPEP) | Monoclonal M spike |
| Urine protein electrophoresis (UPEP) | Bence Jones proteins (free light chains) |
| Free light chain assay | Elevated involved chain with abnormal κ/λ ratio |
| Bone marrow biopsy | >10% clonal plasma cells (diagnostic threshold) |
| CBC | Normocytic normochromic anaemia, ± leukopenia, thrombocytopenia |
| Serum calcium | Elevated |
| Serum creatinine | Elevated (renal dysfunction) |
| β2-microglobulin | Elevated; used for staging (ISS staging) |
Imaging Pathology
Plain Radiograph
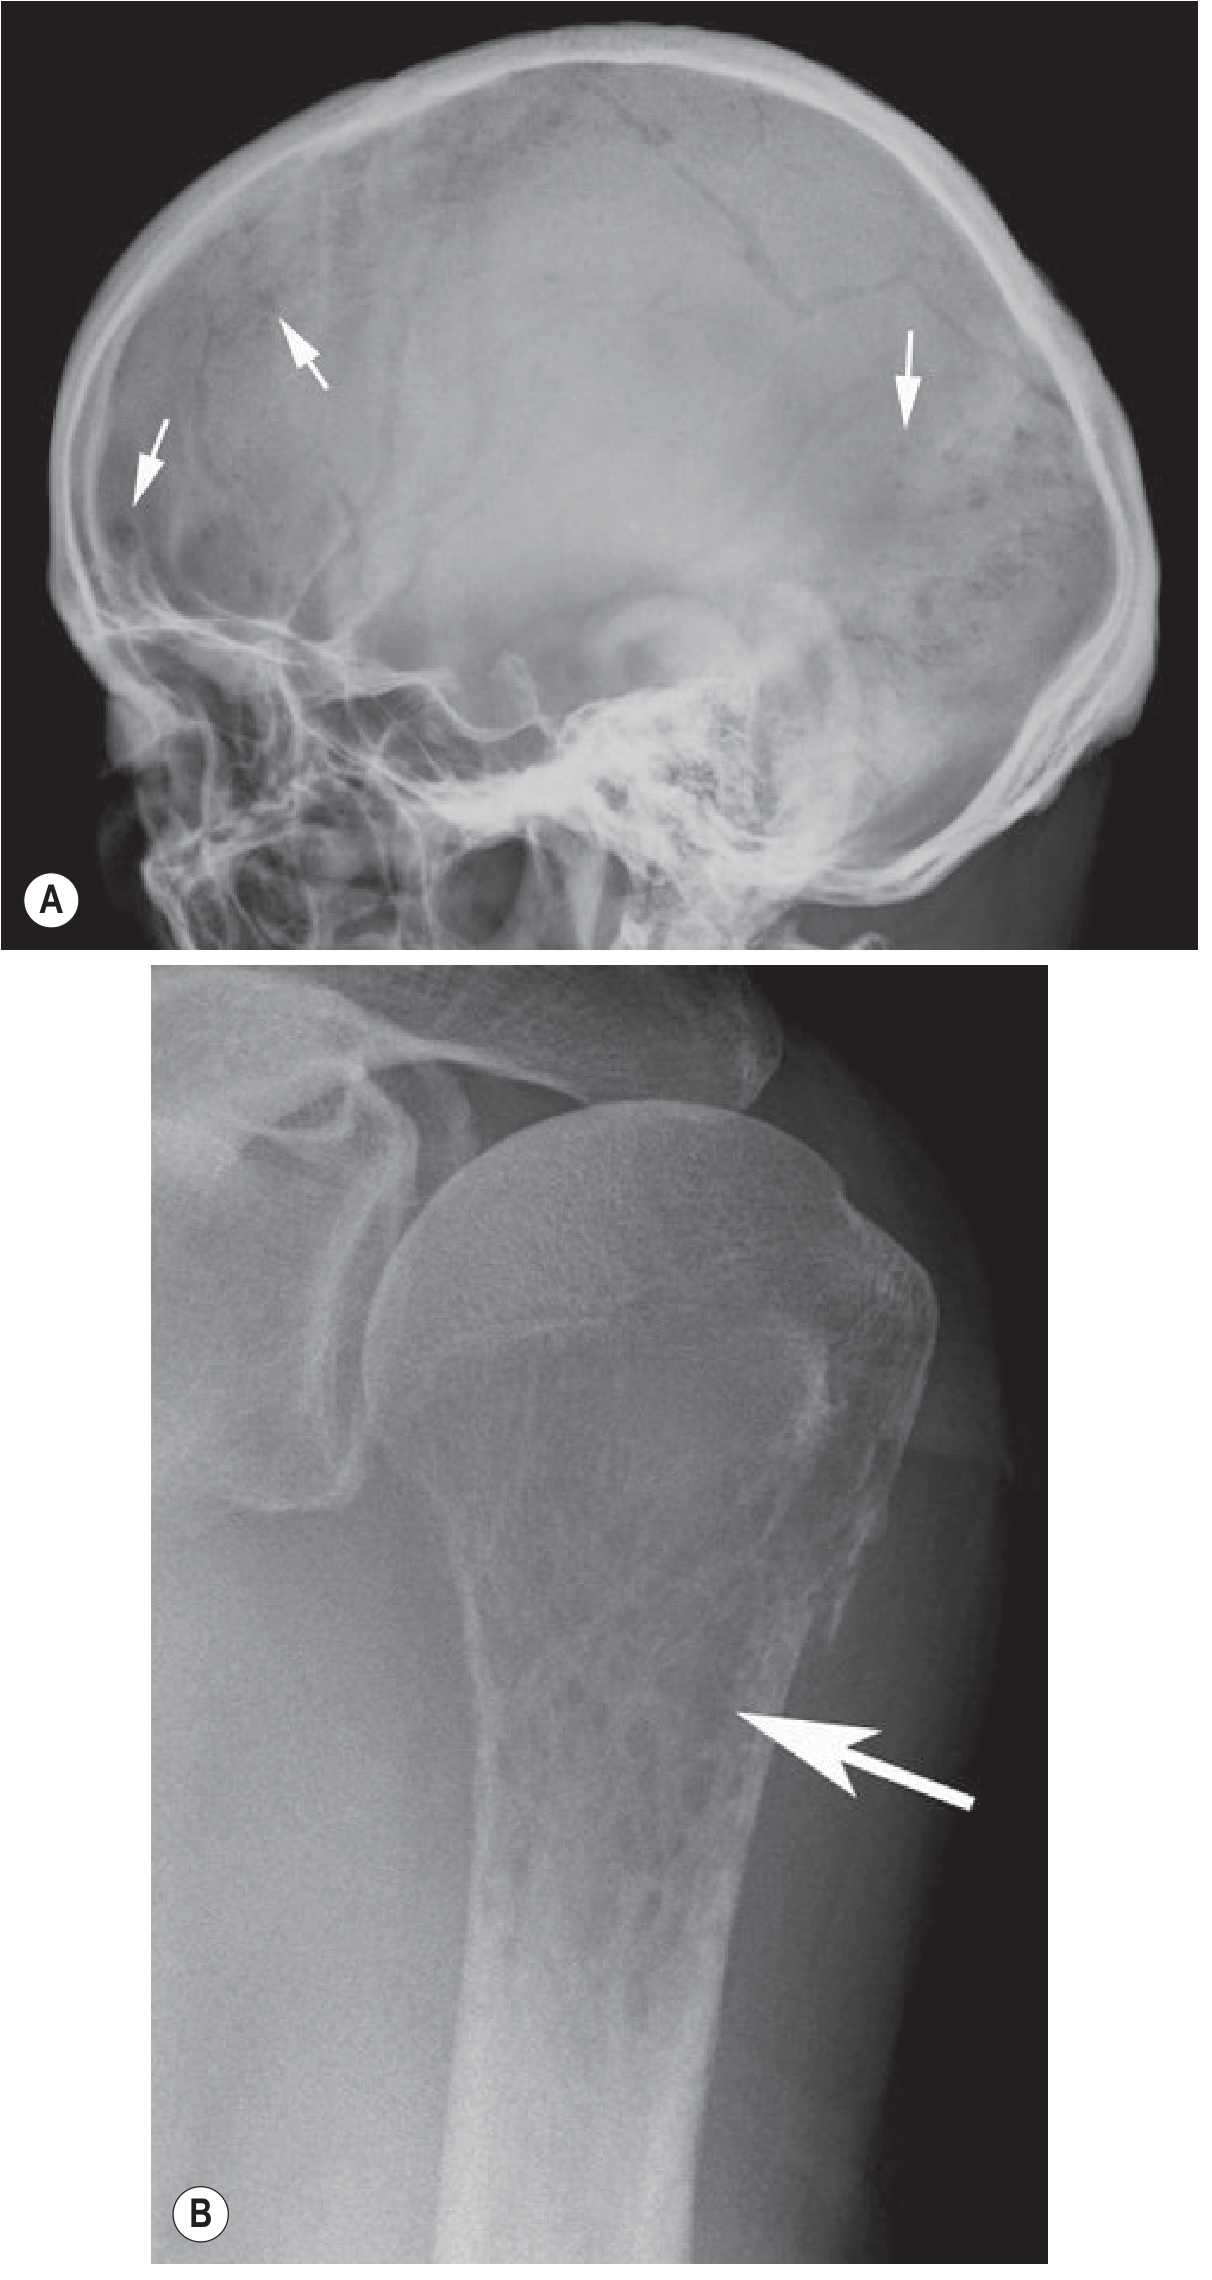
- Classic "punched-out" lytic lesions, most characteristic in the skull
- Moth-eaten or permeative bone destruction
- Diffuse osteopenia (spine) and vertebral compression fractures
CT / PET-CT
- Far more sensitive than skeletal survey for detecting lesions
- Purely marrow lesions appear as focal areas of soft-tissue density
- Progressive disease: endosteal scalloping, cortical destruction, soft-tissue masses
MRI (Most Sensitive)
- Normal - low-grade infiltration or early disease
- Focal - discrete lesions >5 mm, low T1 / high T2/STIR signal (18-50% of cases)
- Diffuse - generalized T1 signal reduction (intervertebral discs appear bright vs. vertebral bodies); high tumour burden; 25-43% of cases
- Combined focal + diffuse
- Variegated - multiple tiny foci on normal background; early disease; 1-5%
- Grainger & Allison's Diagnostic Radiology, p. 1701
Gross Pathology - Vertebral Involvement
Prognosis
- Patients with multiple bony lesions, if untreated: rarely survive >6-12 months
- Smoldering myeloma (asymptomatic with high M protein): may not require treatment for years
- Median survival with modern therapy: ~5 years
- Prognosis is variable depending on cytogenetics (e.g., del17p, t(4;14), t(14;16) are high-risk), ISS stage, and renal function
Summary Diagram of Pathophysiology
MGUS → somatic mutations → Myeloma clone
          ↓
  IL-6 from stroma supports growth
          ↓
  ┌───────────────────────────────┐
  │   Bone marrow: >30% plasma    │
  │   cells, lytic lesions        │
  └──────────┬────────────────────┘
             ↓
   RANKL↑ → osteoclast activation → lytic lesions, hypercalcemia
   osteoblast inhibition ─────────────────────────────┘
             ↓
   M protein secretion → hyperviscosity, amyloidosis
   Free light chains → Bence Jones proteinuria → cast nephropathy → renal failure
   Immunoparesis → bacterial infections
   Marrow replacement → anaemia, leukopenia, thrombocytopenia
Please give me exam oriented answers in proper order
multiple myeloma bone marrow plasma cells Russell bodies histology
Transmission electron microscopy image of bone marrow plasma cells in multiple myeloma, highlighting ultrastructural features of malignant plasmacytosis. The specimen is a bone marrow biopsy/aspirate subjected to TEM to reveal subcellular architecture at high magnification. The primary subject is a plasma cell characterized by a prominent, eccentrically placed nucleus with chunky, irregular clumped chromatin and abundant cytoplasm. Bi- or multinucleation is frequently observed in myeloma cells. The cytoplasm shows extensive rough endoplasmic reticulum organized in parallel lamellae, reflecting heavy immunoglobulin synthesis. Light gray, round to ovoid cytoplasmic inclusions known as Russell bodies are evident within the cytoplasm, representing condensed immunoglobulin within intact endoplasmic reticulum. The cellular borders are well defined, and there is sometimes distension of the ER cisternae near the perinuclear region. The image underscores hallmark features of malignant plasma cells in multiple myeloma and demonstrates both proliferative activity and high secretory load. Clinically, these ultrastructural findings correlate with a high monoclonal immunoglobulin production and marrow infiltration, informing prognosis and therapeutic decisions when integrated with light-chain studies and routine histology. This EM view complements light microscopy by providing evidence of intracellular organelle expansion and intracellular inclusions that are not discernible with conventional staining. Potential educational use includes teaching plasmacytosis, plasma cell neoplasia morphology, and EM-based diagnostic histopathology.
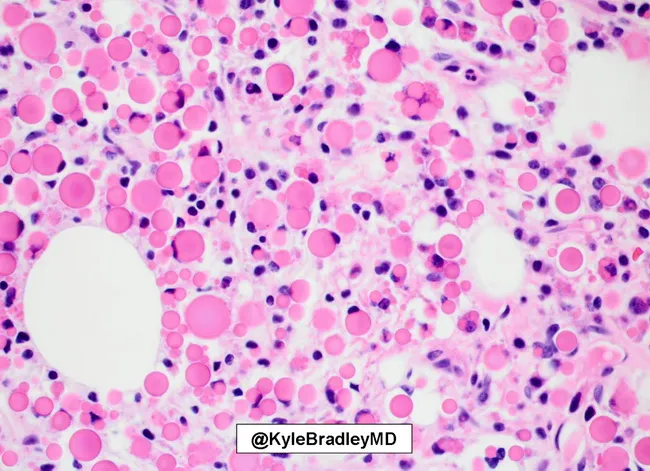
Imaging modality: light microscopy, bright-field, with hematoxylin and eosin staining of a bone marrow core biopsy. Specimen shows a cellular marrow with sheets of plasma cells occupying a large proportion of the tissue, interrupting normal hematopoietic elements. The malignant plasma cells display classic features of plasma cell neoplasia, including eccentric nuclei and coarse clumped chromatin, and abundant cytoplasm. Within many plasma cells, there are eosinophilic cytoplasmic inclusions representing Russell bodies (immunoglobulin condensations). The distribution is diffuse and sheets are interspersed with residual adipocytes and scattered karyorrhectic debris. The background shows mild interstitial fibrosis and occasional binucleated plasma cells. Notable bystander plasma cells are present but in smaller numbers, consistent with clonal proliferation. In the context of myeloma, such marrow involvement supports a diagnosis of multiple myeloma with heavy plasmacytosis and intracellular immunoglobulin accumulation. Clinically, this morphology prompts ancillary testing including serum protein electrophoresis, immunofixation, and light chain assay to determine monoclonality and disease burden. The image is valuable for educational illustration of Russell bodies in myeloma, differential diagnosis of plasmacytosis, and for correlating histology with cytology and radiology in diagnostic workups. It serves as a reference for hematopathology trainees and pathology education in plasma cell dyscrasias.
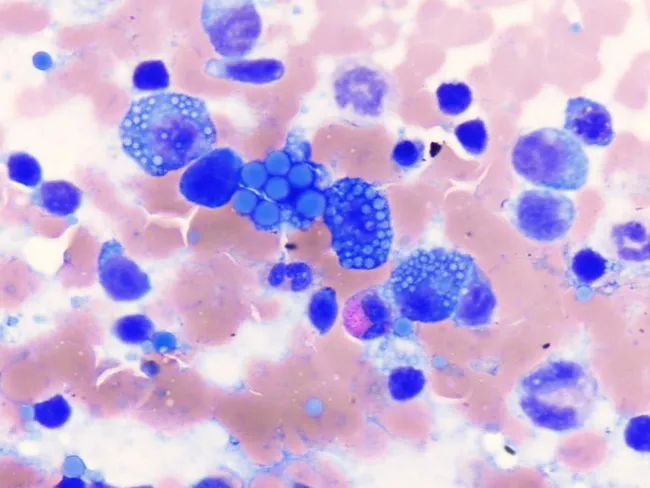
Bright-field light microscopy of a bone marrow aspirate cytology smear stained with Wright-Giemsa reveals a plasmacytic infiltrate rich in cytoplasmic inclusions. The primary cells are mature plasma cells with eccentric nuclei and basophilic cytoplasm; numerous cells exhibit cytoplasmic hyaline inclusions known as Russell bodies, which are immunoglobulin-rich vesicular structures derived from rough endoplasmic reticulum. In this field, several cells are markedly vacuolated and, collectively, these may be described as Mott cells when the cytoplasm is packed with multiple Russell bodies. The image also shows some cells with dense, aggregated immunoglobulin droplets and occasional binucleation, reflecting plasmacytic differentiation. Such features can be observed in reactive plasmacytosis as well as in plasma cell neoplasms, including multiple myeloma. Recognition of Russell bodies and Mott cells supports assessment of immunoglobulin synthesis disorders and plasmacytosis burden. The staining highlights cytoplasm more prominently than nuclei, enabling visualization of inclusion bodies and cytoplasmic granularity. Clinically, the presence of Mott cells with Russell bodies raises differential diagnoses that require correlation with serologic studies (Ig levels, monoclonality), marrow clonality assessment, and systemic evaluation for myeloma or gammopathy of undetermined significance. This cytologic pattern is a hallmark of plasmacytic maturation and immunoglobulin handling by malignant or reactive plasma cells.
MULTIPLE MYELOMA - Complete Exam Answer (MBBS/MD)
1. DEFINITION
Exam key: MM is defined by:
- ≥10% clonal plasma cells on bone marrow examination
- M protein in serum or urine
- ≥1 myeloma-defining event (CRAB criteria or biomarkers)
2. EPIDEMIOLOGY
| Feature | Detail |
|---|---|
| Incidence | ~1% of all malignancies; ~10-15% of haematological malignancies |
| Median age | 65-70 years (only 2% under age 40) |
| Sex | Male > Female (~2:1) |
| Race | Blacks have ~2x higher incidence than Whites |
| Most common primary malignant bone tumour | Yes (among primary bone neoplasms) |
3. ETIOPATHOGENESIS
Step-by-step progression:
Normal B cells → antigen stimulation → Plasma cells
       ↓
   Somatic mutations (genetic hits)
       ↓
   MGUS (Monoclonal Gammopathy of Undetermined Significance)
       ↓ ~1% per year
   Smoldering Myeloma
       ↓
   Multiple Myeloma (symptomatic)
Molecular/Genetic Events
| Event | Significance |
|---|---|
| IgH translocations (chromosome 14q32) | Hallmark; fuse IgH locus to cyclin D1 (11q13), cyclin D3, FGFR3, MAF - drives proliferation |
| RAS mutations | Associated with MGUS → MM progression |
| MYC abnormalities | Late event; aggressive disease |
| del 13q | Adverse prognosis |
| del 17p (TP53) | Adverse prognosis |
| t(4;14), t(14;16) | High-risk cytogenetics |
| Amplification of 1q | Disease progression marker |
Cytokine Milieu
- IL-6: Principal growth and survival factor - secreted by bone marrow stromal cells, fibroblasts, macrophages, osteoclasts; drives autocrine/paracrine plasma cell growth
- NF-κB pathway dysregulation: Promotes cell survival and osteoclast activation
- RANKL/OPG imbalance: RANKL↑, OPG↓ → osteoclast activation → pure lytic bone disease
- DKK-1, IL-3, IL-7: Suppress osteoblasts → no reactive bone formation (unlike metastases)
- MIP-1α, SDF-α, IL-1β: Additional osteoclast-activating factors
4. M PROTEIN (PARAPROTEIN) TYPES
| Immunoglobulin | Frequency |
|---|---|
| IgG | 60% (most common) |
| IgA | 20-25% |
| Light chain only (κ or λ) | ~20% (Bence Jones myeloma) |
| IgD, IgE, IgM | Rare |
| Non-secretory | ~1% |
- Free light chains + M protein together: 60-70% of cases
- Normal κ/λ ratio is ~2:1; clonal excess of one type is diagnostic
5. MORPHOLOGY
5A. Gross Pathology (Skeletal)
- Multifocal destructive lytic lesions involving: vertebral column, ribs, skull, pelvis, femur, clavicle, scapula
- Lesions arise in medullary cavity → erode cancellous bone → destroy cortex
- "Punched-out" lytic lesions, 1-4 cm diameter - classic appearance
- Bone lesions are purely lytic with no reactive sclerosis (osteoblast suppression)
- Pathologic fractures common in vertebrae and femur
5B. Bone Marrow Histology (Microscopy)
- >30% plasma cells in marrow cellularity (diagnostic threshold)
- Cells show eccentric "clock-face" nucleus with coarse clumped chromatin
- Russell bodies - eosinophilic cytoplasmic inclusions of condensed immunoglobulin in distended ER
- Mott cells - plasma cells stuffed with multiple Russell bodies (grape-cell appearance)
- Binucleation, multinucleation, and prominent nucleoli in aggressive disease
- Normal marrow architecture effaced; residual haemopoiesis suppressed
- Terminal stage: leukemic picture (plasma cell leukaemia)
5C. Immunophenotype of Myeloma Plasma Cells
| Marker | Status |
|---|---|
| CD138 (Syndecan-1) | Positive (key marker) |
| CD38 | Positive |
| CD19, CD20 | Negative (unlike normal plasma cells) |
| Light chain restriction (κ or λ) | Positive (clonality) |
| Surface Ig | Negative/weak |
5D. Myeloma Kidney (Renal Morphology) - Exam Favourite
- Bence Jones proteins (free light chains) + Tamm-Horsfall (uromodulin) protein → hard, eosinophilic, fractured casts in distal tubules and collecting ducts
- Multinucleate giant cells (macrophage-derived) surround the casts - pathognomonic
- Adjacent tubular epithelium undergoes necrosis/atrophy
- Proximal tubular toxicity (LC overload → lysosomal rupture, NF-κB activation, IL-6/IL-8 release)
- AL amyloidosis (glomeruli and vessel walls, Congo red positive, apple-green birefringence)
- Fanconi syndrome (κ light chain crystalline inclusions in proximal tubules)
- Metastatic calcification (hypercalcaemia)
- Bacterial pyelonephritis (secondary to immunoparesis)
6. CLINICAL FEATURES - CRAB CRITERIA
Mnemonic: CRAB
| Letter | Feature | Mechanism |
|---|---|---|
| C | Hypercalcaemia (>11 mg/dL) | RANKL↑ osteoclast activation → bone resorption |
| R | Renal failure (Cr >2 mg/dL) | Cast nephropathy, AL amyloidosis, hypercalcaemia, LC toxicity |
| A | Anaemia (Hb <10 g/dL) | Marrow replacement → normocytic normochromic anaemia |
| B | Bone lesions (lytic or osteopenia) | Osteoclast ↑ + osteoblast ↓ → pure lytic disease |
Other Clinical Features
- Bone pain (most common presenting symptom) - back pain, rib pain
- Pathologic fractures - vertebral collapse, femur
- Recurrent bacterial infections - pneumococcal pneumonia (immunoparesis - despite high total Ig, functional antibody production is profoundly depressed)
- Neurological - spinal cord compression, peripheral neuropathy, hypercalcaemic encephalopathy (confusion, lethargy)
- Hyperviscosity syndrome - bleeding, visual disturbances (especially with IgA or IgM)
- Amyloidosis - in ~20% of patients; macroglossia, carpal tunnel syndrome, cardiomyopathy
7. SPECTRUM OF PLASMA CELL DISORDERS
| Condition | Marrow Plasma Cells | M Protein | Symptoms | Progression |
|---|---|---|---|---|
| MGUS | <10% | <3 g/dL | None | ~1%/year to MM |
| Smoldering MM | 10-30% | >3 g/dL | None | ~75% over 15 years |
| Multiple Myeloma | ≥10% (clonal) | Present | CRAB present | Established malignancy |
| Solitary Plasmacytoma | Normal elsewhere | Low/absent | Single lesion | →MM over 10-20 years |
8. LABORATORY INVESTIGATIONS
| Test | Finding | Significance |
|---|---|---|
| SPEP (serum protein electrophoresis) | Monoclonal M spike in β or γ region | Screening |
| Immunofixation electrophoresis | Identifies Ig class and light chain type | Confirmatory |
| Serum free light chain assay | Elevated involved chain; abnormal κ/λ ratio | Sensitive, especially for LC-only myeloma |
| Urine UPEP + Bence Jones | Free light chains in urine | Renal risk |
| Bone marrow biopsy | ≥10% clonal plasma cells | Diagnostic gold standard |
| CBC | Normocytic normochromic anaemia; ± leukopenia, thrombocytopenia; Rouleaux formation on PBF | Marrow failure |
| Serum calcium | Elevated | CRAB |
| Serum creatinine/urea | Elevated | Renal involvement |
| β2-microglobulin | Elevated | ISS staging marker |
| LDH | Elevated in aggressive disease | Tumour burden |
| Serum albumin | Decreased | ISS staging marker |
| 24-hr urine protein | Bence Jones proteinuria (does NOT react with dipstick - detects albumin only) | Classic exam point |
Exam trap: Bence Jones proteinuria is NOT detected on urine dipstick (which detects albumin). It is detected by heat precipitation or urine SPEP/immunofixation.
9. IMAGING
| Modality | Appearance |
|---|---|
| X-ray (skeletal survey) | "Punched-out" lytic lesions (no sclerotic rim); moth-eaten destruction; diffuse osteopenia; most classic in skull ("pepper-pot skull"); vertebral compression fractures |
| Whole-body low-dose CT | More sensitive than X-ray; shows focal marrow lesions as soft-tissue density; endosteal scalloping, cortical destruction |
| MRI (whole body) | Most sensitive; 5 patterns: normal, focal, diffuse, combined, variegated; T1 low/T2 high signal in lesions; diffuse pattern = high tumour burden = poor prognosis |
| PET-CT | Active metabolic disease; useful for response monitoring; FDG uptake ↓ with treatment |
| Bone scan | Often negative in MM - no osteoblastic activity (important distinction from metastases which are hot on bone scan) |
10. DIAGNOSTIC CRITERIA (IMWG 2014)
- Hypercalcaemia, Renal failure, Anaemia, Bone lesions
- Sniper (BM plasma cells ≥60%)
- Light chain ratio (involved:uninvolved ≥100)
- MRI with >1 focal lesion ≥5mm
11. STAGING
ISS (International Staging System)
| Stage | Criteria | Median Survival |
|---|---|---|
| I | β2-microglobulin <3.5 mg/L AND albumin ≥3.5 g/dL | ~62 months |
| II | Neither I nor III | ~44 months |
| III | β2-microglobulin ≥5.5 mg/L | ~29 months |
12. COMPLICATIONS
| Complication | Mechanism |
|---|---|
| Pathologic fractures | Lytic bone disease |
| Spinal cord compression | Vertebral collapse/plasmacytoma |
| Acute renal failure | Cast nephropathy, hypercalcaemia |
| Recurrent infections | Immunoparesis (leading cause of death) |
| Hyperviscosity | High levels of IgA or IgG |
| AL Amyloidosis | Free light chain deposition |
| Hypercalcaemic crisis | Massive bone resorption |
| Plasma cell leukaemia | Terminal dissemination of plasma cells |
13. TREATMENT (Key Points for Exam)
| Category | Drug/Approach | Mechanism |
|---|---|---|
| Proteasome inhibitors | Bortezomib, Carfilzomib | Exploit myeloma cells' dependence on proteasome for degrading misfolded Ig; trigger apoptosis |
| Immunomodulatory drugs (IMiDs) | Thalidomide, Lenalidomide | Activate ubiquitin ligases targeting myeloma survival proteins; anti-angiogenic |
| Anti-CD38 monoclonal Ab | Daratumumab | Targets CD38+ plasma cells |
| Stem cell transplant | Autologous HSCT | Prolongs life; not curative; standard of care for eligible patients |
| CAR-T cell therapy | Anti-BCMA (B-cell maturation antigen) | Deep remissions; risk of cytokine release syndrome |
| Bisphosphonates | Zoledronic acid, Pamidronate | Inhibit osteoclasts → reduce fractures, hypercalcaemia |
| Corticosteroids | Dexamethasone | Anti-tumour; anti-inflammatory |
14. PROGNOSIS
- Median survival with modern therapy: ~5 years (improving)
- Without treatment, multiple bony lesions: 6-12 months
- Good prognosis cytogenetics: t(11;14), cyclin D1 translocations
- Poor prognosis cytogenetics: del(17p), t(4;14), t(14;16), del(13q), 1q amplification
- ~60% of patients alive at 5 years
15. EXAM HIGH-YIELD SUMMARY (Quick Recall)
| Point | Fact |
|---|---|
| Most common M protein | IgG (60%) |
| Most common symptom | Bone pain |
| Classic X-ray | "Punched-out" lytic lesions in skull |
| Bone scan | Negative (no osteoblast activity) |
| Urine finding | Bence Jones proteinuria (NOT on dipstick) |
| Bone marrow | >30% plasma cells (histology), >10% (diagnostic criterion) |
| Renal pathology | Cast nephropathy with multinucleate giant cells |
| Key cytokine | IL-6 |
| RANKL/OPG ratio | RANKL↑, OPG↓ → pure lytic disease |
| Difference from metastases | No periosteal reaction, no osteoblastic component, bone scan negative |
| Diagnostic gold standard | Bone marrow biopsy + SPEP/immunofixation |
| Leading cause of death | Infections (due to immunoparesis) |
| 2nd leading cause of death | Renal failure |
| Russell bodies = | Cytoplasmic Ig inclusions in plasma cells |
| Mott cells = | Plasma cells packed with Russell bodies |
Pathogenesis of multiple myeloma
multiple myeloma pathogenesis bone marrow microenvironment diagram RANKL osteoclast
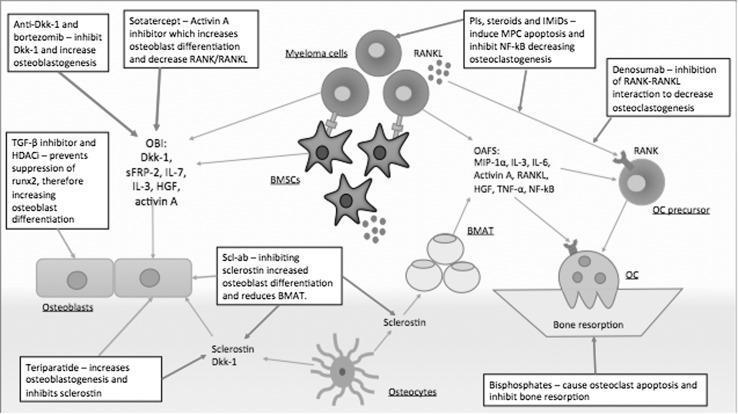
A pathophysiology diagram illustrating the mechanisms of Myeloma Bone Disease (MBD) and the effects of various pharmacological treatments within the bone marrow microenvironment. The diagram shows the uncoupling of bone remodeling through interactions between myeloma cells, bone marrow stromal cells (BMSCs), osteocytes, osteoblasts, and osteoclasts (OC). Myeloma cells and BMSCs produce osteoclast-activating factors (OAFs) like RANKL, MIP-1α, and TNF-α, which drive osteoclastogenesis and bone resorption. Simultaneously, myeloma cells and osteocytes release osteoblast inhibitory factors (OBIs) such as Dkk-1, sclerostin, and IL-7 to suppress bone formation. Key medical treatments and their targets are annotated: Denosumab (inhibiting RANK-RANKL), Bisphosphonates (inducing OC apoptosis), Scl-ab (inhibiting sclerostin to increase osteoblast differentiation), and Proteasome Inhibitors (PIs) and IMiDs (inhibiting NF-kB and inducing myeloma cell apoptosis). The diagram also highlights the role of sclerostin in increasing bone marrow adipose tissue (BMAT) and Teriparatide in promoting osteoblastogenesis.
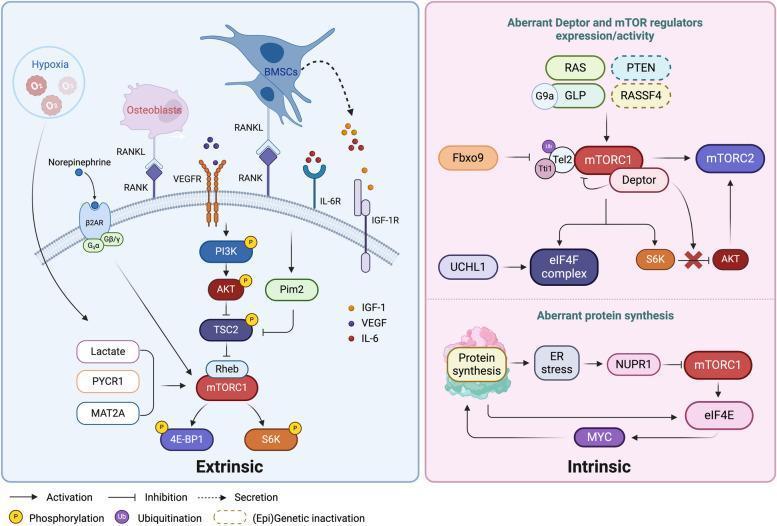
This pathophysiology diagram illustrates the extrinsic and intrinsic mechanisms regulating the mTOR signaling pathway in Multiple Myeloma (MM) cells. The 'Extrinsic' panel (left) depicts factors within the bone marrow microenvironment, including hypoxia, osteoblasts, and bone marrow stromal cells (BMSCs). These elements activate mTORC1 through various pathways: cytokine receptors (IL-6R, VEGFR, IGF-1R) stimulating the PI3K/AKT/TSC2/Rheb axis, RANK-RANKL interactions, and G-protein coupled receptor (β2AR) signaling. The 'Intrinsic' panel (right) focuses on cell-autonomous dysregulation, subdivided into aberrant regulator expression and aberrant protein synthesis. Key features include (epi)genetic alterations (RAS mutations, PTEN depletion, RASSF4 silencing), Deptor-mediated activation of mTORC2, and Fbxo9-mediated degradation of Tel2/Tti1. The lower intrinsic section shows how massive protein synthesis induces ER stress and NUPR1, which feeds back to inhibit mTORC1, while downstream eIF4E and MYC reinforce protein synthesis. Symbols indicate phosphorylation, ubiquitination, activation, and inhibition, highlighting the complex crosstalk between microenvironmental stimuli and intracellular genetic mutations in driving oncogenic protein synthesis.
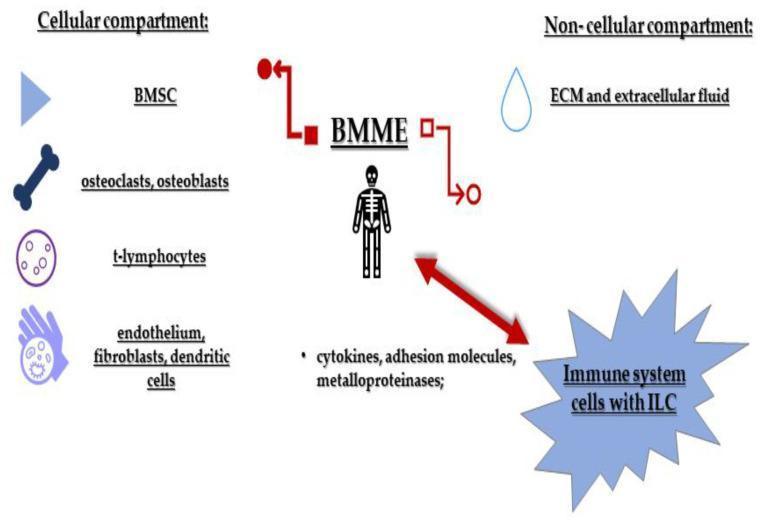
This medical schematic illustrates the components of the Bone Marrow Microenvironment (BMME), specifically in the context of Multiple Myeloma and Innate Lymphoid Cell (ILC) interaction. The diagram is divided into two primary sections: the 'Cellular compartment' and the 'Non-cellular compartment'. The cellular compartment includes bone marrow stromal cells (BMSC), osteoclasts/osteoblasts, t-lymphocytes, and a group consisting of endothelium, fibroblasts, and dendritic cells. The non-cellular compartment includes the extracellular matrix (ECM) and extracellular fluid. Central to the diagram is the BMME acronym, represented by a skeletal icon, indicating its anatomical location. A large bidirectional red arrow depicts a dynamic interaction between the BMME and 'Immune system cells with ILC'. This interaction involves key molecular mediators such as cytokines, adhesion molecules, and metalloproteinases. The figure emphasizes the complex signaling pathways and crosstalk between the bone marrow's structural and immune components that maintain tissue homeostasis or contribute to oncogenic progression in hematologic malignancies.
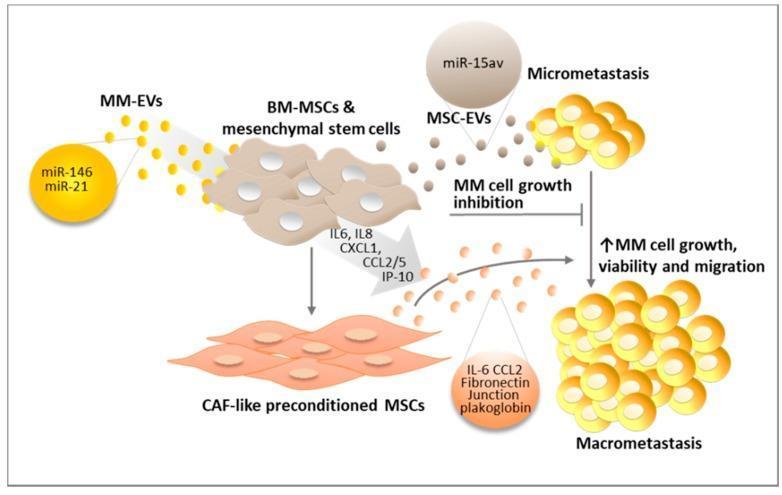
This pathophysiology diagram illustrates the signaling mechanism by which Multiple Myeloma-derived Extracellular Vesicles (MM-EVs) reprogram the bone marrow microenvironment to promote tumor progression. The central process depicts MM-EVs (yellow circles containing miR-146 and miR-21) acting upon Bone Marrow Mesenchymal Stem Cells (BM-MSCs, shown as tan irregular cells). Initially, normal MSC-EVs (grey circles containing miR-15av) inhibit MM cell growth, maintaining a state of micrometastasis. However, chronic exposure to MM-EVs and the secretion of pro-inflammatory factors (IL6, IL8, CXCL1, CCL2/5, IP-10) transform BM-MSCs into 'CAF-like preconditioned MSCs' (elongated orange cells). These preconditioned cells secrete a specific molecular profile (IL-6, CCL2, Fibronectin, Junction plakoglobin) that drives the transition from a dormant micrometastasis to an active macrometastasis. The diagram emphasizes a shift from tumor growth inhibition to increased MM cell growth, viability, and migration, highlighting the role of EV-mediated communication in cancer metastasis and niche education.
PATHOGENESIS OF MULTIPLE MYELOMA
Exam Answer (MBBS/MD - Full Detail)
STEP 1: CELL OF ORIGIN
- Multiple myeloma arises from terminally differentiated B lymphocytes - plasma cells
- Normal plasma cells derive from mature B cells that have undergone:
- Antigen stimulation
- Somatic hypermutation in germinal centres
- Heavy-chain class switching from IgM → IgG / IgA / IgD / IgE
- Plasma cells normally reside only in the bone marrow and express CD38 and CD138 (syndecan-1) on their surface
- They produce whole immunoglobulins (2 heavy + 2 light chains); normally κ:λ ratio = 2:1, with slight excess of light chains excreted
STEP 2: PRECLINICAL PROGRESSION (MGUS → MM)
Key concept: ALL myelomas arise from a preclinical MGUS phase
Normal plasma cell
        ↓  (somatic mutations / genetic hits)
    MGUS
    • <10% marrow plasma cells
    • M protein <3 g/dL
    • Asymptomatic
    • ~1% per year → MM
        ↓
  Smoldering Myeloma
    • 10-30% marrow plasma cells
    • M protein >3 g/dL
    • Asymptomatic
    • ~75% progress to MM over 15 years
        ↓
  Multiple Myeloma (symptomatic)
    • ≥10% clonal plasma cells
    • M protein present
    • CRAB features
- RAS mutations
- MYC abnormalities
STEP 3: GENETIC/CHROMOSOMAL ABNORMALITIES
A. Primary Cytogenetic Abnormalities (Early - present from MGUS stage)
| Abnormality | Frequency | Effect | Prognosis |
|---|---|---|---|
| IgH translocations (chromosome 14q32) | ~40% of MM | Fuse IgH locus to oncogenes | Variable |
| - t(11;14) - CCND1/Cyclin D1 | Most common IgH translocation | Dysregulates Cyclin D1 → ↑cell proliferation | Favourable |
| - t(4;14) - FGFR3/MMSET | ~15% | Activates FGFR3 tyrosine kinase | Adverse |
| - t(14;16) - MAF | ~5% | Transcription factor MAF overexpression | Adverse |
| Trisomies (Hyperdiploidy) | ~40% | Odd-numbered chromosome trisomies | Favourable |
| Both IgH translocations + trisomies | ~15% | Combined | Variable |
Key: Dysregulation of D-type cyclins (Cyclin D1, Cyclin D3) is a near-universal feature of MM, driving G1→S cell cycle progression
B. Secondary Cytogenetic Abnormalities (Late - appear during symptomatic MM)
| Abnormality | Effect |
|---|---|
| del(17p) - TP53 deletion | Loss of tumour suppressor → most aggressive, poor prognosis |
| del(13q) - RB1 | Adverse prognosis |
| del(1p) | Disease progression |
| Amplification of 1q21 (CKS1B) | Aggressive disease, adverse prognosis |
| MYC translocations | Late; very aggressive disease |
STEP 4: BONE MARROW MICROENVIRONMENT - THE ENGINE OF MYELOMA GROWTH
4A. Cytokine-Driven Plasma Cell Survival
| Cytokine | Source | Effect on Myeloma |
|---|---|---|
| IL-6 | Stromal cells, fibroblasts, macrophages, osteoclasts | Principal growth + survival factor; activates JAK-STAT3, MAPK, PI3K/AKT pathways |
| VEGF | Myeloma cells, stroma | Angiogenesis; myeloma cell growth |
| IGF-1 | Stromal cells | Anti-apoptotic signalling via PI3K/AKT |
| SDF-1α (CXCL12) | Stroma | Homing of myeloma cells to marrow via CXCR4 |
| TNF-α | Stroma | Upregulates adhesion molecules; NF-κB activation |
| HGF | Stroma | Osteoclast activation; myeloma cell motility |
Exam key: IL-6 is the master cytokine. Myeloma cells are addicted to IL-6 for survival.
4B. Adhesion Molecules (Tumour-Stroma Crosstalk)
- Myeloma cells express VLA-4 (α4β1 integrin) and CD44
- Bind to VCAM-1 and fibronectin on stromal cells
- This physical contact triggers IL-6 secretion from stroma → bidirectional amplification loop
- Also activates NF-κB in myeloma cells → promotes survival and drug resistance
4C. Angiogenesis
- Myeloma cells secrete VEGF, FGF-2, HGF → neovascularisation of marrow
- Increased vascularity supports tumour growth and correlates with disease stage
- Bone marrow microvessel density is a prognostic marker
STEP 5: MECHANISMS OF BONE DESTRUCTION (Most Exam-Tested Section)
The RANKL/OPG Axis
Core concept: Pure osteolytic disease due to osteoclast activation + osteoblast suppression simultaneously
- Myeloma cells and stromal cells ↑ RANKL (Receptor Activator of NF-κB Ligand)
- Myeloma cells ↓ OPG (Osteoprotegerin - the decoy receptor for RANKL)
- Result: RANKL/OPG ratio ↑↑ → binds RANK on osteoclast precursors → osteoclastogenesis and activation
- Activated osteoclasts resorb bone → release Ca²⁺ → hypercalcaemia
- Osteoblasts simultaneously suppressed → no reactive new bone formation
Osteoclast-Activating Factors (OAFs) from myeloma cells:
| Factor | Role |
|---|---|
| RANKL | Primary osteoclast activator |
| MIP-1α (Macrophage Inflammatory Protein-1α) | Recruits osteoclast precursors |
| IL-1β | Osteoclast activation |
| IL-3 | Dual: activates osteoclasts + suppresses osteoblasts |
| IL-6 | Osteoclast differentiation |
| TNF-α | RANKL synergist |
| SDF-α | Osteoclast recruitment |
Osteoblast-Inhibitory Factors (OBIs) from myeloma cells:
| Factor | Mechanism |
|---|---|
| DKK-1 (Dickkopf-1) | Inhibits Wnt signalling → blocks osteoblast differentiation (most important) |
| Sclerostin | Produced by osteocytes; further inhibits Wnt/osteoblast differentiation; also increases bone marrow adipose tissue |
| IL-7 | Osteoblast suppression |
| IL-3 | Suppresses osteoblast differentiation |
| sFRP-2 | Wnt antagonist |
| HGF | Osteoblast inhibition |
| Activin A | Inhibits osteoblastogenesis; increases osteoclastogenesis |
STEP 6: M PROTEIN PRODUCTION AND ITS CONSEQUENCES
Consequences of M Protein Overproduction:
M Protein excess
     │
     ├─── Whole Ig (IgG/IgA) ──→ Hyperviscosity syndrome
     │                            (especially IgA - polymeric)
     │
     ├─── Free Light Chains ──→ Bence Jones proteinuria
     │    (kappa/lambda)         → Cast nephropathy
     │                           → Fanconi syndrome (κ LC)
     │                           → AL Amyloidosis
     │
     └─── Misfolded Ig in ER ──→ ER stress → apoptosis if
                                  proteasome overwhelmed
                                  (basis of proteasome inhibitor therapy)
Why Myeloma Cells are Sensitive to Proteasome Inhibitors:
- Plasma cells produce massive amounts of immunoglobulin
- Misfolded heavy and light chains are a normal byproduct - typically cleared by the ubiquitin-proteasome system
- Myeloma cells are even more dependent on proteasome function due to unbalanced heavy/light chain synthesis
- Bortezomib (proteasome inhibitor) blocks this → misfolded proteins accumulate → ER stress → apoptosis
STEP 7: IMMUNOPARESIS - DEFECTIVE HUMORAL IMMUNITY
- Despite high total serum immunoglobulin (M protein), production of functional, specific antibodies is profoundly depressed
- Myeloma cells suppress normal B cell function through unknown mechanisms
- Normal polyclonal immunoglobulins are markedly reduced
- Results in susceptibility to encapsulated bacteria (Streptococcus pneumoniae, H. influenzae, Klebsiella)
- Bacterial infections are the leading cause of death in MM
STEP 8: MECHANISMS OF RENAL FAILURE
| Mechanism | Pathology |
|---|---|
| Cast nephropathy (most important) | Free LCs + Tamm-Horsfall protein → casts in distal tubules/collecting ducts → obstruction, giant cell reaction |
| Proximal tubular toxicity | LC overload → cubilin receptor-mediated endocytosis overloaded → lysosomal rupture → NF-κB → IL-6/IL-8/MCP-1 release → tubular injury, fibrosis; Fanconi syndrome |
| AL Amyloidosis | κ or λ LC deposited as amyloid in glomeruli and vessel walls → Congo red +ve, apple-green birefringence |
| Hypercalcaemia | Dehydration, nephrocalcinosis, renal vasoconstriction |
| Pyelonephritis | Secondary to immunoparesis |
| Hyperviscosity | Reduced renal perfusion |
Renal failure is the 2nd leading cause of death (after infections)
COMPLETE PATHOGENESIS FLOW DIAGRAM
NORMAL B CELL
     ↓  Antigen stimulation + class switching
PLASMA CELL
     ↓  Primary genetic hits (IgH translocations / trisomies)
MGUS  ──→ 1% per year
     ↓  Secondary hits (RAS mutation, MYC abnormality)
SMOLDERING MYELOMA ──→ 75% over 15 years
     ↓  Further mutations (del17p, del13q, 1q amp)
MULTIPLE MYELOMA
     │
     ├─ Bone marrow stroma ──→ IL-6 loop ──→ plasma cell growth/survival
     │
     ├─ RANKL↑ / OPG↓ ──→ Osteoclast↑ ──→ Lytic lesions + Hypercalcaemia
     │   DKK-1 / Sclerostin ──→ Osteoblast↓ ──→ No reactive bone
     │
     ├─ M protein ──→ Bence Jones LCs ──→ Cast nephropathy → Renal failure
     │             ──→ AL Amyloidosis
     │             ──→ Hyperviscosity (IgA/IgG)
     │
     ├─ Marrow replacement ──→ Anaemia / Leukopenia / Thrombocytopenia
     │
     └─ Immunoparesis ──→ ↓Normal Ig ──→ Bacterial infections (→ DEATH)
HIGH-YIELD EXAM SUMMARY TABLE
| Pathogenesis Component | Key Points |
|---|---|
| Cell of origin | Plasma cell (post-germinal centre B cell) |
| Precursor lesion | MGUS → Smoldering MM → MM |
| Primary genetics | IgH translocations (14q32): t(11;14) good, t(4;14)/t(14;16) bad; Hyperdiploidy = good |
| Secondary genetics | del(17p), del(13q), 1q amplification, MYC = all bad |
| Key survival cytokine | IL-6 (from stroma, fibroblasts, macrophages) |
| Key bone destruction axis | RANKL↑ / OPG↓ → osteoclast activation |
| Key osteoblast inhibitor | DKK-1 (inhibits Wnt signalling) |
| Key osteoclast activator | RANKL, MIP-1α, IL-1β, IL-6 |
| Renal pathology (main) | Cast nephropathy (Bence Jones + Tamm-Horsfall protein) |
| Immune defect | Immunoparesis - ↓functional Ig despite ↑total Ig |
| Basis of bortezomib action | Plasma cells overwhelmed by misfolded Ig → proteasome inhibition → ER stress → apoptosis |
| Basis of lenalidomide | Redirects ubiquitin ligases → degrades myeloma survival proteins |
| Basis of bisphosphonates | Inhibit osteoclasts → reduce fractures + hypercalcaemia |