
Short note on physiology of vision
physiology of vision retina phototransduction diagram
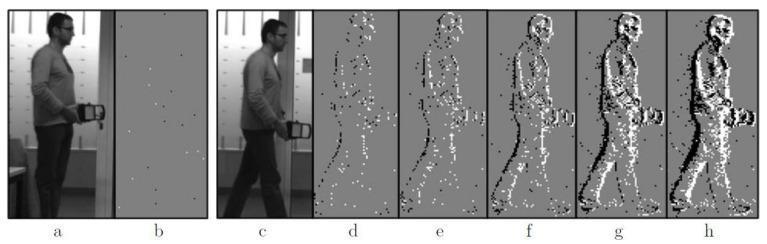
This diagnostic and pathophysiological diagram illustrates the functionality of a silicon retina sensor, an event-based vision system that mimics the mammalian retina's biological response to motion. The image presents a comparison between a conventional monochrome sensor and the silicon retina. (a) and (c) show standard grayscale images of a human subject stationary and walking. (b) demonstrates that without movement, the event-based sensor remains virtually silent, showing only sparse noise. Panels (d) through (h) visualize the temporal accumulation of 'ON' (black pixels) and 'OFF' (white pixels) neural-inspired events triggered by the walking person over increasing time windows: 5 ms, 10 ms, 20 ms, 40 ms, and 60 ms. The sequence highlights how edge detection and object contours become progressively more refined and dense as more spikes are accumulated. This illustrates key concepts in neuromorphic engineering and sensory physiology, specifically how the retina processes dynamic change rather than static luminance, which is critical for medical technology applications in vision prosthetics and real-time motion analysis.
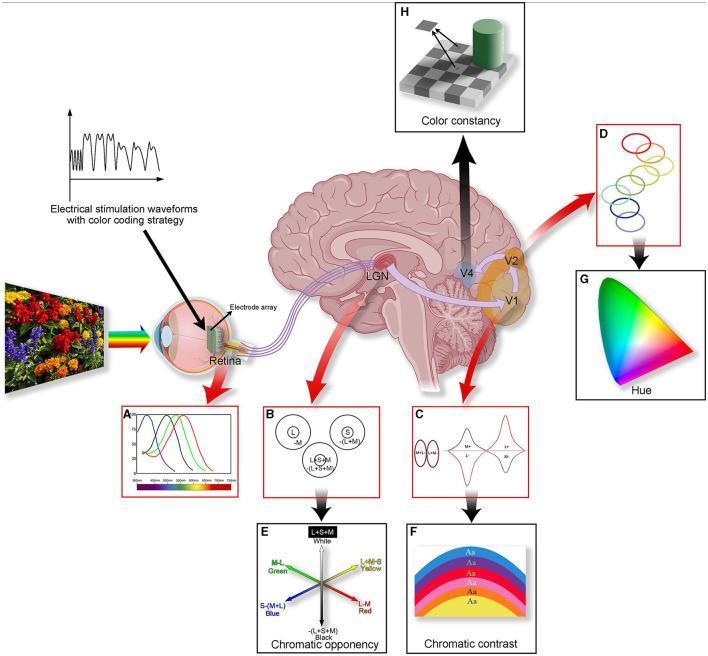
A comprehensive neuroanatomical and physiological infographic illustrating the human color visual pathway. Central to the image is a sagittal view of the human brain and eye, showing signal transmission from the retina through the lateral geniculate nucleus (LGN) to the visual cortex (V1, V2, and V4). The diagram is divided into sections covering physiology (A-D) and perception (E-H). Section A displays the absorption spectra of L, M, and S cone cells. Section B and E illustrate chromatic opponency, showing how the LGN compares cone signals to create red-green and blue-yellow channels. Section C and F focus on V1 processing, depicting 'double-opponent' cells responsible for chromatic contrast calculations. Section D and G highlight V2 cortical bands and their role in hue representation. Finally, Section H shows V4's involvement in color constancy. The infographic also includes a conceptual interface for an electrode array on the retina, suggesting applications in artificial vision and neural coding strategies for vision restoration.
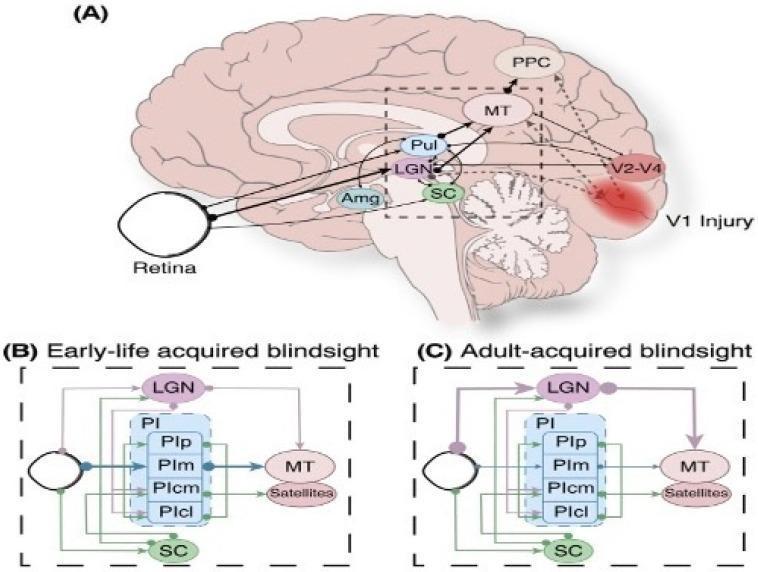
Educational diagram illustrating the neuroanatomical pathways of subcortical vision and blindsight following primary visual cortex (V1) injury. (A) A medial view of the human brain shows retinal projections to the amygdala (Amg), lateral geniculate nucleus (LGN), and superior colliculus (SC). Secondary pathways extend from the LGN to visual areas V2-V4, the middle temporal area (MT), and the posterior parietal cortex (PPC). A red-shaded region indicates V1 injury, with dashed lines representing resulting neuronal degeneration. (B, C) Comparative flowcharts illustrate hypothesized pathways for early-life versus adult-acquired blindsight. These diagrams detail the circuit between the retina, SC, LGN, and subdivisions of the inferior pulvinar (PIp, PIm, PIcm, PIcl) projecting to the MT area. Line thickness indicates relative projection strength, highlighting increased connectivity and plasticity in the pediatric brain (B) compared to the adult brain (C). This illustration serves to explain compensatory mechanisms in visual perception despite cortical damage.
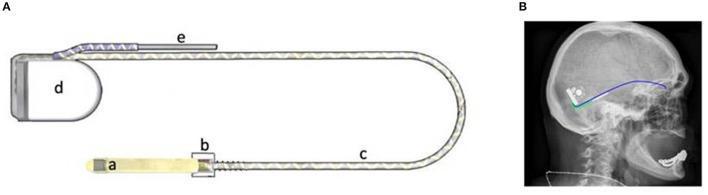
This educational graphic illustrates the components and surgical placement of the Retina Implant Alpha AMS, a subretinal visual prosthesis. Figure A is a schematic diagram showing the device's hardware: (a) a distal polyimide foil containing the CMOS microchip with 1,600 pixel cells for subretinal stimulation; (b) a scleral patch on a ceramic chip for trans-scleral anchoring; (c) a flexible, looped silicone power cable; (d) a retroauricular subdermal ceramic housing containing inductive coupling coils for transdermal power; and (e) a return electrode. Figure B is a lateral skull radiograph demonstrating the clinical positioning of the implant. The radiopaque silicone power cable is seen routed along the skull's curvature beneath the temporal muscle, connecting the orbital implant site to the ceramic housing and return electrode located in the temporal/retroauricular region. This visual highlights the integration of microelectronics with surgical anatomy for restoring vision in patients with outer retinal degeneration, such as retinitis pigmentosa.
visual pathway optic chiasm lateral geniculate nucleus
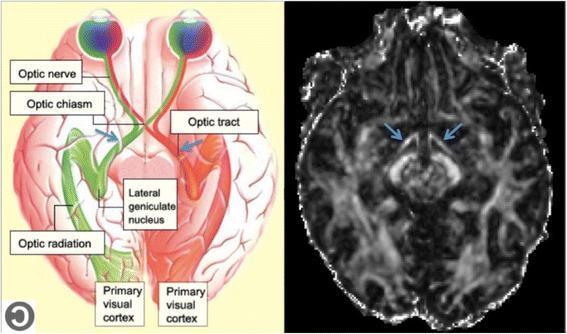
The image consists of two panels illustrating the human visual pathway. The left panel is an anatomical diagram showing a superior view of the brain with the visual system highlighted. It labels the eyes, optic nerves, optic chiasm, optic tracts (indicated by blue arrows), lateral geniculate nucleus (LGN), optic radiations, and primary visual cortex in the occipital lobes. Color-coded pathways demonstrate the decussation of nasal retinal fibers at the optic chiasm and the ipsilateral projection of temporal fibers. The right panel is a diagnostic image featuring an axial slice of a Diffusion Tensor Imaging (DTI) Fractional Anisotropy (FA) map at the level of the midbrain and optic tracts. On this grayscale map, white matter tracts with high anisotropy appear hyperintense (bright). Blue arrows specifically point to the bilateral optic tracts as they exit the optic chiasm and course posteriorly toward the LGN. This dual-panel presentation serves to correlate schematic anatomical knowledge with clinical neuroimaging used to assess white matter integrity in pathological conditions affecting the visual pathways.
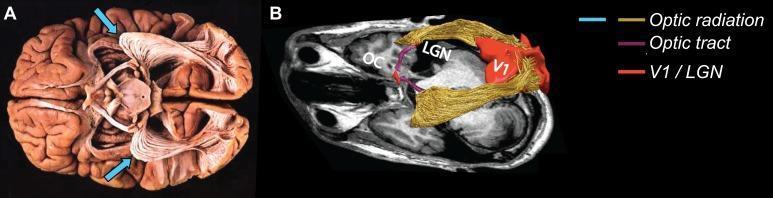
This dual-panel image provides a comparative view of the visual pathway's white matter tracts through anatomical dissection and neuroimaging. Panel A shows a postmortem gross dissection of a human brain from an inferior-lateral perspective. It highlights the optic radiation (OR) as prominent, fan-shaped white fibrous bundles. Blue arrows specifically denote Meyer's loop, the anterior-most extension of the optic radiation that curves around the temporal horn of the lateral ventricle. Panel B presents an in vivo diagnostic representation using 3D tractography overlaid on an axial MRI slice. The visual pathway is color-coded for educational clarity: the optic chiasm (OC) is visible anteriorly; the optic tracts are shown in purple extending toward the lateral geniculate nucleus (LGN); the optic radiations are pseudo-colored in gold, demonstrating their projection toward the primary visual cortex (V1), which is highlighted in red in the occipital lobe. The image serves as an educational tool for neuroanatomy, neuro-ophthalmology, and radiology to illustrate the complex spatial trajectory of axons carrying visual information from the diencephalon to the cortex.
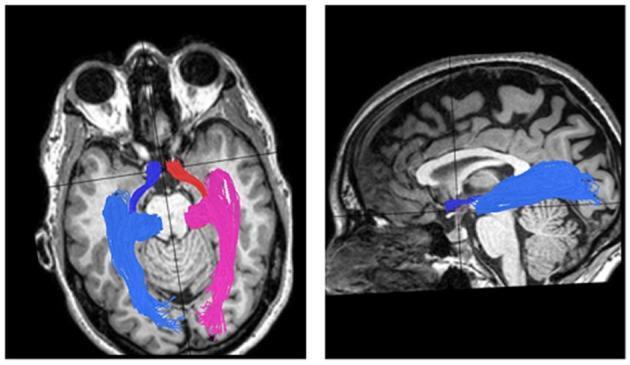
This diagnostic image demonstrates the reconstruction of human visual pathways using Diffusion Tensor Imaging (DTI) tractography superimposed on T1-weighted MRI scans. The left panel shows an axial view of the optic tracts and optic radiations. The right optic tract is color-coded red, and the left is dark blue, both originating near the optic chiasm and extending posteriorly to the lateral geniculate nucleus (LGN). The subsequent optic radiations are depicted in pink (right) and light blue (left), projecting from the LGN toward the calcarine cortex in the occipital lobes. The right panel displays a sagittal view focused on the left visual pathway (blue), illustrating the longitudinal trajectory from the anterior chiasm region, through the temporal lobe (including Meyer’s loop), to the posterior primary visual cortex. This visualization is used in neuroimaging to evaluate the structural integrity and connectivity of white matter tracts in clinical conditions such as optic neuritis, multiple sclerosis, or space-occupying lesions like meningiomas.
Physiology of Vision
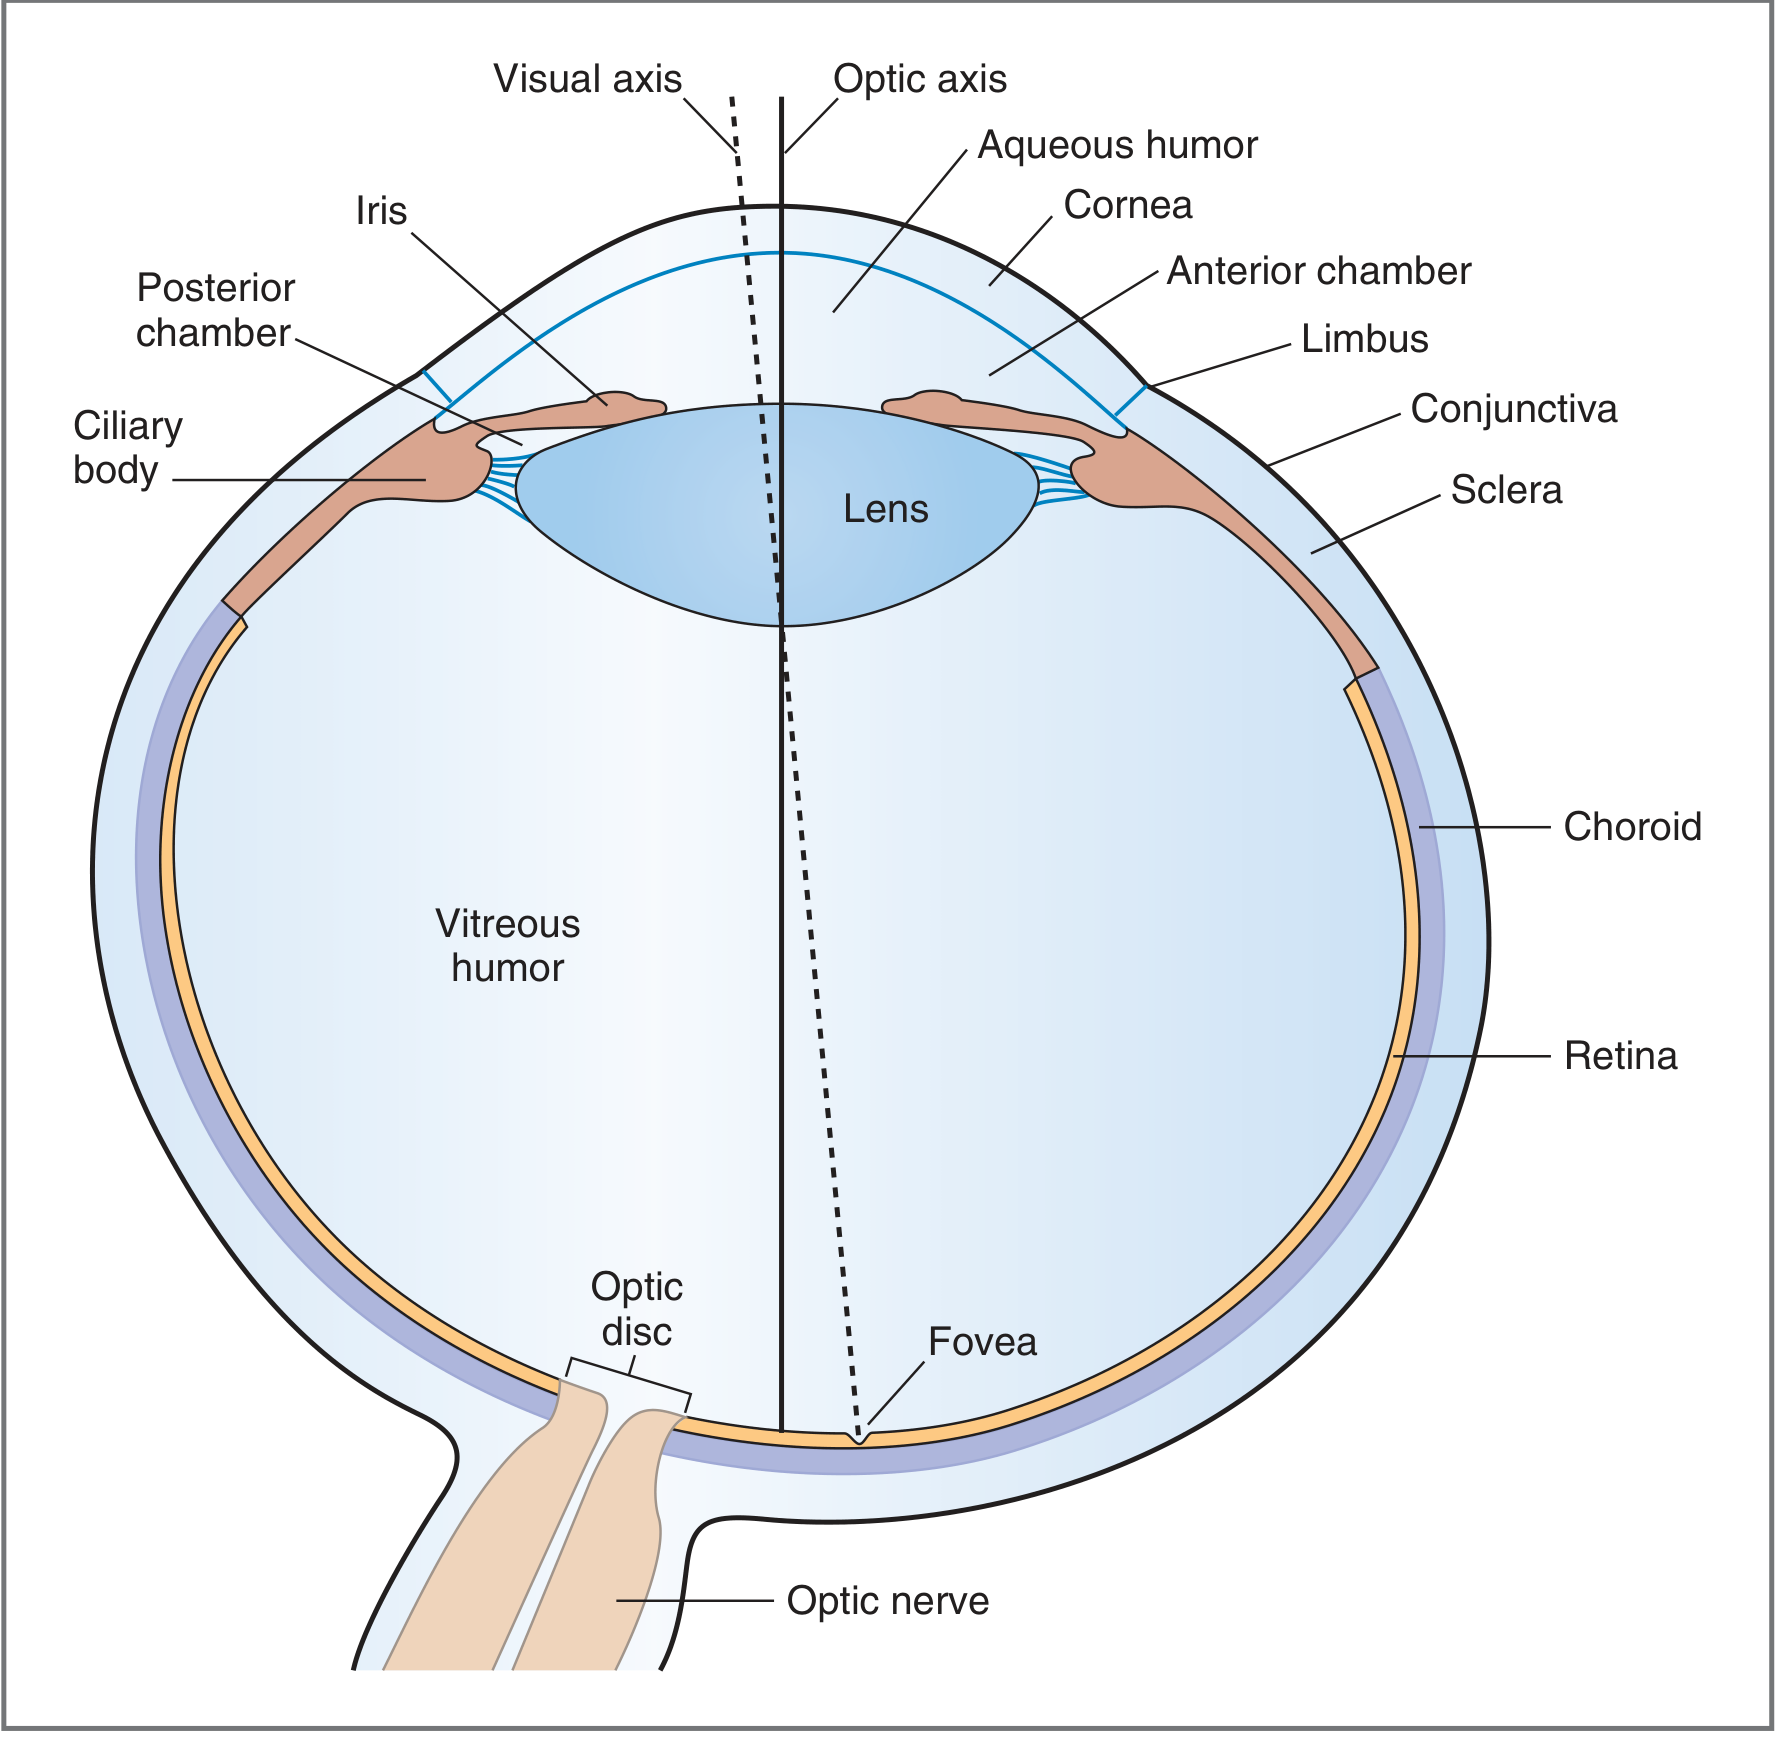
1. Structure of the Eye
- Outer (fibrous): Cornea, sclera, conjunctiva
- Middle (vascular): Iris, ciliary body, choroid
- Inner (neural): Retina
2. Photoreceptors: Rods and Cones
| Feature | Rods | Cones |
|---|---|---|
| Light sensitivity | High (low threshold) | Low (high threshold) |
| Vision type | Scotopic (night) | Photopic (day) |
| Visual acuity | Low | High |
| Color vision | No | Yes |
| Dark adaptation | Slow, large magnitude | Fast, small magnitude |
| Foveal presence | Absent | Dense |
| Distribution | Peripheral > central | Central > peripheral |
3. Phototransduction
Rhodopsin and the Visual Pigment
- Opsin (the protein, "scotopsin" in rods)
- 11-cis retinal (a derivative of Vitamin A) - the chromophore
- Light photon isomerizes 11-cis retinal → all-trans retinal, destabilizing the rhodopsin molecule.
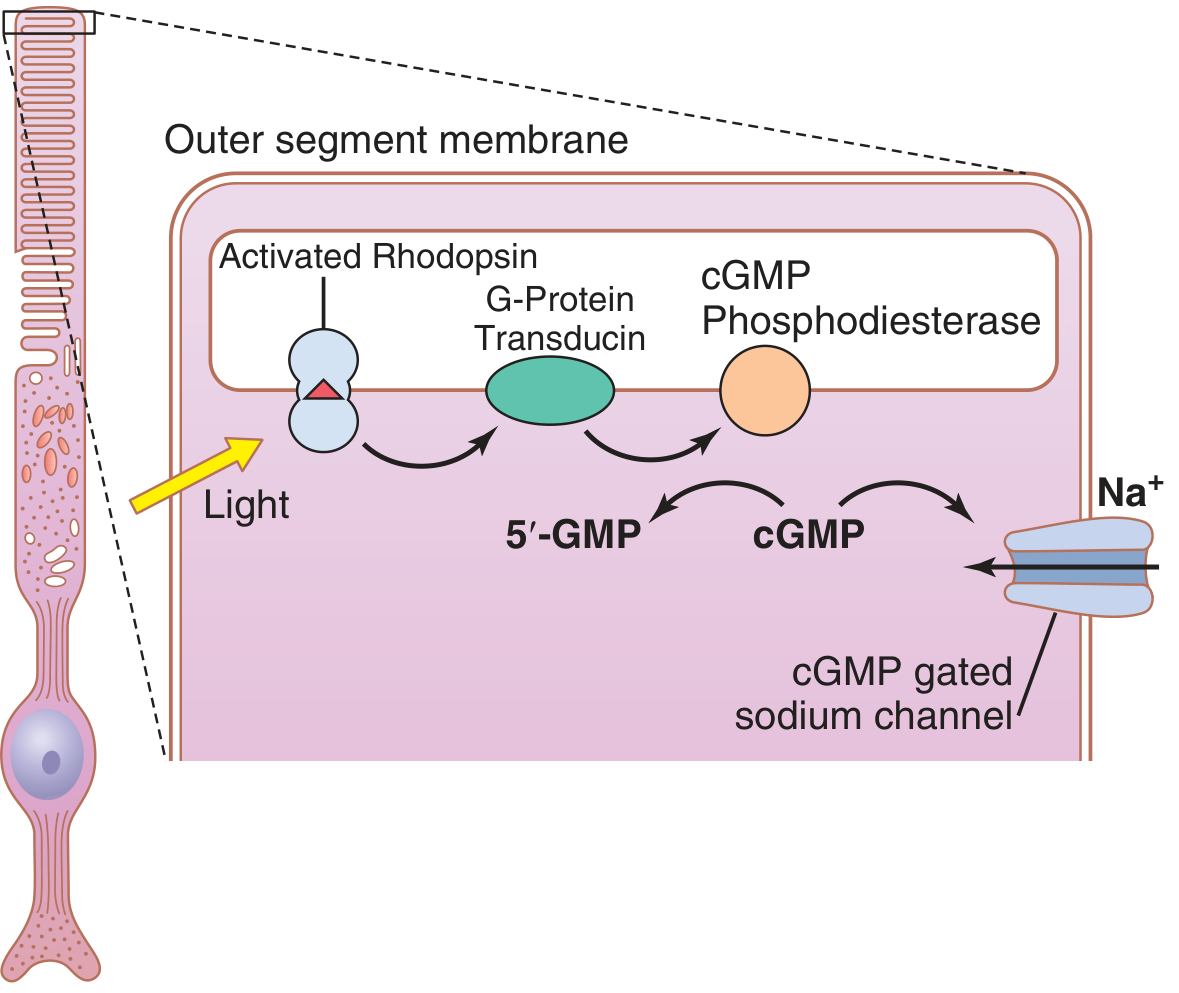
- Rhodopsin rapidly decomposes: Bathorhodopsin (psec) → Lumirhodopsin (μsec) → Metarhodopsin I (msec) → Metarhodopsin II (sec). Metarhodopsin II (activated rhodopsin) is the active form.
- Activated rhodopsin binds and activates transducin (a G-protein).
- Transducin activates cGMP phosphodiesterase, which hydrolyzes cGMP → 5'-GMP.
- Falling cGMP closes the cGMP-gated Na⁺ channels.
- Net Na⁺ efflux (via the Na⁺/K⁺-ATPase) causes hyperpolarization (membrane potential approaches -70 to -80 mV).
- Hyperpolarization reduces glutamate release from the photoreceptor terminal.
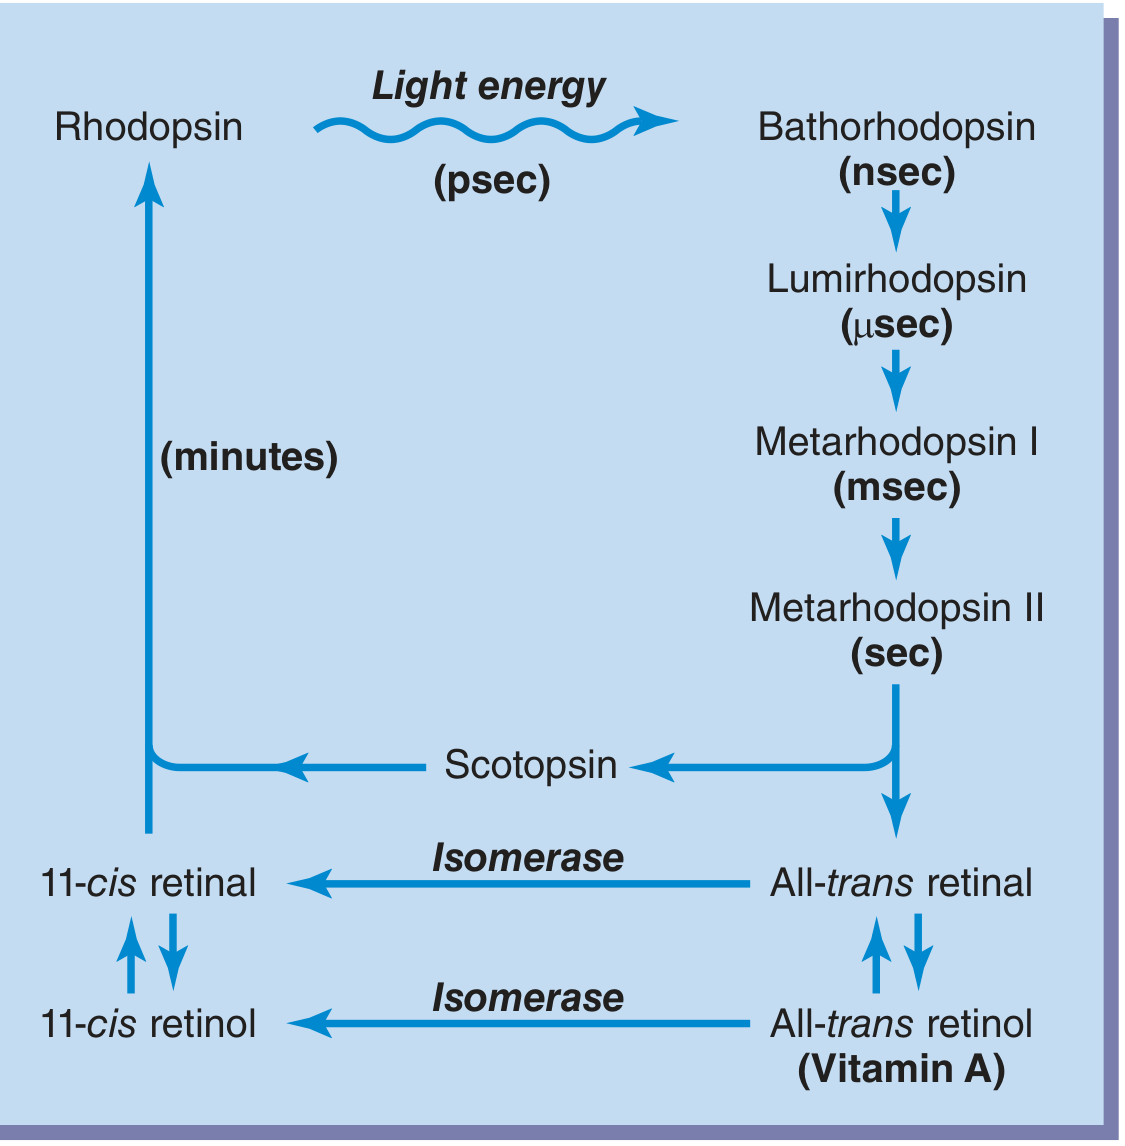
Rhodopsin Regeneration
4. Retinal Processing
On-Center / Off-Surround Receptive Fields
- On-center, off-surround: Light in the center excites, light in the surround inhibits.
- Off-center, on-surround: The reverse.
5. Visual Pathway
- Nasal retinal fibers (receiving temporal visual field) - cross at the optic chiasm.
- Temporal retinal fibers (receiving nasal visual field) - do not cross, travel ipsilaterally.
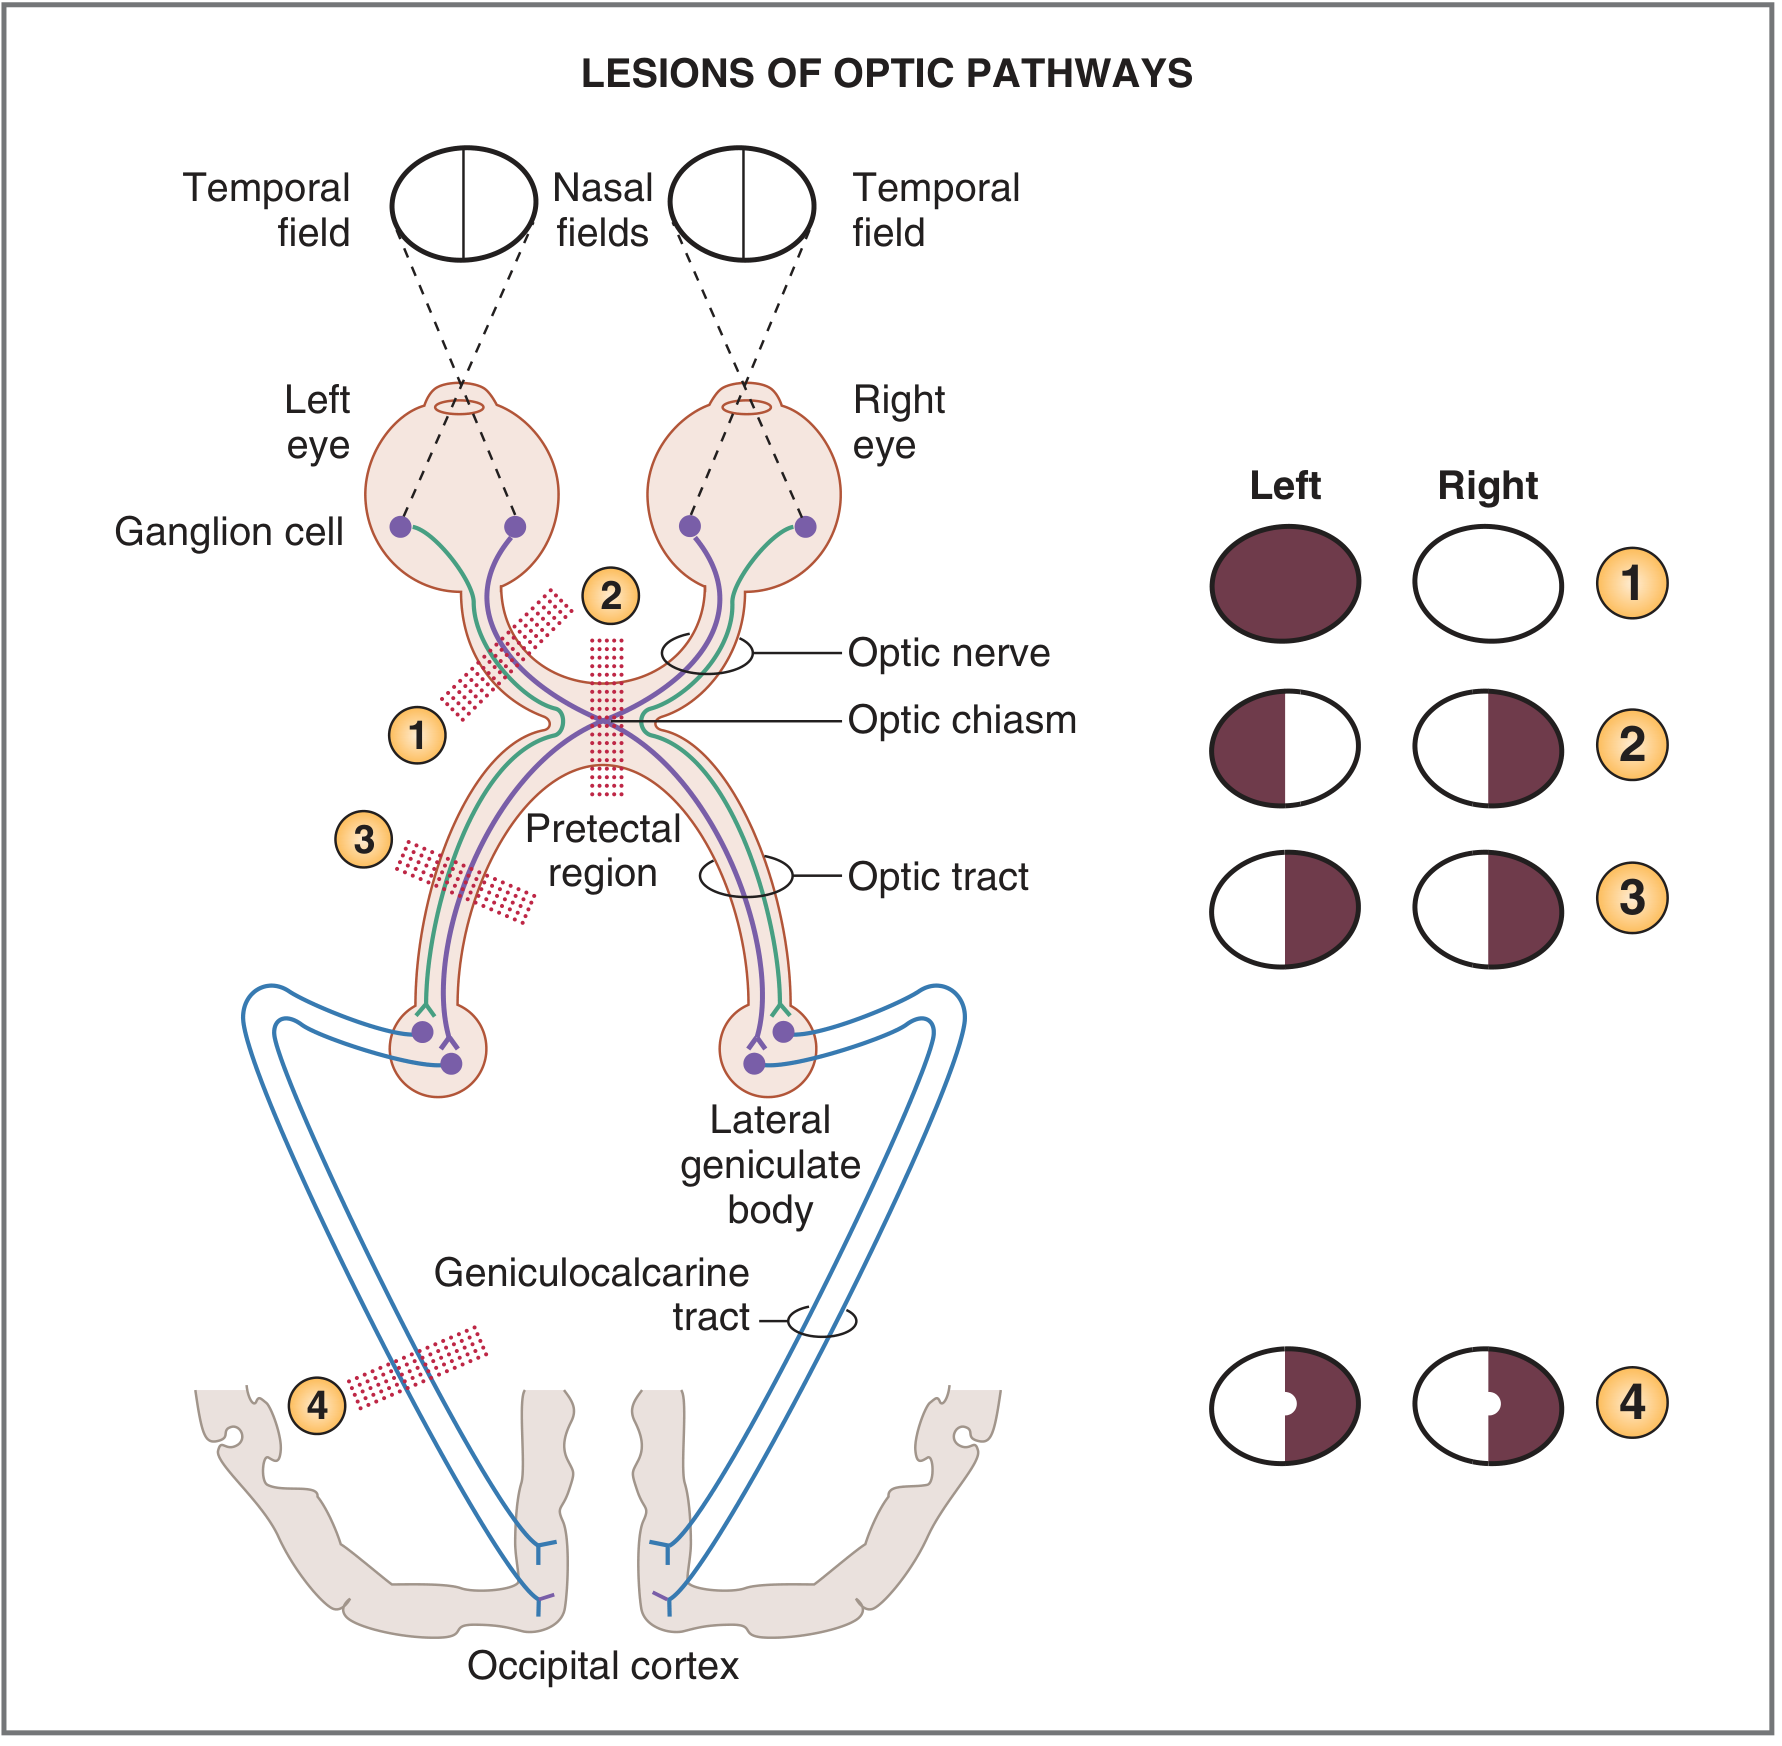
Visual Field Defects (Clinically Important)
| Lesion Site | Deficit |
|---|---|
| Optic nerve | Monocular blindness (ipsilateral eye) |
| Optic chiasm (central) | Bitemporal heteronymous hemianopia |
| Optic tract | Contralateral homonymous hemianopia |
| Geniculocalcarine tract / Visual cortex | Contralateral homonymous hemianopia with macular sparing |
6. Cortical Processing
- Ventral stream (V1 → V4 → inferotemporal cortex): "What" pathway - object recognition, color, form.
- Dorsal stream (V1 → V5/MT → posterior parietal cortex): "Where/how" pathway - motion, spatial location, visuomotor guidance.
7. Light and Dark Adaptation
- Pupillary reflex: Rapid (~1 sec), ~30-fold range.
- Photopigment regeneration: Slow (20-40 min for full dark adaptation), primarily rods. The dark adaptation curve shows an early phase (cone adaptation) and a later, more sensitive phase (rod adaptation).
- Neural adaptation: Fast, occurs at bipolar/amacrine/ganglion cell levels; smaller magnitude.
Summary
Light → Cornea/Lens (optics) → Retina (photoreception: rhodopsin → cGMP ↓ → Na⁺ channel closure → hyperpolarization → ↓ glutamate) → Retinal cells (bipolar/ganglion, center-surround) → Optic nerve → Chiasm → Optic tract → LGN → V1 → Association cortex (ventral/dorsal streams) → Perception
Write short note on physiology of vision for pg ophthalmology exam
retinal layers photoreceptor rods cones bipolar ganglion cells diagram
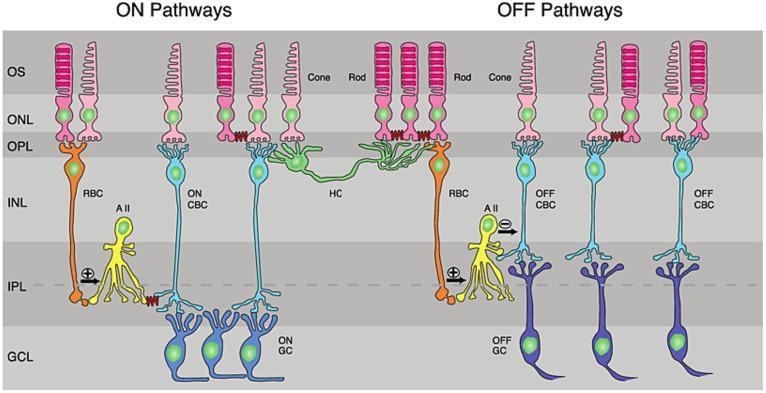
This pathophysiology diagram illustrates the functional retinal circuitry of the ON and OFF pathways. The vertical organization of the retina is shown across six distinct layers: Outer Segments (OS), Outer Nuclear Layer (ONL), Outer Plexiform Layer (OPL), Inner Nuclear Layer (INL), Inner Plexiform Layer (IPL), and Ganglion Cell Layer (GCL). The diagram depicts key cell types and their synaptic relationships: Rods and Cones (photoreceptors) in the outer layers; Rod Bipolar Cells (RBC) and Cone Bipolar Cells (ON CBC and OFF CBC) in the INL; Horizontal Cells (HC) providing lateral inhibition in the OPL; and AII Amacrine Cells facilitating signal transfer. The ON pathway demonstrates rod signals traversing RBCs to AII cells, which سپس stimulate ON Ganglion Cells (ON GC). The OFF pathway shows direct transmission from photoreceptors via OFF CBCs to OFF Ganglion Cells (OFF GC). This schematic serves as a high-level educational resource for understanding neuro-ophthalmology, visual signal processing, and the stratification of the human retina.
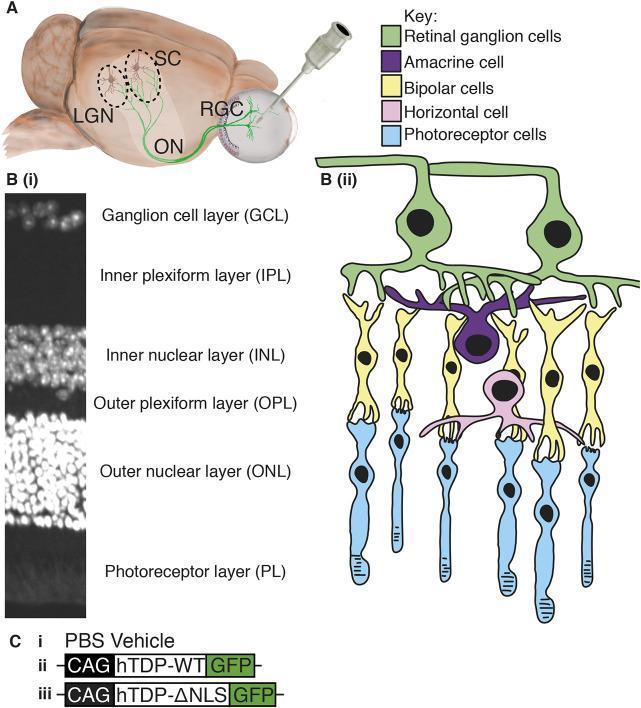
This composite educational graphic details the neuroanatomy and experimental modeling of the mammalian visual system. Panel A features an anatomical diagram of an eye model and brain, illustrating an intravitreal injection. It highlights retinal ganglion cells (RGCs) extending axons through the optic nerve (ON) to the lateral geniculate nucleus (LGN) and superior colliculus (SC). Panel B(i) shows a diagnostic DAPI-stained histological cross-section of the retina, identifying six distinct layers: Ganglion cell layer (GCL), Inner plexiform layer (IPL), Inner nuclear layer (INL), Outer plexiform layer (OPL), Outer nuclear layer (ONL), and Photoreceptor layer (PL). Panel B(ii) provides a matching color-coded cellular schematic showing the vertical and horizontal organization of RGCs (green), amacrine cells (purple), bipolar cells (yellow), horizontal cells (pink), and photoreceptors (blue). Panel C lists experimental genetic constructs (PBS vehicle, hTDP-WT, and hTDP-ΔNLS tagged with GFP) used for disease modeling. This visual resource is designed for intermediate to advanced study of ocular anatomy, histopathology, and neurodegenerative disease research methodology.
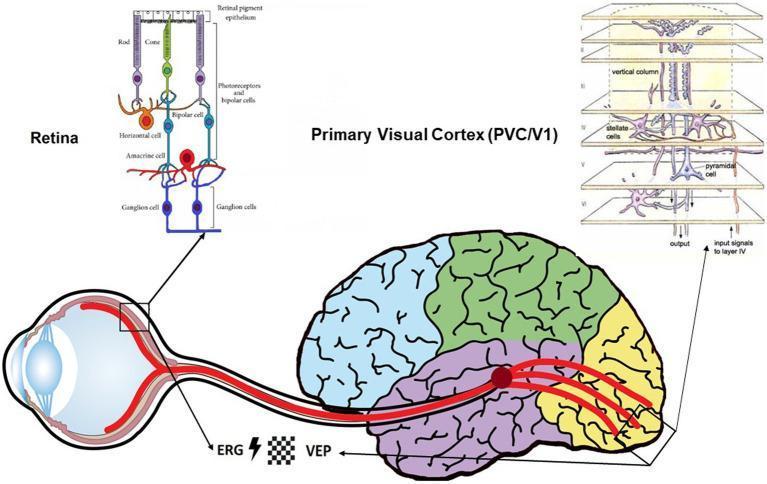
This medical schematic illustrates the visual pathway from the eye to the brain, highlighting the structural hierarchy of the retina and the primary visual cortex (PVC/V1). The diagram consists of three main parts: an anatomical overview and two detailed histological schematics. The anatomical overview shows the eye connected to the visual cortex via the optic nerve, labeled with electrophysiological markers ERG (Electroretinogram) and VEP (Visual Evoked Potential) alongside flash and checkerboard stimuli symbols. The retinal schematic details the vertical organization of the retinal pigment epithelium, photoreceptors (rods and cones), horizontal cells, bipolar cells, amacrine cells, and ganglion cells. The PVC/V1 schematic demonstrates the neocortical cytoarchitecture, organized into layers I through VI. It depicts key cell types including stellate cells in layer IV and pyramidal cells in layer V, organized into a vertical column. The diagram illustrates signal input specifically to layer IV and the subsequent output from deeper layers. This infographic serves as a comparative tool for understanding neuro-retinal continuity and the use of visual electrophysiology in diagnosing neurodegenerative and psychiatric disorders.
visual pathway optic chiasm optic tract lateral geniculate nucleus visual cortex
This diagnostic image demonstrates the reconstruction of human visual pathways using Diffusion Tensor Imaging (DTI) tractography superimposed on T1-weighted MRI scans. The left panel shows an axial view of the optic tracts and optic radiations. The right optic tract is color-coded red, and the left is dark blue, both originating near the optic chiasm and extending posteriorly to the lateral geniculate nucleus (LGN). The subsequent optic radiations are depicted in pink (right) and light blue (left), projecting from the LGN toward the calcarine cortex in the occipital lobes. The right panel displays a sagittal view focused on the left visual pathway (blue), illustrating the longitudinal trajectory from the anterior chiasm region, through the temporal lobe (including Meyer’s loop), to the posterior primary visual cortex. This visualization is used in neuroimaging to evaluate the structural integrity and connectivity of white matter tracts in clinical conditions such as optic neuritis, multiple sclerosis, or space-occupying lesions like meningiomas.
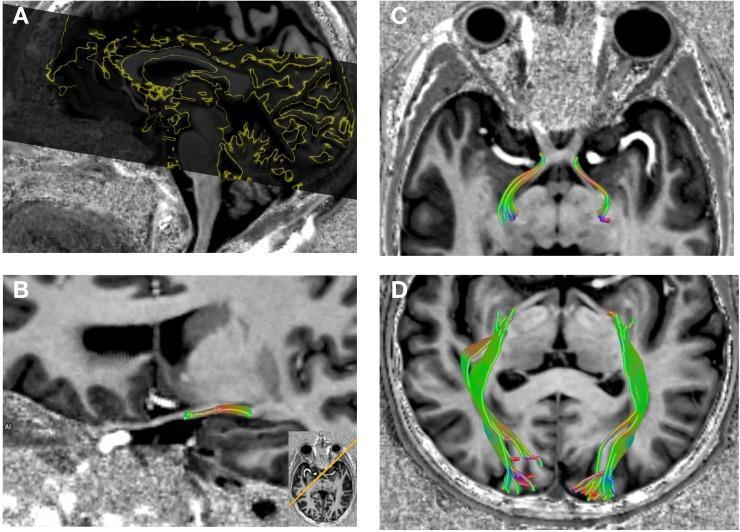
This diagnostic image composite demonstrates the visual pathway using 7T high-resolution MRI and Diffusion Tensor Imaging (DTI) with selective deterministic tractography. Panel A shows a sagittal view with a DTI slab overlay delineated by yellow contours, covering the extent of the visual system. Panel B displays a sagittal reconstruction highlighting the optic tract as a colored fiber bundle. Panel C provides a coronal view of the bilateral optic tracts as they emerge from the optic chiasm and extend toward the lateral geniculate nucleus (LGN). Panel D shows a coronal section illustrating the optic radiations, visualized as expansive colored fiber bundles traveling from the LGN to the primary visual cortex in the occipital lobes. The fiber bundles utilize a standard color-coding scheme representing diffusion directionality (e.g., green for anteroposterior, red for mediolateral, and blue for craniocaudal). This imaging serves to assess axonal integrity and white matter pathway alterations in neurodegenerative conditions such as Normal Tension Glaucoma (NTG).
Physiology of Vision
(Short Note for PG Ophthalmology)
1. Introduction
2. Optics of the Eye
- Cornea - the major refractive surface (~+43 D of total ~+60 D)
- Aqueous humor
- Lens - provides variable refraction (accommodation); adds ~+20 D at rest, up to +33 D during full accommodation
- Vitreous humor
- Outer (fibrous): Cornea + sclera
- Middle (uveal/vascular): Iris + ciliary body + choroid
- Inner (neural): Retina
3. Photoreceptors: Rods and Cones
| Feature | Rods | Cones |
|---|---|---|
| Number | ~120 million | ~6-7 million |
| Location | Peripheral retina | Fovea (cones only at central fovea) |
| Light threshold | Low (1 photon can activate) | High (~100 photons needed) |
| Vision type | Scotopic (night, dim light) | Photopic (day, bright light) |
| Visual acuity | Low | High (highest at fovea) |
| Color vision | No (achromatic) | Yes (trichromatic) |
| Dark adaptation | Slow (30-40 min), large magnitude | Fast (5-10 min), small magnitude |
| Photopigment | Rhodopsin (scotopsin + 11-cis retinal) | Iodopsin (photopsins + 11-cis retinal) |
- Outer segment - contains stacked membranous discs loaded with photopigment. Rods have free-floating discs; in cones the discs remain continuous with the plasma membrane.
- Inner segment - contains mitochondria and protein synthesis machinery; connected to outer segment by a cilium.
- Synaptic terminal - synapses on bipolar and horizontal cells.
- L-cones (red): Peak sensitivity ~564 nm
- M-cones (green): Peak sensitivity ~534 nm
- S-cones (blue): Peak sensitivity ~420 nm
4. Phototransduction (The Visual Cycle)
The Dark State (No light)
- Guanylyl cyclase maintains high intracellular cGMP levels.
- cGMP keeps cGMP-gated Na⁺ channels open → steady Na⁺ influx = dark current.
- Membrane is relatively depolarized (resting potential ~-40 mV).
- Photoreceptor tonically releases glutamate at its synapse with bipolar cells.
The Light Response (Step-by-step)
- Photoisomerization: Photon of light strikes rhodopsin → 11-cis retinal isomerizes to all-trans retinal (conformational change, "bleaching").
- Rhodopsin activation: The sequential intermediates are: Bathorhodopsin (psec) → Lumirhodopsin (μsec) → Metarhodopsin I (msec) → Metarhodopsin II (sec) = activated rhodopsin = the active signaling molecule.
- G-protein activation: Metarhodopsin II activates transducin (G-protein, Gt). One activated rhodopsin can activate ~800 molecules of transducin - a huge amplification step.
- PDE activation: Transducin activates cGMP phosphodiesterase (PDE) → cGMP → 5'-GMP.
- Channel closure: Falling cGMP dissociates from cGMP-gated Na⁺ channels → channels close.
- Hyperpolarization: Na⁺ efflux continues (Na⁺/K⁺-ATPase) while influx ceases → membrane potential shifts to ~-70 to -80 mV.
- Reduced glutamate release: Hyperpolarization inhibits glutamate release from the photoreceptor terminal → signal is transmitted to bipolar cells.
Key point: Photoreceptors are hyperpolarized by light - the opposite of most sensory receptors. They signal in the dark.
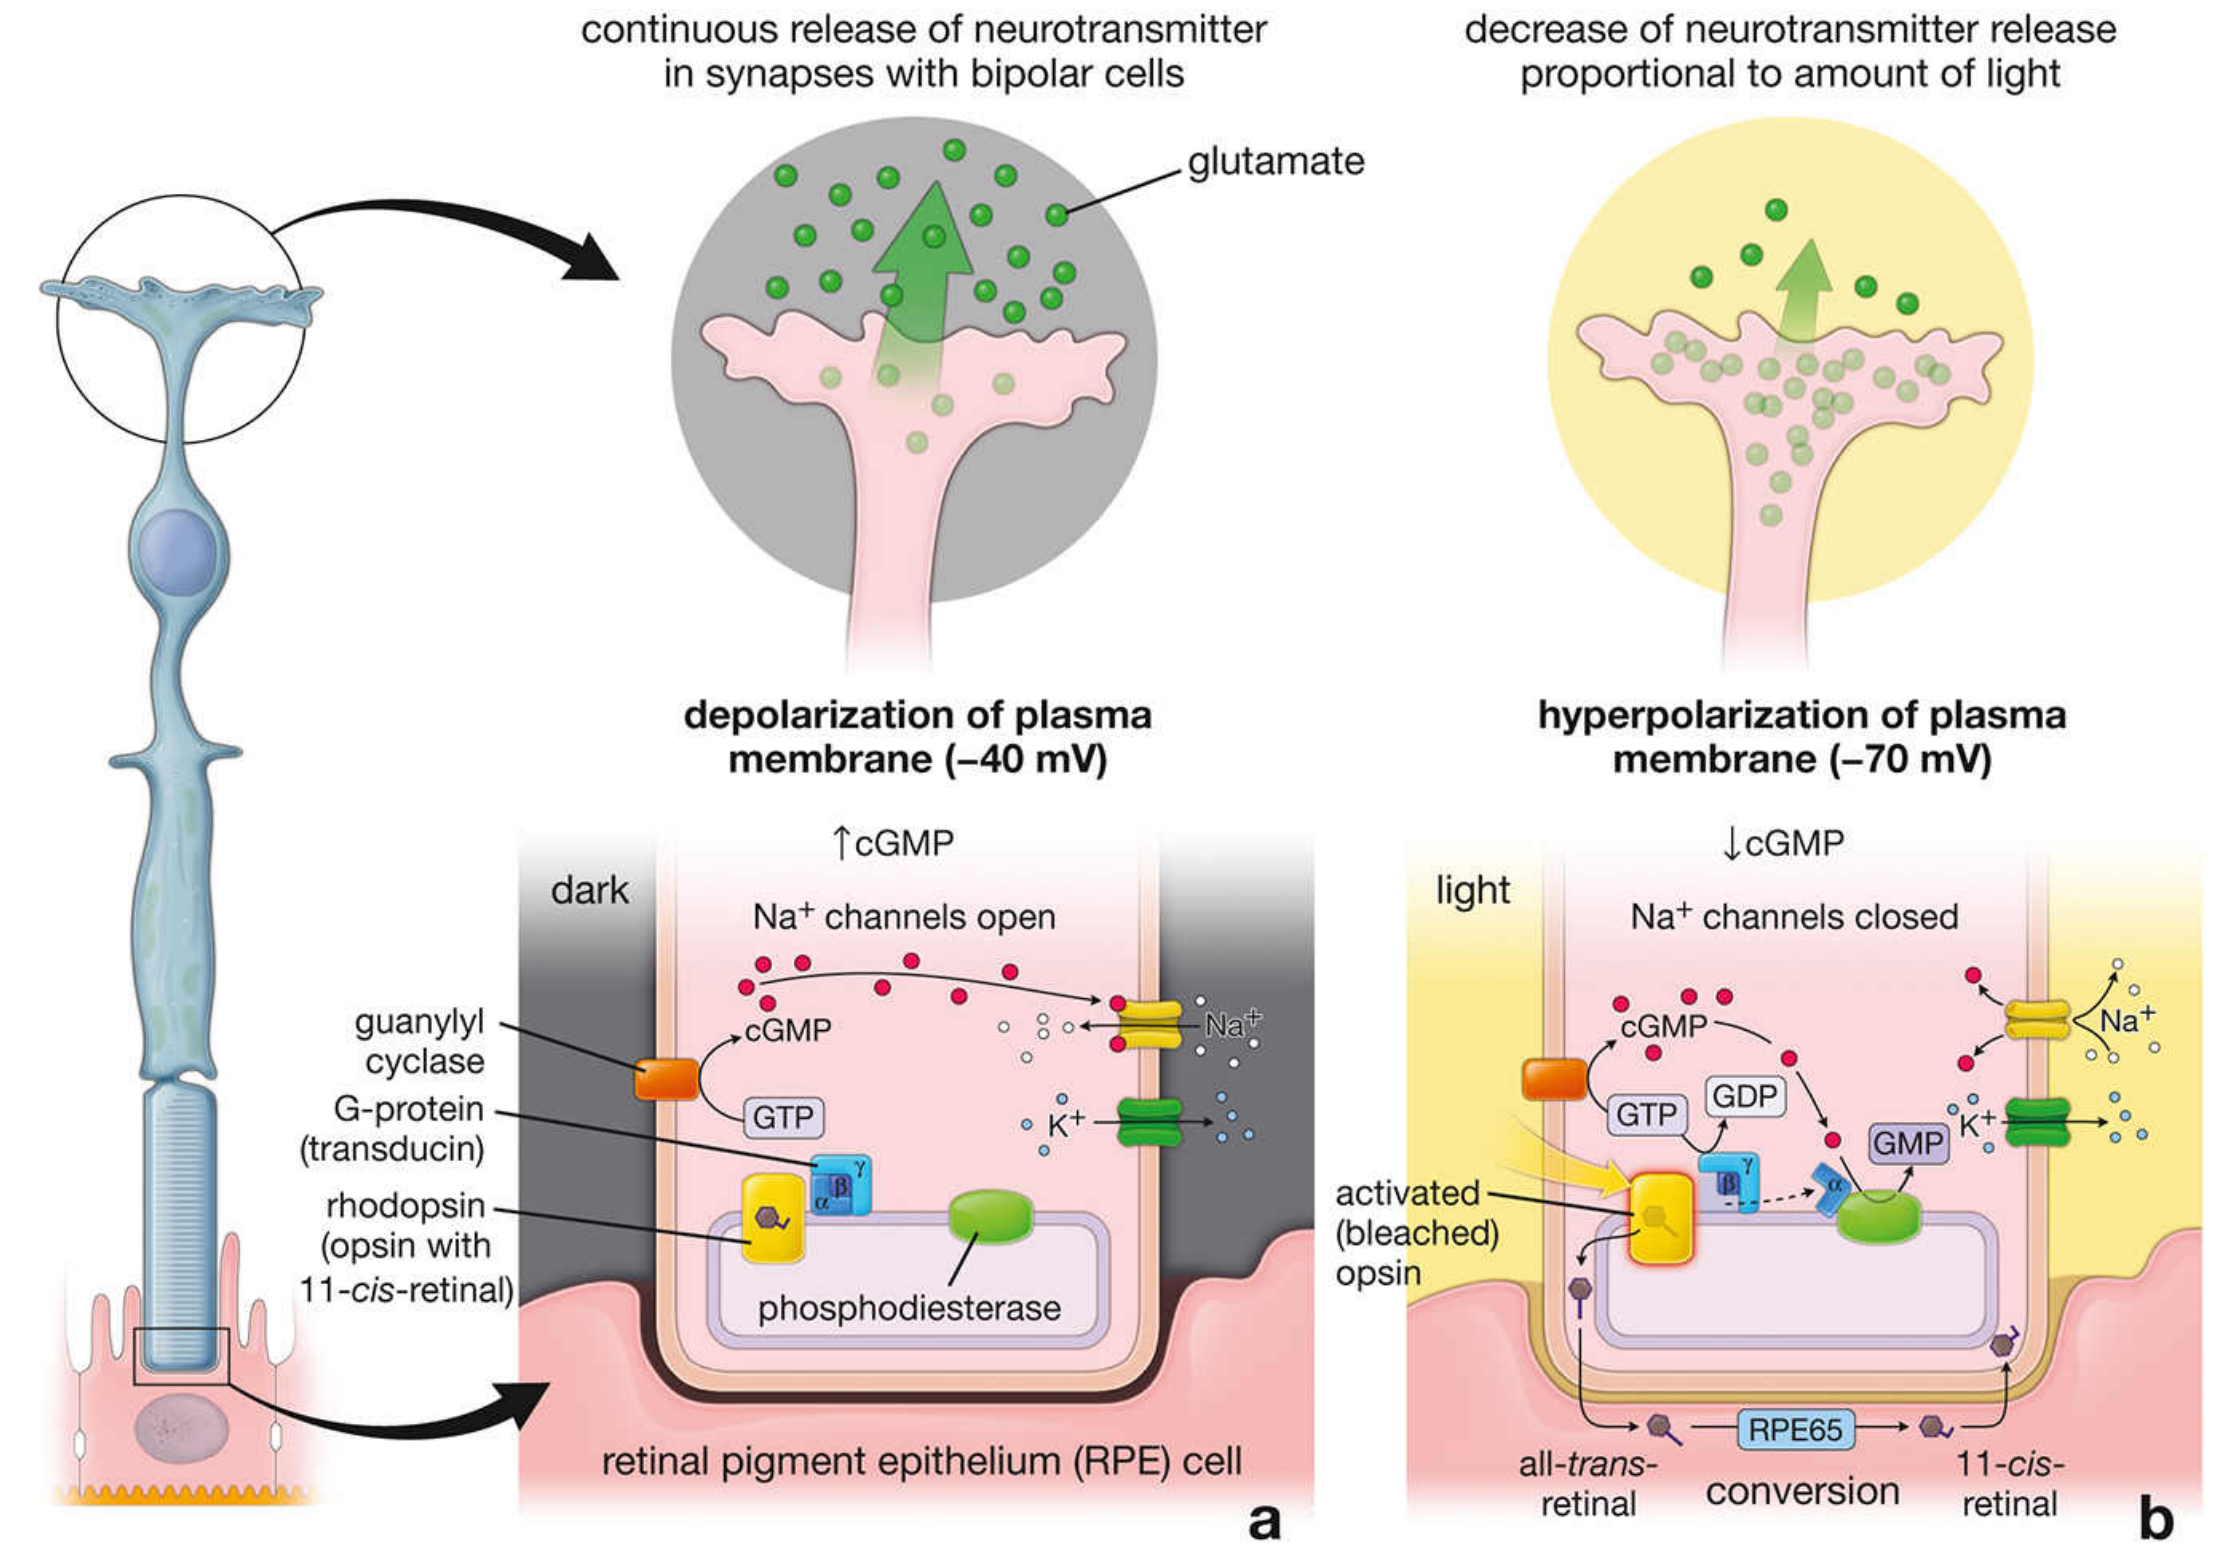
Rhodopsin Regeneration (Visual Cycle)
- All-trans retinal → all-trans retinol in the cytoplasm of rods/cones.
- Transported to Retinal Pigment Epithelium (RPE) cells, where RPE65 enzymatic complex converts it back to 11-cis retinal.
- 11-cis retinal is returned to photoreceptors and recombines with opsin → regenerated rhodopsin.
- Vitamin A (retinol) is the precursor; Vitamin A deficiency → impaired rhodopsin regeneration → night blindness (nyctalopia).
5. Retinal Neural Processing
- Horizontal cells (outer plexiform layer): Modulate photoreceptor-to-bipolar synapses; mediate surround inhibition.
- Amacrine cells (inner plexiform layer): Modulate bipolar-to-ganglion synapses; mix on/off signals.
Center-Surround Receptive Fields
- On-center / off-surround: Light in the center excites; light in the surround inhibits. (Bipolar cell has metabotropic glutamate receptor in center = sign-inverting.)
- Off-center / on-surround: Opposite. (Bipolar cell has ionotropic glutamate receptor = sign-conserving.)
6. Optic Pathway (Visual Pathway)
Decussation Rule at the Optic Chiasm
- Nasal retinal fibers (representing the temporal visual field) → cross at the chiasm.
- Temporal retinal fibers (representing the nasal visual field) → remain ipsilateral.
- Each optic tract therefore carries the contralateral visual field from both eyes.
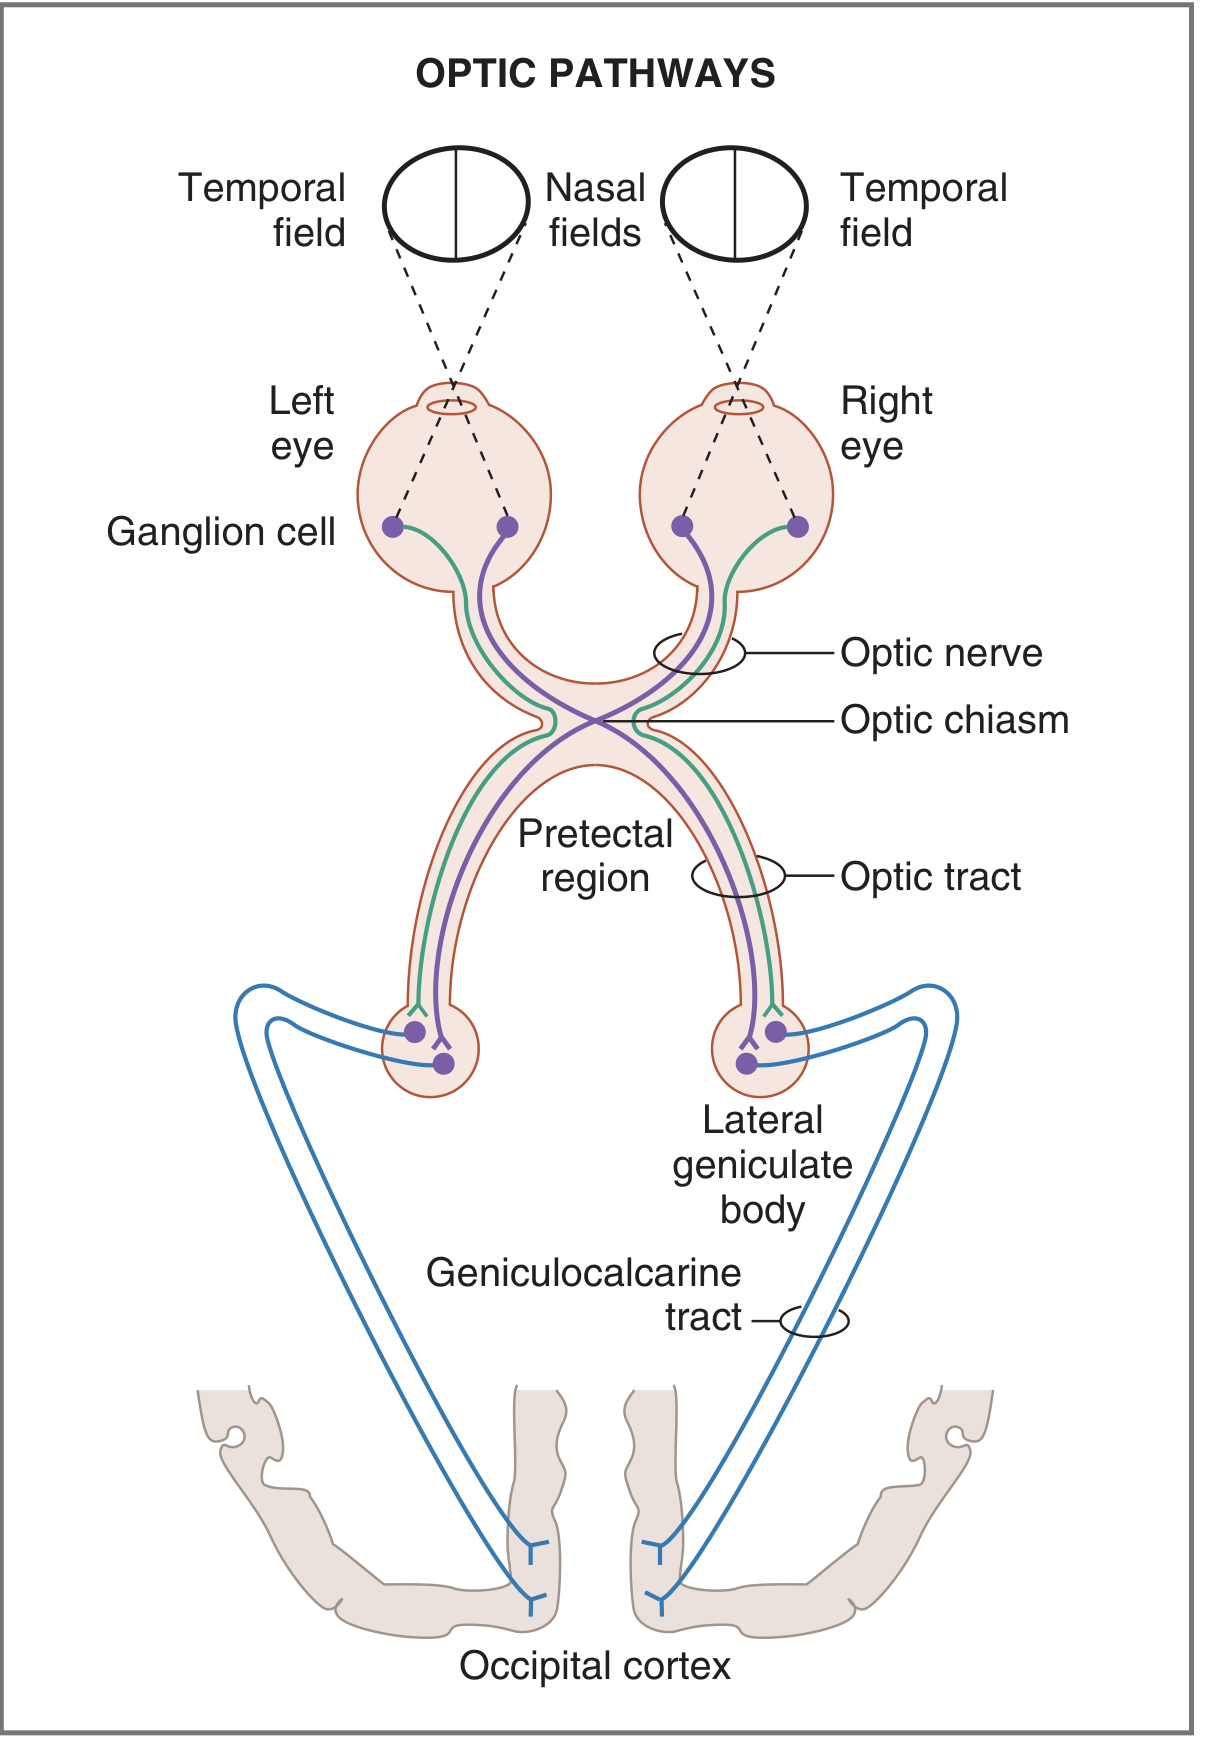
Clinically Important Visual Field Defects
| Site of Lesion | Visual Field Defect |
|---|---|
| Optic nerve | Monocular blindness (ipsilateral eye) |
| Optic chiasm (centre) | Bitemporal heteronymous hemianopia |
| Optic tract | Contralateral homonymous hemianopia |
| Temporal lobe (Meyer's loop) | Contralateral upper quadrantanopia ("pie in the sky") |
| Parietal lobe (superior radiation) | Contralateral lower quadrantanopia ("pie on the floor") |
| Geniculocalcarine tract / Visual cortex | Contralateral homonymous hemianopia with macular sparing |
Macular sparing: Macular representation is large and has dual blood supply; occipital lesions spare it.
7. Visual Cortex Processing
- Receives retinotopically organized input from the LGN.
- Simple cells: Fixed-position, orientation-specific bar/edge detectors.
- Complex cells: Moving bars with the correct orientation.
- Hypercomplex cells: Lines of specific length, curves, and angles.
- Macula has disproportionately large cortical representation (cortical magnification).
- Ventral stream ("What" pathway): V1 → V2 → V4 → inferotemporal cortex - object recognition, color, form.
- Dorsal stream ("Where/How" pathway): V1 → V5 (MT) → posterior parietal cortex - motion, spatial perception, visuomotor guidance.
8. Color Vision
- Orange (580 nm): L:M:S = 99:42:0
- Blue (450 nm): L:M:S = 0:0:97
- White: ~equal stimulation of all three
9. Light and Dark Adaptation
- Early phase (0-10 min): Cone adaptation - fast but limited magnitude.
- Late phase (10-40 min): Rod adaptation - slow but increases sensitivity up to 25,000-fold.
- Pupillary reflex - fastest (seconds); limited range (~16-fold).
- Photopigment regeneration - primary mechanism; slow (minutes to hours).
- Neural adaptation - at bipolar/amacrine/ganglion cell level; fast but small magnitude.
10. Summary Flow
Light (400-750 nm)
  ↓ Refraction (cornea > lens)
  ↓ Focused on fovea
  ↓ Photoreceptors (rods/cones)
  ↓ Phototransduction: 11-cis retinal → all-trans retinal
     → Metarhodopsin II → Transducin → PDE → cGMP↓ → Na⁺ channels close
     → Hyperpolarization → ↓ Glutamate release
  ↓ Bipolar cells → Ganglion cells (center-surround processing)
  ↓ Optic nerve → Optic chiasm (nasal fibres cross)
  ↓ Optic tract → LGN (thalamus)
  ↓ Optic radiation → V1 (calcarine cortex)
  ↓ Higher visual cortex (ventral = "what" / dorsal = "where")
  ↓ PERCEPTION
- Rods use rhodopsin (scotopsin + 11-cis retinal); cones use iodopsin (photopsins + 11-cis retinal)
- Light causes hyperpolarization (not depolarization) of photoreceptors
- RPE65 enzyme is critical for the visual cycle (mutations cause Leber Congenital Amaurosis)
- Vitamin A deficiency → night blindness
- Nasal fibres cross at chiasm → chiasmal lesion = bitemporal hemianopia
- Occipital cortex lesion → hemianopia with macular sparing
- One metarhodopsin II activates ~800 transducin molecules - signal amplification of ~1 million-fold