
Explain me 10 common heart disease with ecg changes and ecg images of those diseases
Reading File
Now let me search the medical library for ECG content across multiple heart diseases simultaneously.
Finding Sources
Finding Sources
Searching the Web
10 common heart diseases ECG changes electrocardiogram findings with images
Good. Now let me read the ECG sections from the medical textbooks and also search for specific ECG conditions.
Reading File
Finding Sources
Finding Sources
Excellent - great content found. Now let me read the key ECG sections and fetch images in parallel.
Reading File
Reading File
Finding Sources
Finding Sources
Great - I have the key image URLs and content. Now let me fetch the ECG images in parallel.
Loading Image
Loading Image
Loading Image
Reading File
Excellent - I have great image content. Now let me get more ECG images - specifically for STEMI, heart block, LVH, and other conditions.
Reading File
Reading File
Finding Sources
I now have extensive content and images. Let me fetch the remaining key ECG images for heart blocks, STEMI sequences, and bundle branch blocks.
Loading Image
Loading Image
Loading Image
Loading Image
I have excellent images and detailed textbook content now. Let me get a couple more key images - LBBB/RBBB and LVH patterns.
Reading File
Loading Image
I now have all the content and images needed for a comprehensive response. Let me also get the LBBB/RBBB image.
Loading Image
I now have comprehensive textbook content and ECG images from Harrison's Principles of Internal Medicine, Ganong's Physiology, and Guyton & Hall. Here is the full, detailed answer:
10 Common Heart Diseases: ECG Changes and Images
1. ST-Elevation Myocardial Infarction (STEMI)
Mechanism: Total occlusion of a coronary artery causes transmural ischemia. The current of injury shifts the ST vector toward the outer (epicardial) layers.
ECG Changes:
- Hyperacute T waves - tall, broad, peaked T waves in the first minutes
- ST elevation ≥ 1 mm in ≥2 contiguous leads (the "tombstone" pattern in severe cases)
- Reciprocal ST depression in opposite leads
- Q wave formation within hours to days (indicating irreversible necrosis)
- T wave inversion as the infarct evolves
Localization:
- Anterior STEMI: ST elevation in V1-V6, I, aVL (LAD occlusion)
- Inferior STEMI: ST elevation in II, III, aVF with reciprocal depression in I, aVL (RCA or LCx occlusion)
- Posterior: Reciprocal ST depressions in V1-V3
ECG - Anterior STEMI (Acute and Evolving):
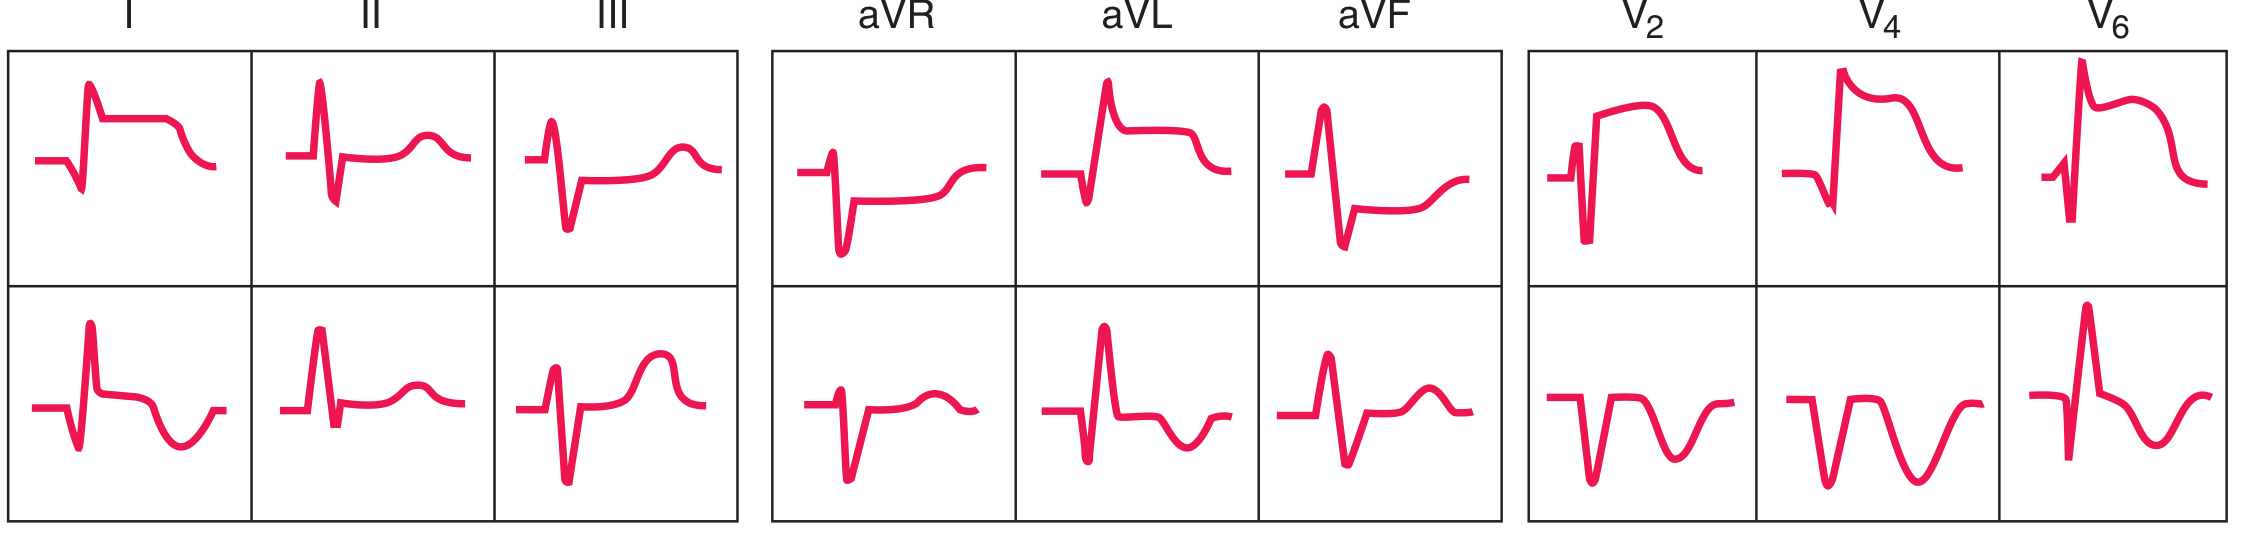 Acute (top row) and evolving (bottom row) anterior ST-elevation/Q-wave infarction. Note ST elevation with developing Q waves. - Harrison's Principles of Internal Medicine 22E
ECG - Inferior STEMI (Acute and Evolving):
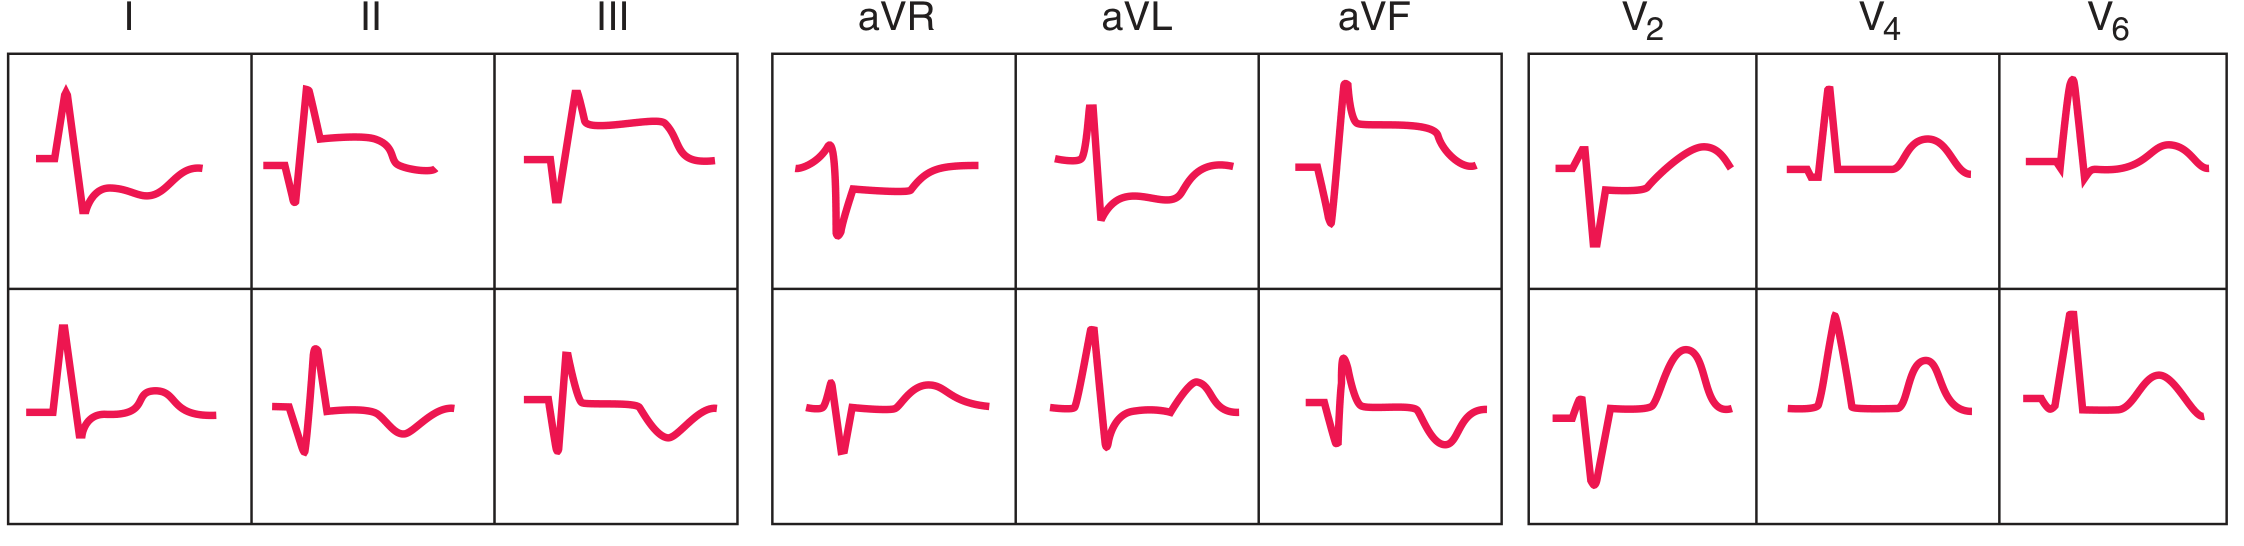 Acute (top) and evolving (bottom) inferior ST-elevation/Q-wave infarction. ST elevation in II, III, aVF with reciprocal depressions in anterior leads. - Harrison's Principles of Internal Medicine 22E
Ischemia diagram:
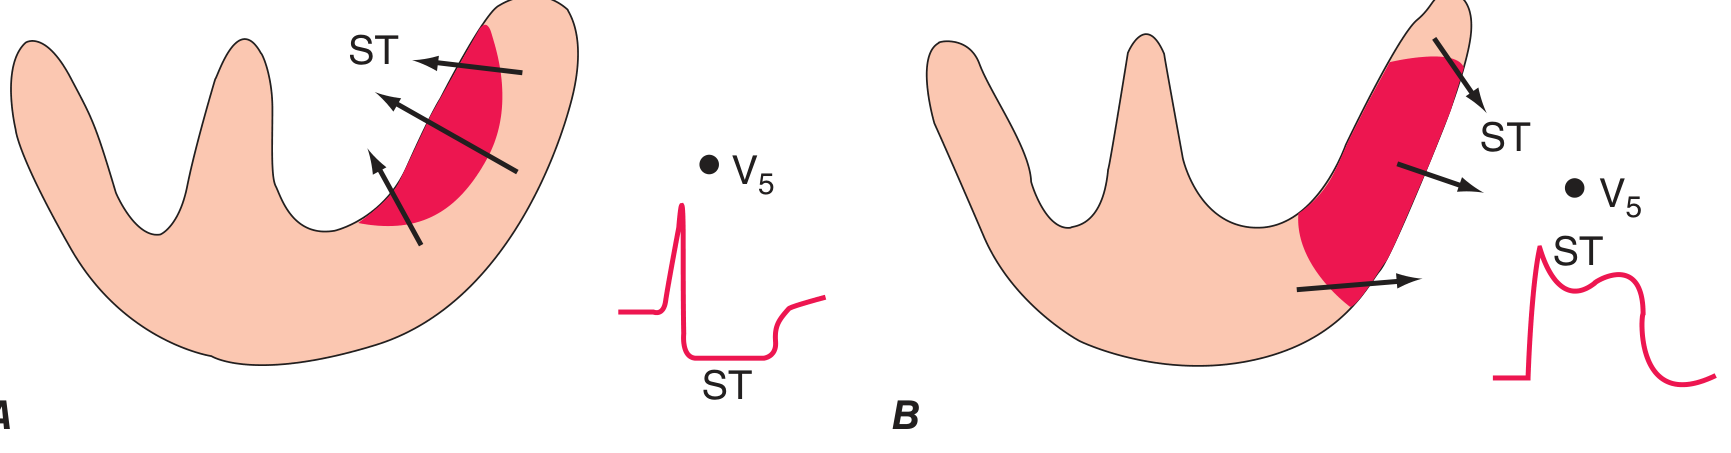 A = Subendocardial ischemia causing ST depression; B = Transmural ischemia causing ST elevation. - Harrison's Principles of Internal Medicine 22E
2. Non-ST-Elevation Myocardial Infarction (NSTEMI) / Unstable Angina
Mechanism: Partial occlusion or severe subendocardial ischemia. The ST vector shifts toward the subendocardium.
ECG Changes:
- ST depression (often horizontal or downsloping) in precordial leads, often V1-V5
- T wave inversions - can be diffuse or regional
- No pathological Q waves (by definition, though may appear later)
- Wellens' sign - deep symmetric T-wave inversions in V1-V4 indicating critical LAD stenosis (a "pre-infarction" pattern)
ECG - Anterior wall ischemia / Wellens' T waves:
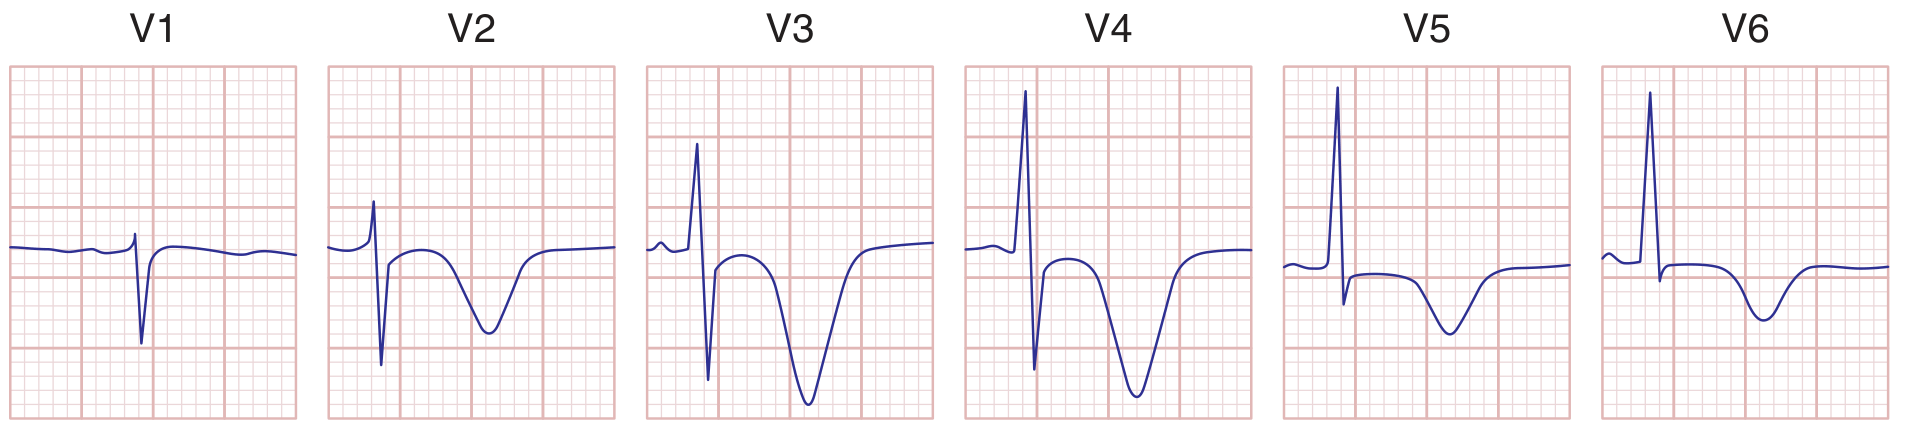 Severe anterior wall ischemia causing prominent T-wave inversions in precordial leads V1-V6 (Wellens T-wave sign) - associated with high-grade LAD stenosis. - Harrison's Principles of Internal Medicine 22E
3. Atrial Fibrillation (AF)
Mechanism: Chaotic, disorganized electrical activity in the atria with no coordinated depolarization. Multiple re-entrant wavelets depolarize the atria randomly.
ECG Changes:
- Absent P waves - replaced by irregular fibrillatory baseline (f waves, 350-600 bpm)
- Irregularly irregular RR intervals - the hallmark finding
- Narrow QRS (unless aberrant conduction or pre-existing BBB)
- Ventricular rate typically 100-180 bpm if uncontrolled
ECG - Atrial Fibrillation (Lead II):
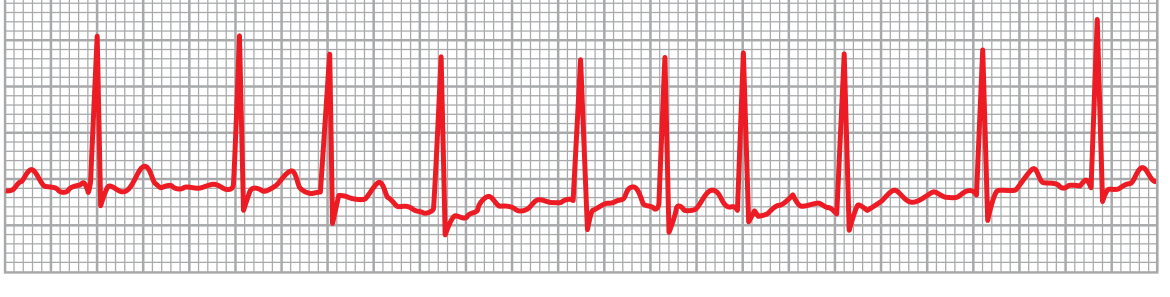 Atrial fibrillation in Lead II. No visible P waves; the QRS complexes are normal in morphology but are irregularly spaced - the defining feature of AF. - Guyton & Hall Textbook of Medical Physiology
4. First-Degree AV Block
Mechanism: Slowing of conduction through the AV node. Every impulse is still conducted but takes longer.
ECG Changes:
- Prolonged PR interval > 200 ms (0.20 s) on every beat
- Normal P wave morphology
- Normal QRS after every P wave (1:1 conduction maintained)
- Regular rhythm
ECG - First-Degree Heart Block:
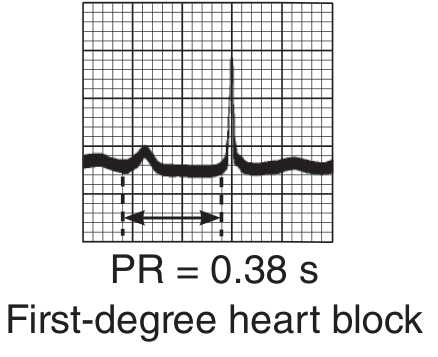 First-degree heart block with PR interval = 0.38 s. Every P wave conducts but with abnormal delay. - Ganong's Review of Medical Physiology
5. Second-Degree AV Block (Mobitz Type I - Wenckebach)
Mechanism: Progressively increasing AV node fatigue until one impulse fails to conduct, then the cycle resets.
ECG Changes:
- Progressively lengthening PR interval with each beat
- Dropped QRS (non-conducted P wave) after the longest PR interval
- The PR interval is shortest immediately after the dropped beat
- Group beating pattern
ECG - Second-Degree Heart Block (Wenckebach):
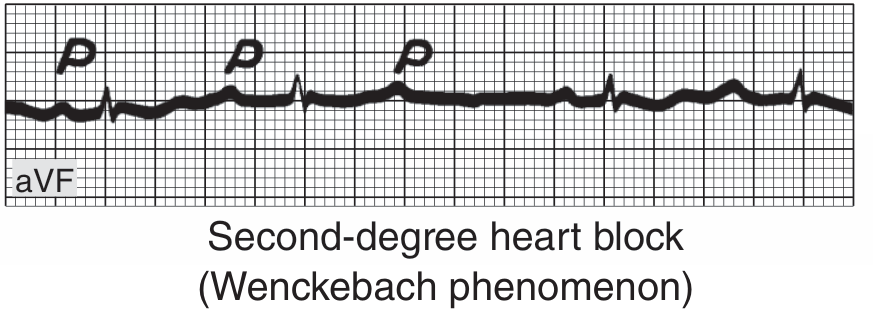 Second-degree AV block (Wenckebach phenomenon) in lead aVF. P waves (labeled P) are followed by QRS complexes with progressively lengthening intervals, then a dropped beat. - Ganong's Review of Medical Physiology
6. Complete (Third-Degree) AV Block
Mechanism: Total interruption of conduction between atria and ventricles. The atria and ventricles beat independently from separate pacemakers.
ECG Changes:
- Complete AV dissociation - P waves and QRS complexes are completely independent
- P waves march through at a faster rate (60-100 bpm)
- Slow escape rhythm drives the ventricles:
- Junctional escape: rate 40-60 bpm, narrow QRS
- Ventricular escape: rate 20-40 bpm, wide QRS
- PP intervals and RR intervals are each regular, but bear no relationship to each other
ECG - Complete Heart Block:
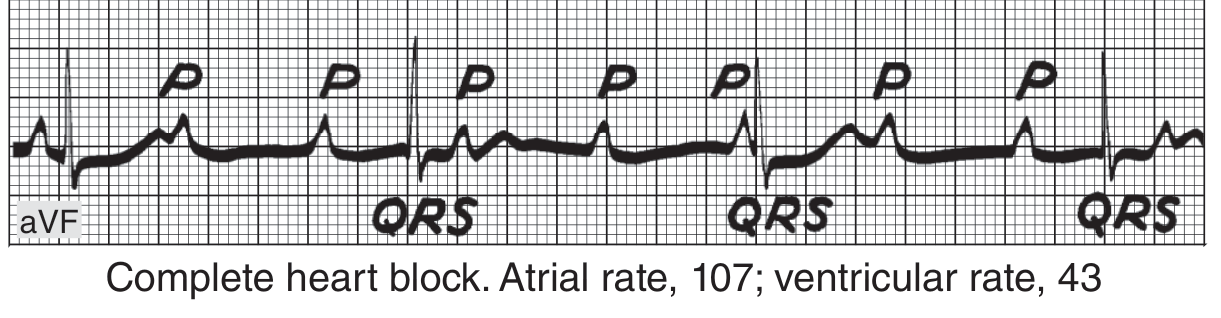 Complete heart block: atrial rate 107 bpm, ventricular rate 43 bpm. P waves and QRS complexes march independently with no relationship. - Ganong's Review of Medical Physiology
7. Left Bundle Branch Block (LBBB)
Mechanism: Block in the left bundle branch causes late, abnormal activation of the left ventricle - depolarization spreads from right to left through myocardium rather than the specialized conduction system.
ECG Changes:
- Wide QRS ≥ 120 ms (≥3 small squares)
- Broad, notched R wave ("M-shaped") in lateral leads I, aVL, V5, V6
- Deep S wave (or QS pattern) in V1
- No septal Q waves in lateral leads (loss of normal left-to-right septal activation)
- Secondary ST-T changes - ST and T are discordant (opposite polarity) to the main QRS deflection
- Left axis deviation common
ECG - Left Bundle Branch Block (V5 and V6):
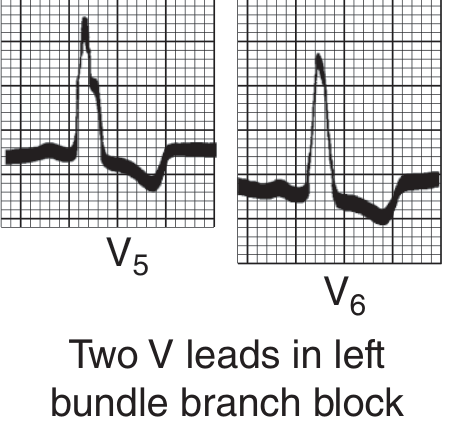 LBBB in leads V5 and V6: broad notched R waves with discordant (downward) ST-T changes - classic secondary repolarization abnormality. - Ganong's Review of Medical Physiology
Clinical note: New LBBB in a patient with chest pain should be treated as a STEMI equivalent until proven otherwise.
8. Left Ventricular Hypertrophy (LVH)
Mechanism: Increased muscle mass (typically from chronic hypertension, aortic stenosis, or hypertrophic cardiomyopathy) generates larger electrical forces directed leftward and posteriorly.
ECG Changes:
- High-voltage QRS: Classic Sokolow-Lyon criteria: SV1 + RV5 or RV6 > 35 mm
- Left axis deviation
- ST depression and T wave inversions in I, aVL, V5-V6 (the "strain" pattern) - due to repolarization abnormality
- Left atrial abnormality frequently co-exists (broad, notched P wave)
- Slow R-wave progression in precordial leads possible
- Sensitivity of voltage criteria is moderate; echo is more definitive
Key ECG criteria from Harrison's: RaVL >20 mm (women) or >28 mm (men) is a particularly useful criterion. ST depression with T-wave inversion in leads with prominent R waves constitutes the "strain" pattern and indicates a more severe degree of hypertrophy.
9. Pulmonary Embolism (Acute Cor Pulmonale)
Mechanism: Massive PE causes acute right ventricular pressure overload and dilation. This shifts the cardiac electrical axis rightward and causes right ventricular strain.
ECG Changes:
- Sinus tachycardia - the most common and often the only finding
- S1Q3T3 pattern - S wave in lead I, Q wave in lead III, T-wave inversion in lead III
- Right axis deviation
- Right bundle branch block (complete or incomplete) - due to acute RV strain
- ST depression and T-wave inversions in right precordial leads V1-V4 (simulating anterior ischemia)
- Atrial fibrillation or flutter may occur
- Normal ECG does not exclude PE
Harrison's note: "Acute right ventricular dilation may be associated with slow R-wave progression and ST-T abnormalities in V1-V4 simulating acute anterior infarction."
10. Hypertrophic Cardiomyopathy (HCM)
Mechanism: Asymmetric septal hypertrophy with myocardial fiber disarray leads to abnormal depolarization and repolarization patterns. Elevated LV pressures cause LVH-like changes.
ECG Changes:
- Left ventricular hypertrophy with high-voltage QRS
- Abnormal Q waves in lateral leads (I, aVL, V5-V6) and inferior leads (II, III, aVF) - due to asymmetric septal hypertrophy creating abnormal initial septal forces
- Giant T-wave inversions in precordial leads (especially apical HCM variant - "apical HCM" or Yamaguchi syndrome, with massive negative T waves in V3-V5)
- ST depression in lateral leads
- Left atrial enlargement (broad, bifid P wave)
- Left axis deviation
- The ECG is abnormal in >90% of HCM patients
Quick Reference Summary
| Disease | Key ECG Finding |
|---|---|
| STEMI | ST elevation ≥1 mm in ≥2 contiguous leads + Q waves |
| NSTEMI/UA | ST depression, T inversion, no Q waves |
| Atrial Fibrillation | Absent P waves, irregularly irregular RR |
| 1st-degree AV block | PR > 200 ms, all P waves conduct |
| 2nd-degree AV block (Wenckebach) | Progressive PR lengthening, dropped beat |
| 3rd-degree AV block | Complete AV dissociation, slow escape rhythm |
| LBBB | QRS ≥120 ms, broad R in V5-V6, discordant ST-T |
| LVH | High voltage (SV1+RV5 >35 mm), lateral strain pattern |
| Pulmonary Embolism | S1Q3T3, sinus tachycardia, right heart strain |
| HCM | LVH + deep septal Q waves, giant T inversions |
Sources:
- Harrison's Principles of Internal Medicine 22E (2025), Chapters 247, 285, 286
- Guyton & Hall Textbook of Medical Physiology, Chapter 13
- Ganong's Review of Medical Physiology, 26th Edition, Chapter 29
This is a shared conversation. Sign in to Orris to start your own chat.