
Antioxidants
What aspect of antioxidants are you interested in?
antioxidants oxidative stress disease
antioxidant defense mechanisms free radicals ROS diagram
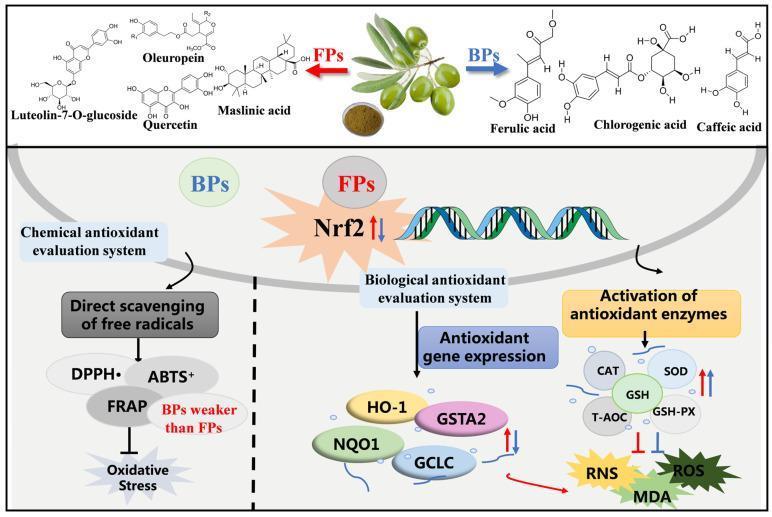
This pathophysiology diagram illustrates the comparative antioxidant mechanisms of free phenolics (FPs) and bound phenolics (BPs) derived from olive leaves. The top panel depicts chemical structures: FPs include oleuropein, luteolin-7-O-glucoside, quercetin, and maslinic acid; BPs include ferulic, chlorogenic, and caffeic acids. The lower panel divides evaluation into two systems. On the left, the chemical antioxidant evaluation system shows direct scavenging of free radicals (DPPH, ABTS, FRAP) leading to the inhibition of oxidative stress, noting BPs are weaker than FPs in this modality. On the right, the biological antioxidant evaluation system demonstrates two pathways: 1) Antioxidant gene expression via Nrf2 signaling, upregulating HO-1, NQO1, GCLC, and GSTA2 (primarily driven by FPs); and 2) Activation of antioxidant enzymes including CAT, SOD, GSH-PX, and non-enzymatic GSH, leading to the reduction of RNS, ROS, and MDA. Red and blue arrows indicate the specific contributions of FPs and BPs respectively, highlighting that while both mitigate oxidative stress, FPs uniquely activate the Nrf2-mediated genomic response.
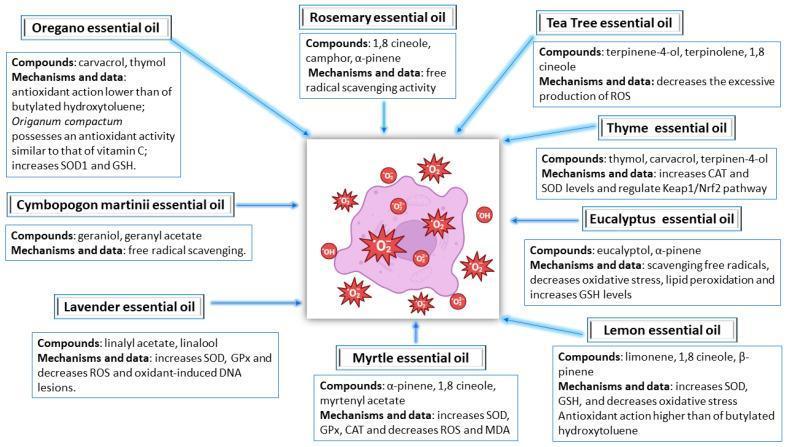
This pathophysiology diagram illustrates the antioxidant mechanisms of various essential oils (EOs) in the context of dermatological health, specifically for managing acne vulgaris. The central visual depicts a cellular structure under oxidative stress, indicated by reactive oxygen species (ROS) such as superoxide (O2-) and hydroxyl radicals (OH). Surrounding this central figure are nine detailed panels for different EOs: Oregano, Rosemary, Tea Tree, Thyme, Eucalyptus, Lemon, Myrtle, Lavender, and Cymbopogon martini. Each panel categorizes the primary chemical 'Compounds' (e.g., carvacrol, thymol, 1,8-cineole, linalool) and their specific 'Mechanisms and data.' Key biological pathways highlighted include the regulation of the Keap1/Nrf2 pathway, scavenging of free radicals, and the upregulation of endogenous antioxidant enzymes such as superoxide dismutase (SOD), glutathione peroxidase (GPx), and catalase (CAT). The diagram also notes reductions in malondialdehyde (MDA) levels and lipid peroxidation, emphasizing the oils' clinical relevance in mitigating oxidative damage and inflammation associated with skin disorders.
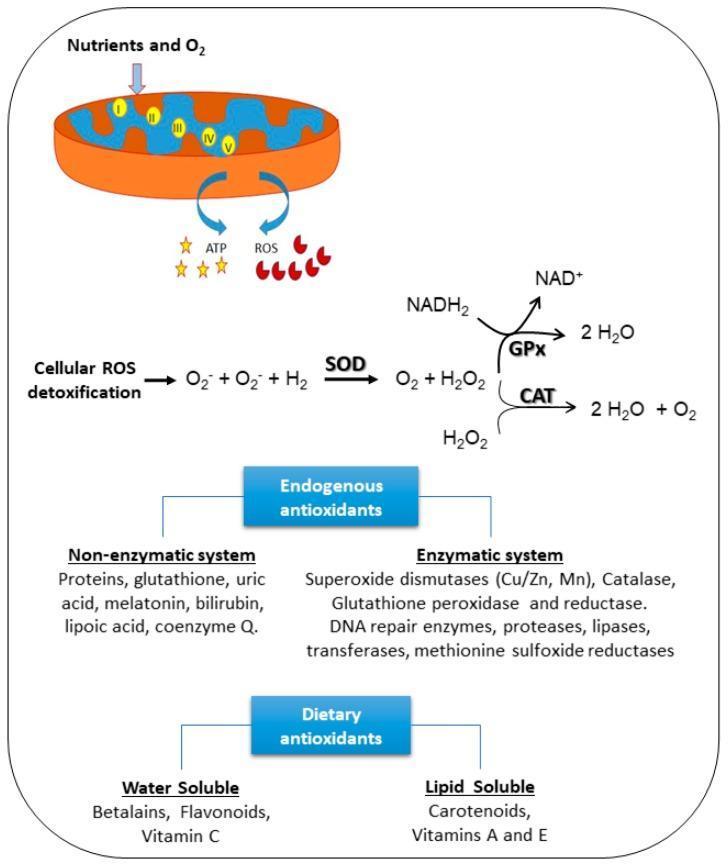
This pathophysiology diagram illustrates the cellular antioxidant defense systems and the biochemical pathways for Reactive Oxygen Species (ROS) detoxification. At the top, a mitochondrion is shown utilizing nutrients and O2 through the electron transport chain (complexes I-V) to generate ATP, with ROS produced as a metabolic byproduct. The central flowchart details the enzymatic neutralization of ROS: Superoxide Dismutase (SOD) converts superoxide radicals (O2-) into oxygen (O2) and hydrogen peroxide (H2O2). Subsequently, H2O2 is neutralized by Glutathione Peroxidase (GPx), utilizing NADH2 as a cofactor to produce water, and by Catalase (CAT) to produce water and oxygen. The bottom sections categorize protective antioxidants into Endogenous and Dietary groups. Endogenous systems are split into enzymatic (e.g., SOD, Catalase, GPx, DNA repair enzymes) and non-enzymatic (e.g., glutathione, uric acid, melatonin). Dietary antioxidants are classified by solubility: water-soluble (Betalains, Flavonoids, Vitamin C) and lipid-soluble (Carotenoids, Vitamins A and E). The diagram emphasizes the multi-layered approach to maintaining cellular redox homeostasis.
Antioxidants
1. Free Radicals and Oxidative Stress
| ROS | Source |
|---|---|
| Superoxide anion (O₂•⁻) | Mitochondrial electron transport chain (complexes I-III), NADPH oxidase |
| Hydrogen peroxide (H₂O₂) | Dismutation of superoxide; peroxisomal oxidation |
| Hydroxyl radical (•OH) | Fenton reaction (Fe²⁺ + H₂O₂ → Fe³⁺ + OH⁻ + •OH); Haber-Weiss reaction |
| Lipid peroxyl radicals | Peroxidation of polyunsaturated fatty acids (PUFAs) |
2. Enzymatic Antioxidants
a. Superoxide Dismutase (SOD)
- Cu⁺-Zn²⁺ SOD (cytosol) - encoded by SOD1; mutations cause ~5-10% of familial ALS (amyotrophic lateral sclerosis)
- Mn²⁺ SOD (mitochondria)
- Cu⁺-Zn²⁺ SOD (extracellular)
2 O₂•⁻ + 2H⁺ → H₂O₂ + O₂
- Basic Medical Biochemistry, p. 917
b. Catalase
2 H₂O₂ → 2 H₂O + O₂
c. Glutathione Peroxidase (GPx) and Glutathione Reductase
- Reduce H₂O₂ to water
- Reduce lipid peroxides to nontoxic alcohols
- Fishman's Pulmonary Diseases, p. 2549; Basic Medical Biochemistry, p. 918
3. Non-Enzymatic Antioxidants
a. Vitamin E (α-Tocopherol) - Fat-Soluble
- Harper's Biochemistry, p. 564
b. Vitamin C (Ascorbate) - Water-Soluble
- Harper's Illustrated Biochemistry, p. 564
c. β-Carotene and Carotenoids
d. Other Non-Enzymatic Antioxidants
| Antioxidant | Location | Notes |
|---|---|---|
| Uric acid | Plasma | Major extracellular antioxidant |
| Ceruloplasmin | Plasma | Copper-binding; scavenges free iron |
| Melatonin | Widespread | Scavenges •OH, O₂•⁻ |
| Bilirubin | Plasma | Antioxidant at physiological levels |
| Thioredoxin | Intracellular | Alternative to glutathione system |
4. The Nrf2-ARE Pathway (Master Regulatory Switch)
- Heme oxygenase-1 (HO-1)
- NAD(P)H quinone oxidoreductase 1 (NQO1)
- Glutamate-cysteine ligase catalytic subunit (GCLC)
- Glutathione S-transferase A2 (GSTA2)
- Fuster and Hurst's The Heart, 15th Ed
5. Antioxidants in Disease
| Disease | Role of Oxidative Stress | Antioxidant Relevance |
|---|---|---|
| Atherosclerosis / CVD | LDL oxidation, endothelial dysfunction | Vitamin E meta-analyses show no benefit from supplements; may increase mortality at high doses |
| Cancer | DNA oxidation, mutagenesis | β-carotene supplements harmful in smokers; dietary antioxidants generally protective |
| Neurodegeneration (ALS, Parkinson's, Alzheimer's) | Mitochondrial ROS, SOD1 mutations in familial ALS | SOD/catalase dysfunction implicated |
| Alcoholic liver disease (ALD) | Hepatic GSH depletion, ROS from CYP2E1 | Low mitochondrial glutathione worsens injury |
| Inflammatory bowel disease | Oxidative stress biomarkers correlate with disease activity | GSH, SOD, catalase reduced in active disease |
| Pulmonary O₂ toxicity | Hyperoxia overwhelms cellular SOD/catalase | Lung tissue has high extracellular antioxidant reserve to tolerate O₂ |
| Recurrent pancreatitis | Oxidant-antioxidant imbalance | Selenium, ascorbic acid, α-tocopherol measured and supplemented in RAP/CP |
6. Dietary Sources
| Antioxidant | Rich Sources |
|---|---|
| Vitamin C | Citrus, bell peppers, kiwi, broccoli |
| Vitamin E | Nuts, seeds, wheat germ, vegetable oils |
| β-Carotene | Carrots, sweet potato, dark leafy greens |
| Selenium (GPx cofactor) | Brazil nuts, seafood, meat |
| Flavonoids/Polyphenols | Berries, tea, cocoa, red wine |
| Curcumin | Turmeric - activates Nrf2, scavenges ROS |
7. The Antioxidant Supplementation Problem
- High-dose vitamin E meta-analyses show increased all-cause mortality
- β-carotene supplements increased lung cancer in smokers (ATBC and CARET trials)
- Vitamin C at very high doses can act as a pro-oxidant
- Supplements provide single molecules, while foods contain hundreds of synergistic compounds
- Some ROS are beneficial signaling molecules - excessive scavenging disrupts redox signaling
- Several antioxidants are pro-oxidant at high concentrations
- Harper's Illustrated Biochemistry, p. 564
