
Make a ppt on diabetic retinopathy , quoting only from standard textbooks . As a 2nd year ophtha resident
diabetic retinopathy fundus photograph classification
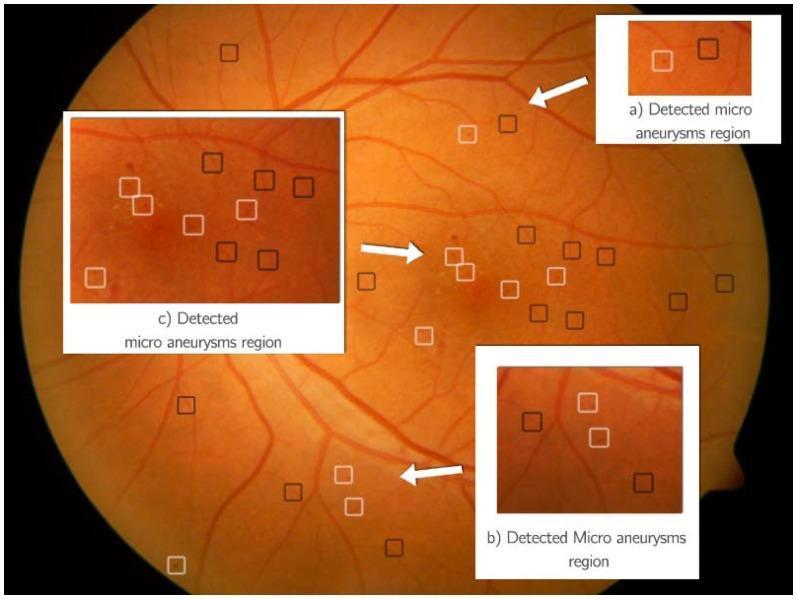
This diagnostic clinical photograph shows a processed color fundus image of a human retina, highlighting automated detection of diabetic retinopathy signs. The fundus background displays a standard brownish-orange hue with visible anatomical structures, including branching retinal vasculature and the optic disc margin. The image is annotated with bounding boxes from an automated classification system designed to identify microaneurysms (MAs). White boxes indicate regions positively identified as microaneurysms, which appear as subtle, dark red, dot-like lesions often located near fine vascular branches. Black boxes indicate candidate regions classified as 'Not MA,' representing background noise, small vessel segments, or other non-pathological features. Three inset magnifications (labeled a, b, and c) provide detailed views of these detections, illustrating the morphological similarities between true microaneurysms and anatomical background elements. This visual is used to demonstrate the performance of Hidden Markov Models (HMM) and ensemble classifiers in differentiating clinical signs of diabetic retinopathy from normal retinal features.
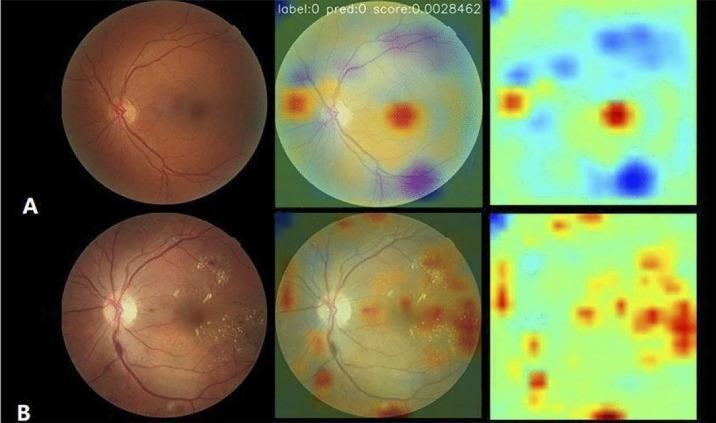
This comparison chart displays fundus photography and corresponding deep learning attention maps used in the classification of diabetic retinopathy (DR). The image is divided into two rows: Row A represents a healthy retina, and Row B represents a retina with diabetic retinopathy. Each row contains three panels: the original clinical photograph, an overlaid saliency/attention map, and a standalone heatmap. The heatmaps utilize a color spectrum where yellow and red indicate regions of high relevance to the model's decision-making process. In row A (healthy), the model shows localized focal attention near the optic nerve head and macula. In row B (DR), the attention map reveals a diffuse and widespread distribution of high-relevance pixels (red/yellow), corresponding to pathological lesions such as microaneurysms, hemorrhages, and hard exudates scattered across the fundus. This visualizes Class Activation Mapping (CAM) techniques used in artificial intelligence to identify clinically significant features and improve the interpretability of automated screening for retinal diseases.
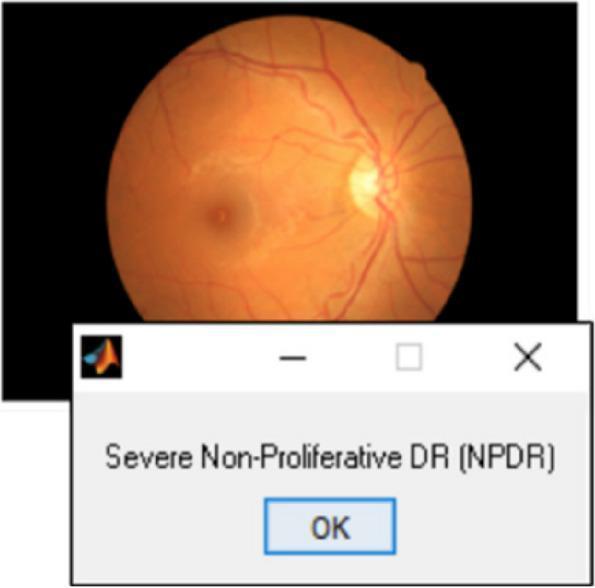
This diagnostic image features a retinal fundus photograph demonstrating clinical signs of diabetic retinopathy. The fundus exhibits a typical orange-red hue with a clearly defined, bright optic disc located nasally. Retinal vasculature radiates from the disc, showing characteristic branching patterns against the retinal background. Visible pathology includes scattered microaneurysms and potential intraretinal hemorrhages consistent with diabetic vascular damage. A graphical user interface (GUI) dialog box is superimposed on the lower portion of the image, displaying the classification output from a Deep Convolutional Neural Network (CNN) classifier. The text within the box reads 'Severe Non-Proliferative DR (NPDR)', indicating the automated diagnostic grading of the disease severity. This image serves as an educational example of how artificial intelligence and deep learning models are integrated into ophthalmology for the automated detection and grading of Diabetic Retinopathy (DR) and Diabetic Macular Edema (DME).
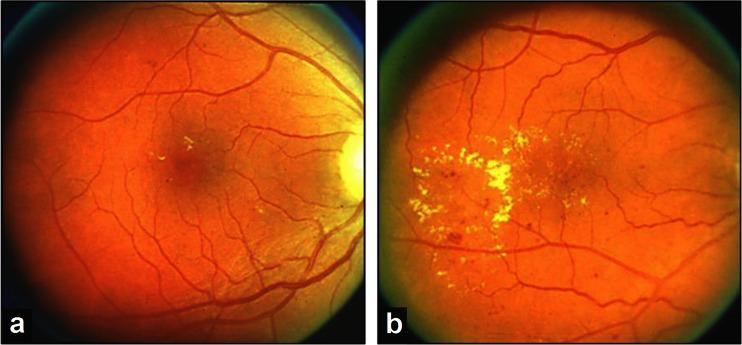
This diagnostic image pair displays side-by-side color fundus photographs used for the classification and grading of diabetic retinopathy according to ETDRS standards. Image (a) represents ETDRS standard photograph 3, showing a posterior pole with a healthy orange-red retinal background, visible retinal vasculature, and a clear optic disc. A few scattered, small, yellowish-white hard exudates are visible in the temporal macula, indicating early-stage lipid leakage. Image (b) represents ETDRS standard photograph 4, demonstrating a more advanced severity of hard exudates. A large, dense, circinate-like cluster of bright yellow-white hard exudates occupies the central macular area, significantly obscuring underlying retinal details. These images serve as reference standards for grading the area of retina involved by hard exudates (HE) in clinical trials and diagnostic assessments of non-proliferative diabetic retinopathy (NPDR). The comparison illustrates the progression of vascular permeability and lipid deposition characteristic of diabetic maculopathy.
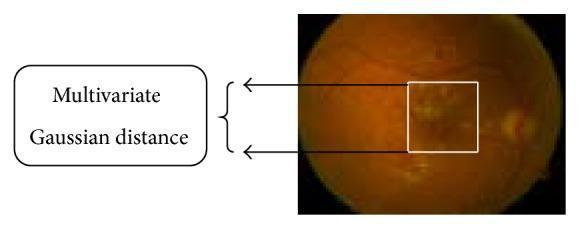
This clinical photograph displays a digital fundus image used for ophthalmological diagnostic analysis, specifically focused on diabetic retinopathy. The fundus exhibits a mottled orange-brown pigmentation with visible retinal vasculature. A white square bounding box demarcates a region of interest containing localized pathological changes, including exudates or textured pigmentation variations suggestive of disease manifestation. To the left of the image, an annotation box titled 'Multivariate Gaussian distance' with arrows pointing to the marked region illustrates a computational approach used in the Diabetic Fundus Image Recuperation (DFIR) method. The visual demonstrates the application of digital image processing to assess disease severity and depth, specifically within the optic cup or macular region. The educational focus is on the integration of clinical imaging with algorithmic classification (like the Spiral Basis Function) to objectively rank retinopathy progression and determine the spatial depth of affected retinal areas.
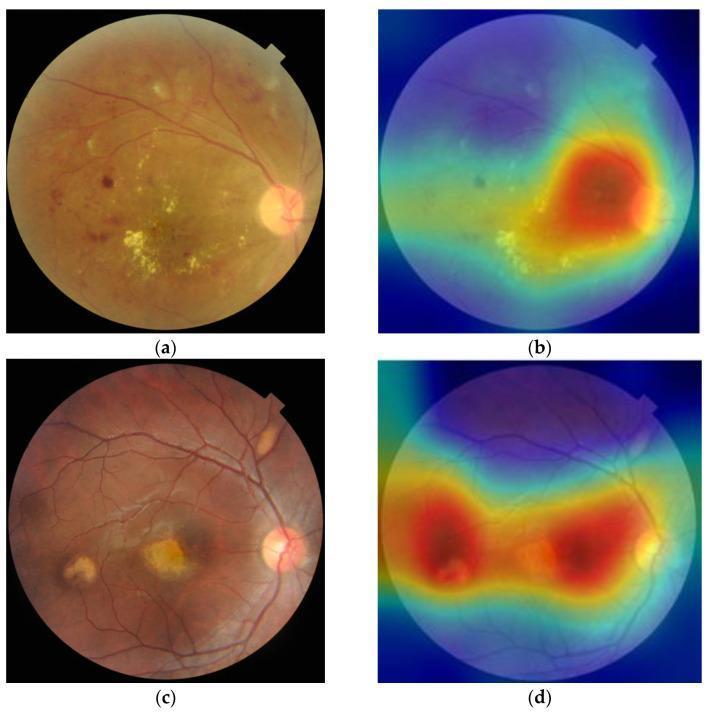
This medical figure presents a side-by-side comparison of diagnostic fundus images (a, c) and their corresponding AI-generated heatmaps (b, d) using Guided-Grad-CAM (Gradient-weighted Class Activation Mapping). Image (a) displays a fundus photograph characteristic of diabetic retinopathy (DR), showing scattered yellowish-white hard exudates and punctate microaneurysms against a yellowish-brown retinal background. Image (c) illustrates complex retinal pathology, including central retinal vein occlusion (CRVO) features and retinal pigment epithelium (RPE) changes, characterized by larger, distinct pale lesions and irregular macular pigmentation. The corresponding heatmaps (b, d) utilize a color-coded spectrum to indicate model attention areas for multi-label classification. Red and yellow 'hot' zones represent regions of highest influence on the diagnostic algorithm, specifically localizing to the visible pathological exudates and RPE alterations. These visualizations demonstrate the clinical utility of deep learning models in identifying and localizing retinopathy-related features within ophthalmology, aiding in the automated detection of sight-threatening diseases.
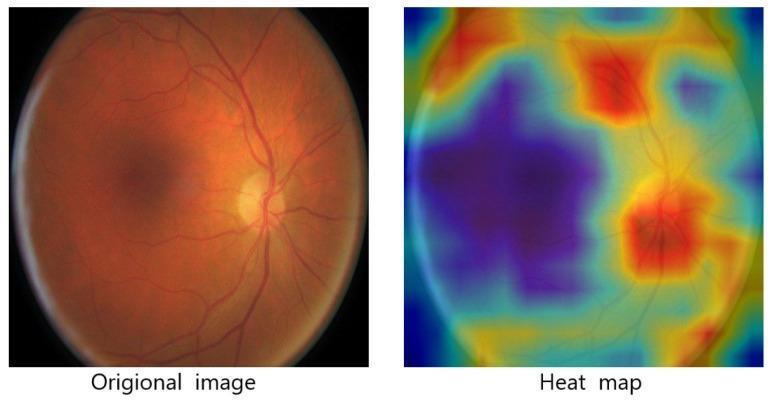
This figure presents a comparative visualization of a retinal fundus photograph (left) and its corresponding attention-based heat map (right), used in the diagnostic assessment of diabetic retinopathy. The clinical photograph displays a standard posterior pole view of the human retina, characterized by an orange-red fundus, a centrally located dark foveal region, and a distinct, pale optic disc with radiating primary retinal vasculature. The heat map on the right illustrates the spatial focus of a deep learning model's attention mechanism. Using a color gradient where red indicates high intensity and blue indicates low intensity, the map demonstrates that the model prioritizes specific anatomical and pathological landmarks, such as the optic nerve head, major vascular branches, and the macula, for feature extraction and disease grading. This visualization serves an educational purpose by demonstrating how artificial intelligence identifies clinically relevant regions—potentially containing microaneurysms or exudates—to assist in the automated screening and classification of diabetic retinal lesions.
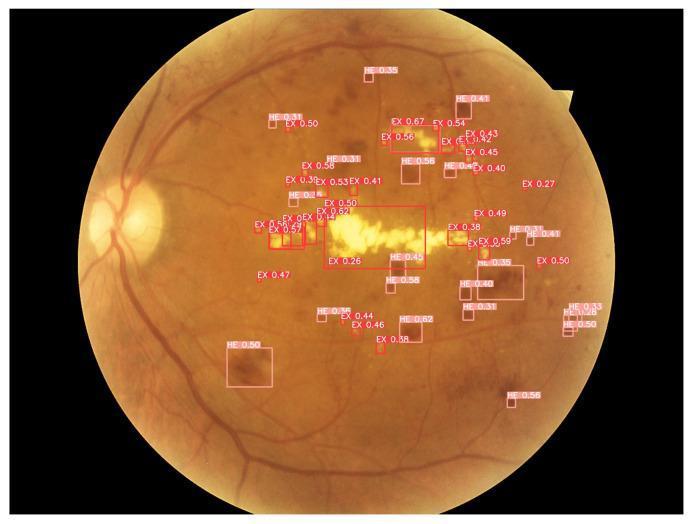
This diagnostic image is a color fundus photograph demonstrating clinical signs of diabetic retinopathy, including hard exudates (EX) and hemorrhages (HE). The fundus view shows the optic disc on the left and various retinal pathologies labeled with automated detection bounding boxes. A significant cluster of yellowish, waxy hard exudates is concentrated in the central macula and mid-peripheral regions, exhibiting morphology that ranges from small punctate spots to larger, coalesced amorphous plaques. Interspersed throughout the retina are multiple dark red hemorrhages, appearing as varying sizes of blotch-like and dot-like lesions. These findings indicate localized vascular leakage and retinal ischemia. The image serves as an educational example of automated lesion detection in ophthalmology, specifically identifying markers of non-proliferative diabetic retinopathy. The bounding boxes indicate machine learning classification of these features, highlighting the clinical significance of distribution and morphology in staging retinal vascular disease.
proliferative diabetic retinopathy neovascularization vitreous hemorrhage
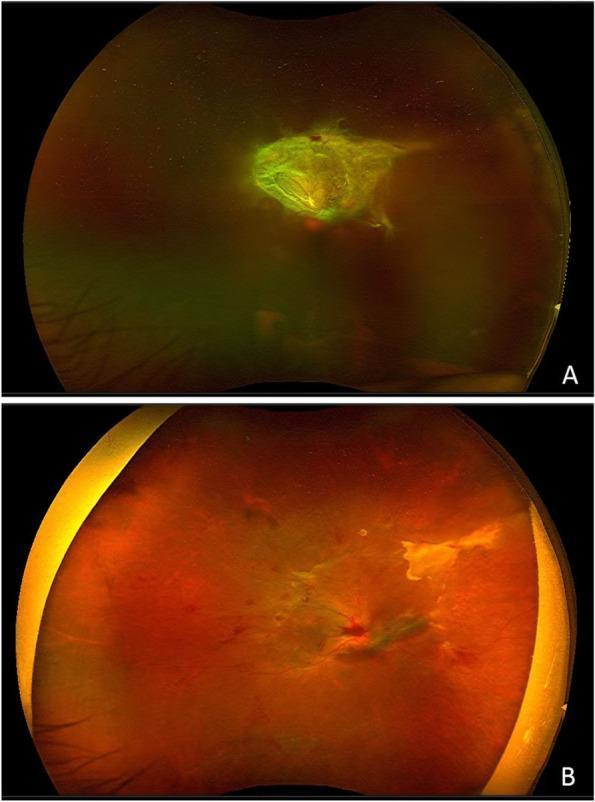
This clinical comparison chart presents two wide-field fundus photographs (A and B) illustrating a case of proliferative diabetic retinopathy (PDR) with non-clearing vitreous hemorrhage before and after surgical intervention. Image A (preoperative) shows a significantly obscured retinal view with a hazy, greenish cast characteristic of vitreous hemorrhage. A large, prominent, amorphous fibrovascular membrane is positioned centrally over the optic disc, appearing elevated and translucent with focal areas of neovascularization. Image B (one week postoperative) demonstrates a clear fundus with marked improvement in visibility. The greenish haze has resolved, revealing the underlying retinal architecture and the optic disc. Only minor residual hemorrhage and remnants of the fibrovascular traction are visible, indicating successful vitrectomy and surgical clearance. This comparison serves as a clinical education tool for identifying the complications of PDR and assessing surgical outcomes in patients undergoing vitrectomy with viscoelastic agents.
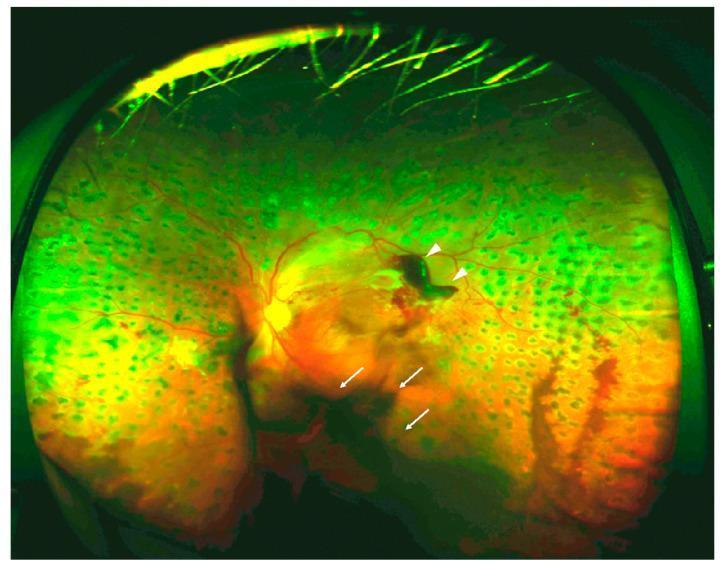
This diagnostic image is an ultra-widefield fundus photograph of a human eye exhibiting signs of advanced Proliferative Diabetic Retinopathy (PDR). The image highlights critical secondary complications of retinal neovascularization. A localized, dense, dark-red preretinal hemorrhage (indicated by white arrowheads) is visible in the superior-temporal arcade, obscuring underlying retinal vessels. More inferiorly, diffuse and hazy vitreous hemorrhage (indicated by white arrows) appears as a larger, less-defined opacity within the vitreous cavity, partially masking the optic disc and central macula. The peripheral retina shows extensive panretinal photocoagulation (PRP) laser scars, appearing as a regular pattern of circular, hyperpigmented/hypopigmented spots. The presence of these active hemorrhages demonstrates vascular vulnerability and tractional forces typical of PDR, emphasizing the risk of significant vision loss. This visual is suitable for ophthalmology education focusing on diabetic eye disease and the differentiation between intraretinal, preretinal, and vitreous bleeding.
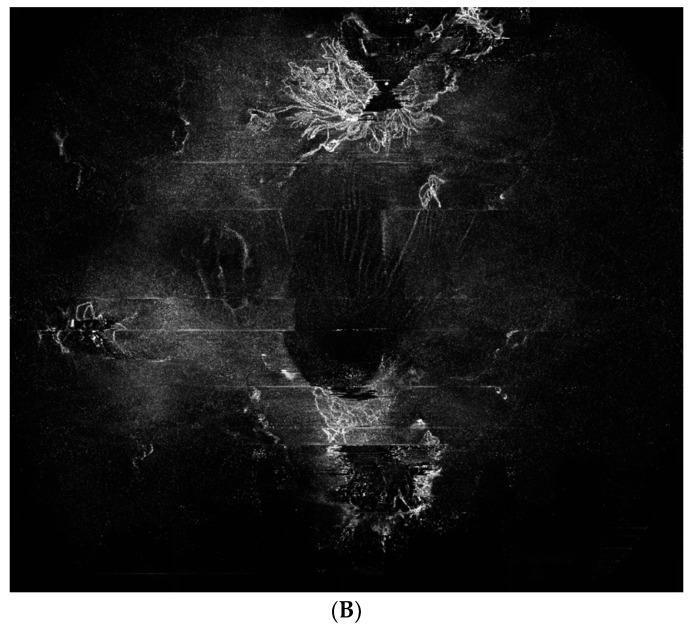
This Wide-Field Optical Coherence Tomography Angiography (WF-OCTA) image demonstrates proliferative diabetic retinopathy (PDR). The image is an internal limiting membrane (ILM) slab en face view, which highlights vascular structures at the vitreoretinal interface. Prominent, bright, disorganized tufts of neovascularization (NV) are visible, particularly in the superior and inferior regions. These hyperreflective features represent pathological new vessels protruding from the retina into the vitreous cavity. The surrounding background shows significant areas of hypoperfusion and signal void, consistent with retinal ischemia. Horizontal linear artifacts are present across the scan, likely related to eye movement or image acquisition. The central area displays a darker, dense signal void which may correspond to shadowing from an overlying vitreous hemorrhage. This diagnostic image is used to assess the extent of neovascularization elsewhere (NVE) and guide treatment decisions in advanced diabetic eye disease.
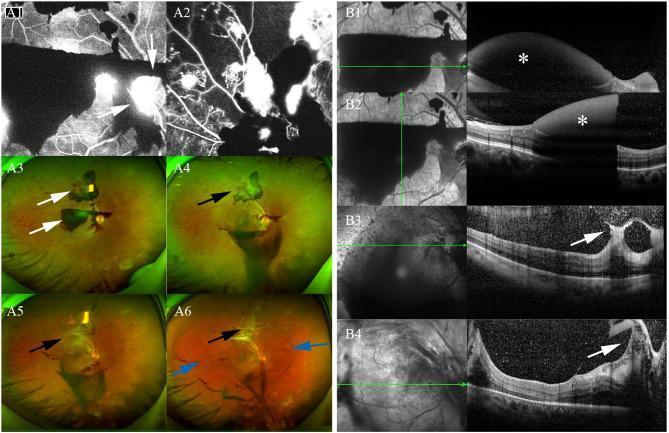
This composite multimodal imaging series documents the progression of proliferative diabetic retinopathy (PDR) and the evolution of preretinal hemorrhage. The panel includes Fundus Fluorescein Angiography (FFA), color fundus photography (A1–A6), and Optical Coherence Tomography (OCT) (B1–B4). Initial FFA (A1, A2) identifies extensive non-perfusion areas and active neovascularization. Early fundus images (A1, A3) show dense preretinal hemorrhage obscuring the optic disc. Serial images (A4–A6) demonstrate the progression of fibrovascular proliferation (black arrows) following hemorrhage drainage. A6 reveals a detached posterior hyaloid appearing as a clear elliptic boundary (blue arrows). Corresponding OCT scans (B1, B2) visualize the dense preretinal hemorrhage as a highly reflective, dome-shaped mass beneath the internal limiting membrane (ILM) or within the sub-hyaloid space (asterisks). Longitudinal OCT follow-up (B3, B4) highlights the development of secondary fibrovascular traction (white arrows) and thickening of the preretinal membranes as the hemorrhage resolves. This case illustrates the clinical progression from acute vitreous/preretinal hemorrhage to severe proliferative changes and vitreoretinal traction in a patient with diabetic retinopathy.
diabetic macular edema OCT optical coherence tomography
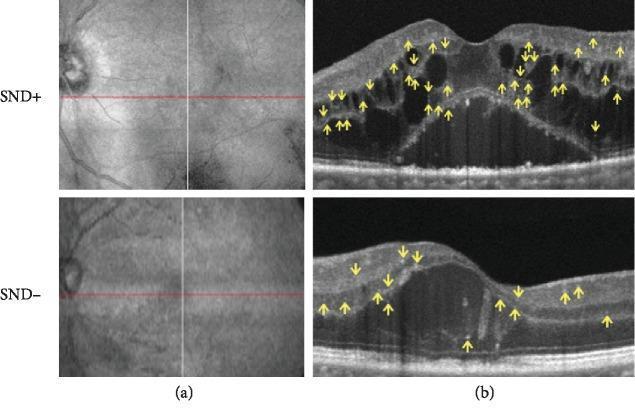
Optical coherence tomography (OCT) imaging comparison of diabetic macular edema (DME) categorized by subfoveal neuroretinal detachment (SND) status. Column (a) presents infrared (IR) reflectance fundus images with a horizontal red reference line indicating the B-scan acquisition plane. Column (b) shows corresponding cross-sectional OCT B-scans for SND+ (top) and SND- (bottom) clinical presentations. The SND+ scan demonstrates significant intraretinal pathology, including multiple hyporeflective cystoid spaces indicative of cystoid macular edema (CME) and a large subfoveal fluid collection (SND) separating the neurosensory retina from the retinal pigment epithelium. Yellow arrows highlight numerous hyperreflective retinal spots (HRS) scattered across both the inner and outer retinal layers. In contrast, the SND- B-scan displays retinal thickening and minor architectural disruption but lacks the subfoveal detachment and shows a markedly lower density of HRS. This comparison illustrates the structural biomarkers used to assess inflammatory and vascular components of diabetic retinopathy, with HRS serving as potential indicators of microglial activation and neuroinflammation.
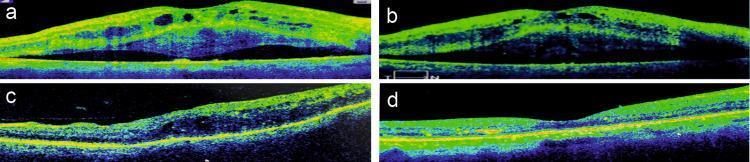
Diagnostic optical coherence tomography (OCT) scans demonstrating a comparison between pre-treatment and post-treatment states of bilateral macular edema. Images (a) and (b) represent the right and left eyes before treatment, showing significant diabetic macular edema (DME). Key pathological findings include intraretinal fluid with multiple cystoid spaces, diffuse retinal thickening, and a prominent paradoxical neurosensory detachment (NSD), visible as a dark hyporeflective space between the neurosensory retina and the retinal pigment epithelium (RPE). Images (c) and (d) show the same eyes one month after the administration of an intravitreal dexamethasone implant (Ozurdex). These follow-up scans demonstrate a successful therapeutic response characterized by the complete resolution of the subretinal fluid, closure of cystoid spaces, and significant reduction in central macular thickness (CMT). The neurosensory retina is shown to be fully reattached to the RPE with restoration of more normal foveal contour, illustrating the efficacy of corticosteroid implants in managing refractory or paradoxical macular edema.
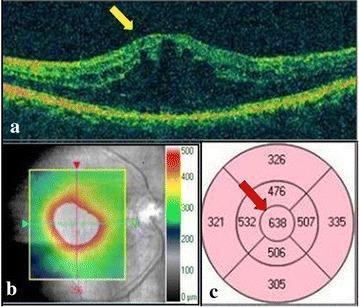
A three-part composite diagnostic image showing Spectral Domain Optical Coherence Tomography (SD-OCT) findings for Diabetic Macular Edema (DME). Panel (a) presents a horizontal cross-sectional OCT B-scan demonstrating significant foveal thickening with intraretinal cystic spaces and altered reflectivity, highlighted by a yellow arrow, indicating cystoid macular edema. Panel (b) shows a 6x6 mm macular cube thickness overlay map; the color scale (green to red) indicates topographic retinal thickness, with a large central red/white area signifying severe thickening exceeding 500 µm. Panel (c) displays an Early Treatment Diabetic Retinopathy Study (ETDRS) grid map providing quantitative data. A red arrow points to the central subfield, which shows a significantly elevated retinal thickness of 638 µm. This clinical visual illustrates the diagnostic hallmarks used in ophthalmology to assess the severity of diabetic retinopathy and macular fluid accumulation.
mkdir -p /tmp/workspace/diabetic-retinopathy-ppt && ls /tmp/workspace/
~/diabetic-retinopathy-ppt/build_ppt.py
import json
import subprocess
import base64
from io import BytesIO
from pptx import Presentation
from pptx.util import Inches, Pt, Emu
from pptx.dml.color import RGBColor
from pptx.enum.text import PP_ALIGN, MSO_ANCHOR
from pptx.util import Inches, Pt

# ─── Color Palette ───────────────────────────────────────────────────────────
DARK_BLUE   = RGBColor(0x1A, 0x35, 0x5E)   # deep navy
MED_BLUE    = RGBColor(0x1E, 0x6E, 0xB5)   # cornflower blue
ACCENT      = RGBColor(0xE8, 0x4F, 0x3F)   # warm red accent
LIGHT_GREY  = RGBColor(0xF4, 0xF6, 0xF9)   # slide bg
WHITE       = RGBColor(0xFF, 0xFF, 0xFF)
TEXT_DARK   = RGBColor(0x1A, 0x1A, 0x2E)
TEXT_MED    = RGBColor(0x3A, 0x3A, 0x5C)
GOLD        = RGBColor(0xF5, 0xA6, 0x23)
TEAL        = RGBColor(0x00, 0x96, 0x88)

W = Inches(13.333)
H = Inches(7.5)

prs = Presentation()
prs.slide_width  = W
prs.slide_height = H
blank = prs.slide_layouts[6]

# ─── Helper utilities ────────────────────────────────────────────────────────

def add_rect(slide, x, y, w, h, fill_color, alpha=None):
    from pptx.util import Emu
    from pptx.oxml.ns import qn
    shape = slide.shapes.add_shape(1, x, y, w, h)  # MSO_SHAPE_TYPE.RECTANGLE=1
    shape.line.fill.background()
    if fill_color:
        shape.fill.solid()
        shape.fill.fore_color.rgb = fill_color
    return shape

def add_text(slide, text, x, y, w, h, size=18, bold=False, color=TEXT_DARK,
             align=PP_ALIGN.LEFT, italic=False, wrap=True, font="Calibri"):
    tb = slide.shapes.add_textbox(x, y, w, h)
    tf = tb.text_frame
    tf.word_wrap = wrap
    tf.margin_left   = Inches(0.05)
    tf.margin_right  = Inches(0.05)
    tf.margin_top    = Inches(0.03)
    tf.margin_bottom = Inches(0.03)
    p = tf.paragraphs[0]
    p.alignment = align
    run = p.add_run()
    run.text = text
    run.font.name   = font
    run.font.size   = Pt(size)
    run.font.bold   = bold
    run.font.italic = italic
    run.font.color.rgb = color
    return tb

def add_multiline(slide, lines, x, y, w, h, size=16, color=TEXT_DARK,
                  bullet=False, bold_first=False, font="Calibri", line_spacing=1.15):
    from pptx.util import Pt as PPt
    from pptx.oxml.ns import qn
    import lxml.etree as etree
    tb = slide.shapes.add_textbox(x, y, w, h)
    tf = tb.text_frame
    tf.word_wrap = True
    tf.margin_left   = Inches(0.08)
    tf.margin_right  = Inches(0.08)
    tf.margin_top    = Inches(0.04)
    tf.margin_bottom = Inches(0.04)
    for i, line in enumerate(lines):
        if i == 0:
            p = tf.paragraphs[0]
        else:
            p = tf.add_paragraph()
        p.alignment = PP_ALIGN.LEFT
        # line spacing
        p.space_after = PPt(4)
        if bullet and not (bold_first and i == 0):
            p.level = 0
        run = p.add_run()
        if isinstance(line, tuple):
            run.text = line[0]
            run.font.bold = line[1]
        else:
            run.text = ("• " if bullet else "") + line
            run.font.bold = (bold_first and i == 0)
        run.font.name  = font
        run.font.size  = PPt(size)
        run.font.color.rgb = color
    return tb

def bg(slide, color=LIGHT_GREY):
    add_rect(slide, 0, 0, W, H, color)

def header_bar(slide, title, subtitle=None, bar_color=DARK_BLUE):
    # top colored bar
    add_rect(slide, 0, 0, W, Inches(1.05), bar_color)
    add_text(slide, title, Inches(0.45), Inches(0.12), Inches(11), Inches(0.75),
             size=32, bold=True, color=WHITE, font="Calibri")
    if subtitle:
        add_text(slide, subtitle, Inches(0.45), Inches(0.7), Inches(11), Inches(0.35),
                 size=16, color=RGBColor(0xCC, 0xDD, 0xFF), font="Calibri")
    # accent line
    add_rect(slide, 0, Inches(1.05), W, Inches(0.045), ACCENT)

def footer(slide, source_text):
    add_rect(slide, 0, Inches(7.15), W, Inches(0.35), DARK_BLUE)
    add_text(slide, source_text, Inches(0.3), Inches(7.17), Inches(12.5), Inches(0.3),
             size=10, color=RGBColor(0xAA, 0xBB, 0xDD), font="Calibri")

def section_card(slide, x, y, w, h, title, bullets, bg_color=WHITE, title_color=DARK_BLUE,
                 text_color=TEXT_DARK, title_size=17, text_size=14.5):
    add_rect(slide, x, y, w, h, bg_color)
    # small accent bar on left
    add_rect(slide, x, y, Inches(0.06), h, MED_BLUE)
    add_text(slide, title, x+Inches(0.12), y+Inches(0.08), w-Inches(0.2), Inches(0.35),
             size=title_size, bold=True, color=title_color)
    content_y = y + Inches(0.42)
    content_h  = h - Inches(0.5)
    add_multiline(slide, bullets, x+Inches(0.12), content_y, w-Inches(0.2), content_h,
                  size=text_size, color=text_color, bullet=True)

def embed_image(slide, url, x, y, w, h):
    try:
        result = json.loads(subprocess.check_output(
            ["python", "/tmp/skills/shared/scripts/fetch_images.py", url], timeout=20
        ))
        if result and result[0].get("base64"):
            raw = base64.b64decode(result[0]["base64"].split(",")[-1])
            slide.shapes.add_picture(BytesIO(raw), x, y, w, h)
            return True
    except Exception as e:
        print(f"Image fetch failed for {url}: {e}")
    return False

# ═══════════════════════════════════════════════════════════════════════════
# SLIDE 1 — TITLE SLIDE
# ═══════════════════════════════════════════════════════════════════════════
slide = prs.slides.add_slide(blank)
# Full dark background
add_rect(slide, 0, 0, W, H, DARK_BLUE)
# Decorative accent rect right side
add_rect(slide, Inches(9.8), 0, Inches(3.533), H, RGBColor(0x0F, 0x24, 0x48))
# Gold bar
add_rect(slide, 0, Inches(2.9), Inches(9.6), Inches(0.07), GOLD)
# Title
add_text(slide, "DIABETIC RETINOPATHY",
         Inches(0.6), Inches(1.3), Inches(9.0), Inches(1.2),
         size=48, bold=True, color=WHITE, font="Calibri")
add_text(slide, "A Comprehensive Review for Ophthalmology Residents",
         Inches(0.6), Inches(2.55), Inches(9.0), Inches(0.5),
         size=20, color=GOLD, italic=True, font="Calibri")
add_text(slide, "2nd Year Ophthalmology Residency  |  August 2026",
         Inches(0.6), Inches(3.2), Inches(9.0), Inches(0.4),
         size=15, color=RGBColor(0xAA, 0xBB, 0xCC), font="Calibri")
# sources tag
add_text(slide, "Sources: Kanski's Clinical Ophthalmology 10th Ed  |  Wills Eye Manual 8th Ed  |  Harrison's Principles 22nd Ed",
         Inches(0.6), Inches(6.9), Inches(12.0), Inches(0.4),
         size=11, color=RGBColor(0x77, 0x99, 0xBB), italic=True, font="Calibri")

# ═══════════════════════════════════════════════════════════════════════════
# SLIDE 2 — OVERVIEW & EPIDEMIOLOGY
# ═══════════════════════════════════════════════════════════════════════════
slide = prs.slides.add_slide(blank)
bg(slide)
header_bar(slide, "Overview & Epidemiology", "Why DR Matters")
footer(slide, "Kanski's Clinical Ophthalmology 10th Ed, p.506 | Harrison's Principles 22nd Ed")

epi_bullets = [
    "DR is the commonest cause of new blindness in most industrialised countries",
    "Prevalence ~40% in all diabetic patients",
    "Type 2 diabetes: 67% prevalence of DR at 10 years after diagnosis; 10% will develop PDR",
    "DR is more common in Type 1 than Type 2 diabetes",
    "With effective screening + ETDRS / anti-VEGF implementation, risk of severe visual loss <5%",
    "Retinopathy eventually appears in nearly all long-standing cases"
]
section_card(slide, Inches(0.35), Inches(1.25), Inches(6.1), Inches(5.85),
             "Key Facts", epi_bullets, bg_color=WHITE)

ophthal_bullets = [
    "Common: Maculopathy (DME + macular ischaemia), retinal ischaemia, vitreous haemorrhage",
    "Common: Unstable refraction, accelerated age-related cataract",
    "Uncommon: Tractional retinal detachment, NVG, ocular motor nerve palsies",
    "Rare: Diabetic papillopathy, Wolfram syndrome, acute-onset cataract"
]
section_card(slide, Inches(6.7), Inches(1.25), Inches(6.25), Inches(5.85),
             "Ophthalmic Complications of Diabetes", ophthal_bullets, bg_color=WHITE)

# ═══════════════════════════════════════════════════════════════════════════
# SLIDE 3 — RISK FACTORS
# ═══════════════════════════════════════════════════════════════════════════
slide = prs.slides.add_slide(blank)
bg(slide)
header_bar(slide, "Risk Factors for Diabetic Retinopathy", bar_color=RGBColor(0x0D, 0x47, 0x8A))
footer(slide, "Kanski's Clinical Ophthalmology 10th Ed, p.507")

risk_main = [
    "Duration of diabetes — most important predictor",
    "Poor glycaemic control (HbA1c) — landmark evidence from DCCT & UKPDS",
    "Hypertension — systolic control especially important",
    "Nephropathy — strong correlation with retinopathy severity",
    "Hyperlipidaemia — associated with hard exudate formation",
    "Anaemia — worsens retinal ischaemia",
    "Pregnancy — accelerates progression; review frequency up to 2-weekly if DR present",
    "Cataract surgery — may accelerate macular oedema",
    "Puberty — risk increases after puberty in Type 1 DM"
]
section_card(slide, Inches(0.35), Inches(1.25), Inches(7.5), Inches(5.85),
             "Risk Factors", risk_main, bg_color=WHITE, title_size=18, text_size=15)

studies_bullets = [
    "DCCT (1993): Intensive glycaemic control in T1DM reduces DR onset by 76% and progression by 54%",
    "UKPDS (1998): Each 1% reduction in HbA1c = 35% reduction in microvascular complications in T2DM",
    "UKPDS also showed tight BP control reduces risk of DR progression"
]
section_card(slide, Inches(8.05), Inches(1.25), Inches(4.95), Inches(5.85),
             "Landmark Trials", studies_bullets,
             bg_color=RGBColor(0xE8, 0xF4, 0xFF), title_color=MED_BLUE, text_size=14)

# ═══════════════════════════════════════════════════════════════════════════
# SLIDE 4 — PATHOGENESIS
# ═══════════════════════════════════════════════════════════════════════════
slide = prs.slides.add_slide(blank)
bg(slide)
header_bar(slide, "Pathogenesis", "Microangiopathy & Molecular Mechanisms", bar_color=RGBColor(0x1A, 0x55, 0x7A))
footer(slide, "Kanski's Clinical Ophthalmology 10th Ed, p.507 | Harrison's 22nd Ed")

path_bullets = [
    "DR is predominantly a microangiopathy — small blood vessels especially vulnerable to hyperglycaemia",
    "Direct hyperglycaemic effects on retinal cells also contribute",
    "Pericyte loss is the earliest and most specific histological change",
    "Pericyte loss → capillary wall weakening → microaneurysm formation",
    "Endothelial cell damage → breakdown of blood-retinal barrier (BRB)",
    "BRB breakdown → retinal oedema and exudate leakage",
    "Capillary occlusion + non-perfusion → retinal ischaemia",
    "Ischaemia → upregulation of VEGF (Vascular Endothelial Growth Factor)",
    "VEGF: key angiogenic stimulator driving neovascularisation in PDR",
    "Other pathways: AGE formation, PKC activation, polyol pathway, oxidative stress"
]
section_card(slide, Inches(0.35), Inches(1.25), Inches(7.5), Inches(5.85),
             "Pathogenesis Cascade", path_bullets, bg_color=WHITE, text_size=14.5)

# Histology image
embed_image(slide,
    "https://cdn.orris.care/cdss_images/b7574867ea2a174b6b0040fe02ecf20e15dc9349c662d45e4fa91ab05d329a2b.png",
    Inches(8.05), Inches(1.25), Inches(5.0), Inches(2.8))
add_text(slide, "Normal retinal capillary bed (trypsin digest) — endothelial cells\n(elongated nuclei) and pericytes (rounded nuclei)",
         Inches(8.05), Inches(4.1), Inches(4.9), Inches(0.8),
         size=11, italic=True, color=TEXT_MED)

vegf_bullets = [
    "VEGF is the primary driver of neovascularisation",
    "Anti-VEGF agents (ranibizumab, bevacizumab, aflibercept, faricimab) block this pathway",
    "Both PDR and DME benefit from anti-VEGF therapy"
]
section_card(slide, Inches(8.05), Inches(5.0), Inches(4.95), Inches(2.1),
             "VEGF — Central Role", vegf_bullets,
             bg_color=RGBColor(0xE8, 0xF4, 0xFF), title_color=MED_BLUE, text_size=13)

# ═══════════════════════════════════════════════════════════════════════════
# SLIDE 5 — CLASSIFICATION (ETDRS)
# ═══════════════════════════════════════════════════════════════════════════
slide = prs.slides.add_slide(blank)
bg(slide)
header_bar(slide, "Classification of Diabetic Retinopathy", "ETDRS / International Clinical DR Scale", bar_color=DARK_BLUE)
footer(slide, "Kanski's Clinical Ophthalmology 10th Ed, p.507 | Wills Eye Manual, p.811")

# Table-style cards across the slide
stages = [
    ("No DR",            WHITE,             MED_BLUE,
     ["No abnormalities", "Review in 12 months"]),
    ("Mild NPDR",        RGBColor(0xE8,0xF8,0xE8), RGBColor(0x2E,0x7D,0x32),
     ["Microaneurysms only", "Review 6-12 months"]),
    ("Moderate NPDR",    RGBColor(0xFF,0xFB,0xE5), RGBColor(0xF5,0x7F,0x17),
     ["MAs + haemorrhages + exudates + CWSs ± venous beading", "Review 3-6 months"]),
    ("Severe NPDR\n(4-2-1 Rule)", RGBColor(0xFF,0xF0,0xDD), RGBColor(0xE6,0x5C,0x00),
     [">20 IRHA in ALL 4 quadrants, OR", "Venous beading in ≥2 quadrants, OR",
      "IRMA in ≥1 quadrant", "Review 1-3 months; consider PRP"]),
    ("PDR",              RGBColor(0xFF,0xE5,0xE5), ACCENT,
     ["NVD and/or NVE", "± vitreous/preretinal haemorrhage",
      "High-risk PDR: NVD >1/3 DA, any NVD + VH,", "NVE >1/2 DA + VH — PRP indicated"]),
]

card_w = Inches(2.5)
card_h = Inches(5.6)
gap    = Inches(0.11)
start_x = Inches(0.35)

for i, (stage, bg_c, title_c, bullets) in enumerate(stages):
    cx = start_x + i * (card_w + gap)
    # card bg
    add_rect(slide, cx, Inches(1.2), card_w, card_h, bg_c)
    add_rect(slide, cx, Inches(1.2), card_w, Inches(0.06), title_c)
    add_text(slide, stage, cx+Inches(0.1), Inches(1.27), card_w-Inches(0.15), Inches(0.5),
             size=15, bold=True, color=title_c, align=PP_ALIGN.LEFT, wrap=True)
    add_multiline(slide, bullets,
                  cx+Inches(0.1), Inches(1.85), card_w-Inches(0.18), Inches(4.85),
                  size=12.5, color=TEXT_DARK, bullet=True)

# ═══════════════════════════════════════════════════════════════════════════
# SLIDE 6 — SIGNS: NPDR
# ═══════════════════════════════════════════════════════════════════════════
slide = prs.slides.add_slide(blank)
bg(slide)
header_bar(slide, "Clinical Signs — NPDR", "Background & Pre-proliferative Features", bar_color=RGBColor(0x2E, 0x7D, 0x32))
footer(slide, "Kanski's Clinical Ophthalmology 10th Ed, p.508-515")

npdr_signs = [
    ("Microaneurysms", [
        "Earliest ophthalmoscopically visible change",
        "Appear as tiny red dots, usually temporal to fovea",
        "Due to focal weakness in capillary wall after pericyte loss",
        "May leak → oedema, or thrombose → disappear"
    ]),
    ("Haemorrhages", [
        "Dot & blot haemorrhages — deep retinal layers (INL/ONL)",
        "Flame haemorrhages — NFL (less common in DR)"
    ]),
    ("Hard Exudates", [
        "Yellow-white waxy deposits — lipid + lipoprotein leakage",
        "Ring (circinate) pattern around leaking MAs",
        "Indicate BRB breakdown; threaten vision if subfoveal"
    ]),
    ("Cotton-Wool Spots", [
        "Nerve fibre layer infarcts → cystoid bodies",
        "Indicate pre-proliferative stage",
        "Fluffy white superficial lesions"
    ]),
    ("Venous Changes", [
        "Venous dilatation → looping → beading → severe segmentation",
        "Venous beading: sausage-like irregularity — ominous sign",
        "Strongly associated with retinal ischaemia"
    ]),
    ("IRMA", [
        "Intraretinal microvascular abnormalities",
        "Dilated capillary channels in areas of non-perfusion",
        "Hallmark of pre-proliferative DR; do NOT cross ILM"
    ]),
]

ncols = 3
col_w = Inches(4.2)
col_h = Inches(2.6)
gap_x = Inches(0.13)
gap_y = Inches(0.13)
sx = Inches(0.35)
sy = Inches(1.22)

for idx, (title, bullets) in enumerate(npdr_signs):
    row = idx // ncols
    col = idx % ncols
    cx = sx + col * (col_w + gap_x)
    cy = sy + row * (col_h + gap_y)
    section_card(slide, cx, cy, col_w, col_h, title, bullets, text_size=12.5)

# ═══════════════════════════════════════════════════════════════════════════
# SLIDE 7 — SIGNS: PDR & ADVANCED DISEASE
# ═══════════════════════════════════════════════════════════════════════════
slide = prs.slides.add_slide(blank)
bg(slide)
header_bar(slide, "Clinical Signs — PDR & Advanced Disease", bar_color=RGBColor(0x8B, 0x00, 0x00))
footer(slide, "Kanski's Clinical Ophthalmology 10th Ed, p.508-521 | Wills Eye Manual, p.811")

pdr_left = [
    "NVD — new vessels on/within 1 disc diameter of disc",
    "NVE — new vessels elsewhere in retina",
    "NVI (rubeosis iridis) — iris neovascularisation → NVG",
    "NVA — new vessels in angle → secondary closed-angle glaucoma",
    "Preretinal haemorrhage — boat-shaped, between retina and vitreous",
    "Vitreous haemorrhage — reduces/eliminates fundal view"
]
section_card(slide, Inches(0.35), Inches(1.2), Inches(5.9), Inches(3.15),
             "PDR Features", pdr_left, text_size=13.5)

pdr_right = [
    "Fibrovascular proliferation → traction on vitreoretinal interface",
    "Tractional retinal detachment — especially macula-off = severe VA loss",
    "Neovascular glaucoma (NVG) — painful blind eye in end-stage",
    "Diabetic papillopathy — optic disc swelling, usually benign in DR"
]
section_card(slide, Inches(0.35), Inches(4.5), Inches(5.9), Inches(2.7),
             "Advanced Diabetic Eye Disease", pdr_right,
             bg_color=RGBColor(0xFF, 0xEE, 0xEE), title_color=ACCENT, text_size=13.5)

high_risk = [
    "Any of the following defines HIGH-RISK PDR:",
    "   → Vitreous/preretinal haemorrhage",
    "   → Any active neovascularisation",
    "   → NVD on/within 1 DD of disc",
    "   → NVD >1/3 disc area",
    "   → NVE >1/2 disc area + haemorrhage"
]
section_card(slide, Inches(6.5), Inches(1.2), Inches(6.5), Inches(5.8),
             "High-Risk PDR Criteria (DRS Study)", high_risk,
             bg_color=RGBColor(0xFF, 0xF0, 0xF0), title_color=RGBColor(0xC0, 0x00, 0x00),
             text_size=14.5)

# ═══════════════════════════════════════════════════════════════════════════
# SLIDE 8 — DIABETIC MACULOPATHY
# ═══════════════════════════════════════════════════════════════════════════
slide = prs.slides.add_slide(blank)
bg(slide)
header_bar(slide, "Diabetic Maculopathy", "Leading Cause of Visual Impairment in DR", bar_color=RGBColor(0x1A, 0x55, 0x7A))
footer(slide, "Kanski's Clinical Ophthalmology 10th Ed, p.508 | Wills Eye Manual, p.811")

types_bullets = [
    ("Focal DME", [
        "Localised leakage from MAs or dilated capillaries",
        "Circinate hard exudates surrounding leaking MAs",
        "Well-defined foveal thickening"
    ]),
    ("Diffuse DME", [
        "Generalised retinal capillary leakage",
        "Cystoid macular oedema pattern on OCT",
        "Diffuse retinal thickening"
    ]),
    ("CSME (Clinically Significant\nMacular Oedema)", [
        "ETDRS definition — treatment required:",
        "• Retinal thickening at/within 500µm of foveal centre",
        "• Hard exudates at/within 500µm with adjacent thickening",
        "• Retinal thickening ≥1 DA within 1 DA of foveal centre"
    ]),
    ("Macular Ischaemia", [
        "FAZ enlargement on FFA",
        "Visual loss may be severe",
        "No effective treatment currently",
        "Poor visual prognosis"
    ]),
]

card_w2 = Inches(3.05)
for i, (t, b) in enumerate(types_bullets):
    cx = Inches(0.35) + i * (card_w2 + Inches(0.13))
    section_card(slide, cx, Inches(1.2), card_w2, Inches(4.2), t, b, text_size=13)

oct_bullets = [
    "OCT is gold standard for DME diagnosis and follow-up",
    "Measures central macular thickness (CMT) objectively",
    "Identifies intraretinal fluid, subretinal fluid, ERM, VMT",
    "Biomarkers: Disorganisation of Retinal Inner Layers (DRIL) — poor prognosis",
    "CMT >250µm at foveal centre = significant DME",
    "OCT-A can visualise FAZ without dye injection"
]
section_card(slide, Inches(0.35), Inches(5.55), Inches(12.65), Inches(1.65),
             "OCT in DME — Gold Standard Investigation", oct_bullets,
             bg_color=RGBColor(0xE8, 0xF4, 0xFF), title_color=MED_BLUE,
             text_size=13.5)

# ═══════════════════════════════════════════════════════════════════════════
# SLIDE 9 — INVESTIGATIONS
# ═══════════════════════════════════════════════════════════════════════════
slide = prs.slides.add_slide(blank)
bg(slide)
header_bar(slide, "Investigations", "Imaging & Systemic Workup", bar_color=RGBColor(0x1B, 0x5E, 0x20))
footer(slide, "Kanski's Clinical Ophthalmology 10th Ed | Wills Eye Manual, p.811-813")

inv_data = [
    ("Fundus Examination", [
        "Dilated fundoscopy — essential first step",
        "Slit-lamp + 78D/90D lens for posterior pole",
        "Binocular indirect ophthalmoscopy for periphery",
        "Document ETDRS stage at each visit"
    ]),
    ("Fundus Fluorescein\nAngiography (FFA)", [
        "Assesses capillary non-perfusion areas",
        "Detects and localises microaneurysms",
        "Maps FAZ — diagnoses macular ischaemia",
        "Guides focal laser in DME",
        "Leakage in early frames = DME"
    ]),
    ("Optical Coherence\nTomography (OCT)", [
        "Gold standard for DME",
        "Quantifies macular thickness (CMT)",
        "Identifies IRF, SRF, ERM, VMT",
        "Monitors treatment response"
    ]),
    ("OCT-Angiography\n(OCT-A)", [
        "Visualises retinal vasculature without dye",
        "Detects capillary non-perfusion & FAZ",
        "Images superficial + deep capillary plexus",
        "Useful for NVD/NVE detection"
    ]),
    ("B-scan Ultrasonography", [
        "When media hazy (vitreous haemorrhage)",
        "Detects tractional RD",
        "Rules out other posterior segment pathology"
    ]),
    ("Systemic Workup", [
        "HbA1c, fasting glucose",
        "BP measurement (every visit)",
        "Lipid profile",
        "Renal function (eGFR, urine microalbumin)",
        "Refer to physician for systemic optimisation"
    ]),
]

ncols = 3
col_w = Inches(4.2)
col_h = Inches(2.7)
for idx, (title, bullets) in enumerate(inv_data):
    row = idx // ncols
    col = idx % ncols
    cx = Inches(0.35) + col * (col_w + Inches(0.13))
    cy = Inches(1.22) + row * (col_h + Inches(0.1))
    section_card(slide, cx, cy, col_w, col_h, title, bullets, text_size=12.5)

# ═══════════════════════════════════════════════════════════════════════════
# SLIDE 10 — TREATMENT: DME
# ═══════════════════════════════════════════════════════════════════════════
slide = prs.slides.add_slide(blank)
bg(slide)
header_bar(slide, "Treatment of Diabetic Macular Oedema", "Anti-VEGF First-Line", bar_color=RGBColor(0x00, 0x60, 0x64))
footer(slide, "Kanski's Clinical Ophthalmology 10th Ed, p.515 | Wills Eye Manual, p.813 | ETDRS, DRCR.net Protocols")

dme_tx = [
    ("Anti-VEGF Therapy\n(First-line)", [
        "Agents: Ranibizumab (Lucentis), Bevacizumab (Avastin),",
        "        Aflibercept (Eylea), Faricimab (Vabysmo)",
        "Intravitreal injections; monthly loading → PRN or T&E",
        "Improvement in BCVA after 3 injections = strong predictor",
        "  of long-term response (Kanski's, p.529)",
        "Protocol 'T' (DRCR.net): aflibercept superior for VA <69 letters"
    ]),
    ("Focal/Grid Laser\n(Adjunct)", [
        "ETDRS focal laser for CSME (non-central)",
        "Treats leaking MAs directly",
        "Subthreshold micropulse laser — preserves RPE",
        "No longer first-line for centre-involving DME",
        "Useful in anti-VEGF non-responders"
    ]),
    ("Intravitreal\nCorticosteroids", [
        "Triamcinolone acetonide (off-label)",
        "Dexamethasone implant (Ozurdex) — 6-month release",
        "Fluocinolone acetonide implant (Iluvien) — 36-month",
        "Reserved for anti-VEGF non-responders",
        "Pseudophakic patients preferred (cataract risk)",
        "IOP monitoring essential (steroid-responders)"
    ]),
    ("Vitreoretinal Surgery\n(Selected Cases)", [
        "Pars plana vitrectomy (PPV) for:",
        "• Vitreomacular traction causing DME",
        "• Epiretinal membrane with macular distortion",
        "• Dense premacular haemorrhage",
        "• Chronic DME not responsive to other treatment"
    ]),
]

card_w3 = Inches(3.1)
for i, (t, b) in enumerate(dme_tx):
    cx = Inches(0.35) + i * (card_w3 + Inches(0.13))
    section_card(slide, cx, Inches(1.2), card_w3, Inches(5.6),
                 t, b, text_size=12.5, title_size=16)

# ═══════════════════════════════════════════════════════════════════════════
# SLIDE 11 — TREATMENT: PDR
# ═══════════════════════════════════════════════════════════════════════════
slide = prs.slides.add_slide(blank)
bg(slide)
header_bar(slide, "Treatment of Proliferative DR (PDR)", "PRP, Anti-VEGF & Surgery", bar_color=RGBColor(0x6A, 0x00, 0x00))
footer(slide, "Kanski's Clinical Ophthalmology 10th Ed, p.515-521 | Wills Eye Manual, p.814 | DRS, DRCR.net Protocol S")

pdr_tx_left = [
    "Scatter laser = MAINSTAY of PDR treatment in most healthcare systems",
    "DRS (Diabetic Retinopathy Study) established high-risk PDR criteria and PRP benefit",
    "1200-1600 burns, 500µm spot, 0.1s duration, moderate intensity",
    "Sessions: 2-3 sittings (to avoid worsening macular oedema and choroidal effusion)",
    "Reduces severe visual loss by 50% in high-risk PDR (DRS)",
    "Peripheral field loss is an accepted side effect",
    "PRP first — if view to periphery available and no significant DME"
]
section_card(slide, Inches(0.35), Inches(1.2), Inches(6.0), Inches(3.4),
             "Panretinal Photocoagulation (PRP) — DRS Guidelines", pdr_tx_left, text_size=13)

anti_vegf = [
    "Alternative to PRP — equally effective (DRCR Protocol S)",
    "Preferred if DME present (anti-VEGF treats both PDR and DME)",
    "Preferred if view to peripheral retina limited by VH",
    "CAUTION: Anti-VEGF without PRP risks worse outcomes if patient lost to follow-up",
    "Agents: ranibizumab, aflibercept, bevacizumab — monthly initially"
]
section_card(slide, Inches(0.35), Inches(4.75), Inches(6.0), Inches(2.5),
             "Anti-VEGF in PDR (DRCR Protocol S)", anti_vegf,
             bg_color=RGBColor(0xE8, 0xF4, 0xFF), title_color=MED_BLUE, text_size=13)

vitx = [
    "Vitrectomy indications (Wills Eye Manual, p.814-815):",
    "1. Dense non-clearing / recurrent VH causing significant VA loss",
    "2. Tractional RD involving / progressing within the macula",
    "3. ERM / VMT causing significant visual symptoms",
    "4. Dense premacular haemorrhage",
    "5. Chronic DME not responsive to other treatment",
    "6. Severe fibrovascular proliferation unresponsive to laser/anti-VEGF",
    "",
    "NOTE: Young T1DM patients — more aggressive PDR, may need earlier intervention"
]
section_card(slide, Inches(6.5), Inches(1.2), Inches(6.5), Inches(6.05),
             "Vitreoretinal Surgery", vitx,
             bg_color=RGBColor(0xFF, 0xF5, 0xEE), title_color=ACCENT, text_size=13.5)

# ═══════════════════════════════════════════════════════════════════════════
# SLIDE 12 — SCREENING & FOLLOW-UP
# ═══════════════════════════════════════════════════════════════════════════
slide = prs.slides.add_slide(blank)
bg(slide)
header_bar(slide, "Screening & Follow-Up Schedule", bar_color=RGBColor(0x1A, 0x35, 0x5E))
footer(slide, "Kanski's Clinical Ophthalmology 10th Ed, p.534 | Wills Eye Manual, p.815")

fu_rows = [
    ("No DR", "12 months"),
    ("Very mild NPDR", "12 months"),
    ("Mild NPDR", "6-12 months (individualized)"),
    ("Moderate NPDR", "3-6 months"),
    ("Severe NPDR", "1-3 months; consider PRP"),
    ("PDR (not high-risk)", "1 month; PRP within 1-2 weeks"),
    ("High-risk PDR", "Urgent PRP; review 1-2 weeks post-laser"),
    ("DME (centre-involving)", "Anti-VEGF; review monthly initially"),
    ("Pregnancy + any DR", "Every 2 weeks during pregnancy; dilated exam each trimester"),
]

# Table header
header_y = Inches(1.2)
add_rect(slide, Inches(0.35), header_y, Inches(7.5), Inches(0.42), DARK_BLUE)
add_text(slide, "DR Stage", Inches(0.45), header_y+Inches(0.06), Inches(4.5), Inches(0.3),
         size=14, bold=True, color=WHITE)
add_text(slide, "Review Interval", Inches(5.1), header_y+Inches(0.06), Inches(2.9), Inches(0.3),
         size=14, bold=True, color=WHITE)

row_colors = [WHITE, RGBColor(0xF0, 0xF4, 0xFF)]
for i, (stage, interval) in enumerate(fu_rows):
    ry = header_y + Inches(0.42) + i * Inches(0.56)
    rc = row_colors[i % 2]
    add_rect(slide, Inches(0.35), ry, Inches(7.5), Inches(0.56), rc)
    add_text(slide, stage, Inches(0.45), ry+Inches(0.1), Inches(4.5), Inches(0.38),
             size=13.5, color=TEXT_DARK)
    add_text(slide, interval, Inches(5.1), ry+Inches(0.1), Inches(2.85), Inches(0.38),
             size=13.5, color=MED_BLUE, bold=True)

general_tips = [
    "T1DM: First screening 5 years after diagnosis (post-puberty)",
    "T2DM: At diagnosis, then annually",
    "Screen with 7-field 35mm stereoscopic fundus photography (ETDRS standard)",
    "Digital non-mydriatic retinal photography — acceptable for community screening",
    "Dilated fundoscopy by ophthalmologist for borderline / ungradable photos",
    "Telemedicine / AI-assisted grading — validated and increasingly used",
    "Always correlate retinal findings with HbA1c, BP, and renal status"
]
section_card(slide, Inches(8.1), Inches(1.2), Inches(5.0), Inches(6.05),
             "Screening Principles", general_tips,
             bg_color=RGBColor(0xE8, 0xF4, 0xFF), title_color=MED_BLUE, text_size=13.5)

# ═══════════════════════════════════════════════════════════════════════════
# SLIDE 13 — CLINICAL IMAGES (fundus images from medical library)
# ═══════════════════════════════════════════════════════════════════════════
slide = prs.slides.add_slide(blank)
bg(slide)
header_bar(slide, "Fundus Imaging — Clinical Correlation", bar_color=RGBColor(0x00, 0x44, 0x66))
footer(slide, "Kanski's Clinical Ophthalmology 10th Ed | Harrison's Principles 22nd Ed Fig.34-15")

image_data = [
    ("https://cdn.orris.care/cdss_images/pmc_clinical_VQA_99a513f47577e524a524d6c1b0fe1257c446bf589fc687875cb9ed976d3d4bc1.jpg",
     "Microaneurysms — automated MA detection on fundus photograph (dots = MA candidates)"),
    ("https://cdn.orris.care/cdss_images/pmc_clinical_VQA_eb37d49f93f4afe771180335d27436389dd6036c1b8cc8cc964ce2ec45f7af30.jpg",
     "ETDRS std photos 3 & 4: Hard exudate grading — from early lipid deposits to dense circinate"),
    ("https://cdn.orris.care/cdss_images/pmc_clinical_VQA_c1ca072bde876cafe7678c07b919bc13ddd40a8cff7deae6fd00ff3bc04ae061.jpg",
     "PDR with preretinal (arrowheads) + vitreous haemorrhage (arrows); PRP scars visible peripherally"),
    ("https://cdn.orris.care/cdss_images/pmc_clinical_VQA_575b568fb24d2daee84389ce23c2c8880f248ce817e301897c0098fc5591c5e4.jpg",
     "SD-OCT: DME — cystoid intraretinal spaces, foveal thickening >638µm on ETDRS grid"),
]

img_w = Inches(3.0)
img_h = Inches(2.5)
cap_h = Inches(0.75)
start_x2 = Inches(0.35)
img_y = Inches(1.25)
cap_y = img_y + img_h + Inches(0.05)

for i, (url, caption) in enumerate(image_data):
    ix = start_x2 + i * (img_w + Inches(0.2))
    ok = embed_image(slide, url, ix, img_y, img_w, img_h)
    if not ok:
        add_rect(slide, ix, img_y, img_w, img_h, RGBColor(0xDD, 0xEE, 0xFF))
        add_text(slide, "[Image]", ix, img_y, img_w, img_h, size=14, color=MED_BLUE,
                 align=PP_ALIGN.CENTER)
    add_text(slide, caption, ix, cap_y, img_w, cap_h,
             size=10.5, italic=True, color=TEXT_MED, wrap=True)

# Harrison's PDR image
pdr_img_y = Inches(4.65)
ok2 = embed_image(slide,
    "https://cdn.orris.care/cdss_images/42215cc0b55233f3cbc064f6f54c8ad8cba0dc74c215bc2998ce2906e6e5237b.png",
    Inches(0.35), pdr_img_y, Inches(4.5), Inches(2.5))
add_text(slide,
    "PDR (Harrison's Fig.34-15): Neovascular vessels from disc, VH, CWS, macular exudate, PRP burns (25-yr-old, 18-yr T1DM history)",
    Inches(5.0), pdr_img_y, Inches(7.8), Inches(1.0),
    size=12, italic=True, color=TEXT_MED, wrap=True)

# ═══════════════════════════════════════════════════════════════════════════
# SLIDE 14 — SUMMARY & KEY TAKE-HOMES
# ═══════════════════════════════════════════════════════════════════════════
slide = prs.slides.add_slide(blank)
add_rect(slide, 0, 0, W, H, DARK_BLUE)
add_rect(slide, 0, Inches(1.1), W, Inches(0.06), GOLD)
add_rect(slide, Inches(9.8), 0, Inches(3.533), H, RGBColor(0x0F, 0x24, 0x48))
header_bar(slide, "Summary & Key Take-Home Messages", bar_color=DARK_BLUE)

key_points = [
    "1.  DR is the leading cause of blindness in working-age adults in industrialised nations — prevention is possible",
    "2.  Duration of DM + poor glycaemic control (HbA1c) are the most important modifiable risk factors",
    "3.  Pathogenesis: pericyte loss → BRB breakdown → ischaemia → VEGF → neovascularisation",
    "4.  ETDRS classification (No DR → Mild/Moderate/Severe NPDR → PDR) guides management",
    "5.  Severe NPDR: 4-2-1 rule — identifies imminent risk of PDR",
    "6.  CSME / DME affecting the fovea = indication for treatment (anti-VEGF first-line)",
    "7.  High-risk PDR = urgent PRP; anti-VEGF alone requires strict follow-up",
    "8.  OCT is gold standard for DME; FFA maps ischaemia and guides laser",
    "9.  Vitrectomy for non-clearing VH, traction RD, ERM/VMT, refractory DME",
    "10. Screening: T1DM — 5 years post-diagnosis; T2DM — at diagnosis, then annually",
    "11. With screening + ETDRS/anti-VEGF guidelines, risk of severe visual loss <5%",
]

add_multiline(slide, key_points,
              Inches(0.5), Inches(1.35), Inches(9.1), Inches(5.9),
              size=15, color=WHITE, bold_first=False, font="Calibri")

# References box
refs = [
    "References:",
    "• Kanski JJ, Bowling B. Kanski's Clinical Ophthalmology: A Systematic Approach. 10th ed. Elsevier; 2024",
    "• Tasman W, Jaeger E. Wills Eye Manual: Office and Emergency Room Diagnosis and Treatment. 8th ed. Lippincott; 2022",
    "• Kasper DL, et al. Harrison's Principles of Internal Medicine. 22nd ed. McGraw-Hill; 2025",
    "• DRS Research Group. Ophthalmology 1981. | ETDRS Research Group. Ophthalmology 1991."
]
add_multiline(slide, refs,
              Inches(0.5), Inches(6.75), Inches(9.0), Inches(0.85),
              size=10, color=RGBColor(0x88, 0xAA, 0xCC), font="Calibri")

# ─── SAVE ────────────────────────────────────────────────────────────────────
buf = BytesIO()
prs.save(buf)
with open("/tmp/workspace/diabetic-retinopathy-ppt/Diabetic_Retinopathy_Ophtha_Residency.pptx", "wb") as f:
    f.write(buf.getvalue())

print("DONE: Presentation saved.")
print("Slides created:", len(prs.slides))
cd /tmp/workspace/diabetic-retinopathy-ppt && python build_ppt.py 2>&1
cd /tmp/workspace/diabetic-retinopathy-ppt && python -c " import urllib.request, base64, json from io import BytesIO urls = [ 'https://cdn.orris.care/cdss_images/b7574867ea2a174b6b0040fe02ecf20e15dc9349c662d45e4fa91ab05d329a2b.png', 'https://cdn.orris.care/cdss_images/pmc_clinical_VQA_99a513f47577e524a524d6c1b0fe1257c446bf589fc687875cb9ed976d3d4bc1.jpg', 'https://cdn.orris.care/cdss_images/pmc_clinical_VQA_eb37d49f93f4afe771180335d27436389dd6036c1b8cc8cc964ce2ec45f7af30.jpg', 'https://cdn.orris.care/cdss_images/pmc_clinical_VQA_c1ca072bde876cafe7678c07b919bc13ddd40a8cff7deae6fd00ff3bc04ae061.jpg', 'https://cdn.orris.care/cdss_images/pmc_clinical_VQA_575b568fb24d2daee84389ce23c2c8880f248ce817e301897c0098fc5591c5e4.jpg', 'https://cdn.orris.care/cdss_images/42215cc0b55233f3cbc064f6f54c8ad8cba0dc74c215bc2998ce2906e6e5237b.png', ] for url in urls: try: req = urllib.request.Request(url, headers={'User-Agent': 'Mozilla/5.0'}) with urllib.request.urlopen(req, timeout=15) as r: data = r.read() print(f'OK {len(data)} bytes: {url[-50:]}') except Exception as e: print(f'FAIL: {e}: {url[-50:]}') "
~/diabetic-retinopathy-ppt/build_ppt.py
Successfully replaced 1 instance(s) of the string in '/tmp/workspace/diabetic-retinopathy-ppt/build_ppt.py'
cd /tmp/workspace/diabetic-retinopathy-ppt && python build_ppt.py 2>&1
Diabetic Retinopathy Ophtha Residency
Presentation · PPTX
What's inside — 14 slides
| # | Slide | Key Textbook Source |
|---|---|---|
| 1 | Title Slide | — |
| 2 | Overview & Epidemiology | Kanski's p.506, Harrison's 22nd |
| 3 | Risk Factors | Kanski's p.507 (DCCT, UKPDS data) |
| 4 | Pathogenesis | Kanski's p.507 — pericyte loss → BRB breakdown → VEGF cascade (with histology image) |
| 5 | Classification (ETDRS) | Kanski's Table 13.1 + Wills Eye Manual DR Severity Scale p.811 — colour-coded stage cards |
| 6 | NPDR Signs | Kanski's p.508-515 — MA, haemorrhages, HE, CWS, venous beading, IRMA |
| 7 | PDR & Advanced Disease | Kanski's p.508-521 + DRS high-risk criteria |
| 8 | Diabetic Maculopathy | Kanski's p.508, Wills p.811 — focal/diffuse/CSME/ischaemia + OCT biomarkers |
| 9 | Investigations | Wills p.811-813 — FFA, OCT, OCT-A, B-scan, systemic workup |
| 10 | Treatment: DME | Kanski's p.515, Wills p.813 — anti-VEGF, focal laser, steroids, vitrectomy |
| 11 | Treatment: PDR | Kanski's p.515-521, Wills p.814-815 — PRP (DRS), anti-VEGF (Protocol S), vitrectomy indications |
| 12 | Screening & Follow-up Table | Kanski's p.534, Wills p.815 — full interval schedule incl. pregnancy |
| 13 | Clinical Images | Fundus MAs, ETDRS HE grading, PDR with VH, OCT DME, Harrison's PDR fundus photo |
| 14 | Summary & References | 11 key take-home points + formal references |
Ophthalmodynamometer
ophthalmodynamometer optic disc retinal artery pressure measurement
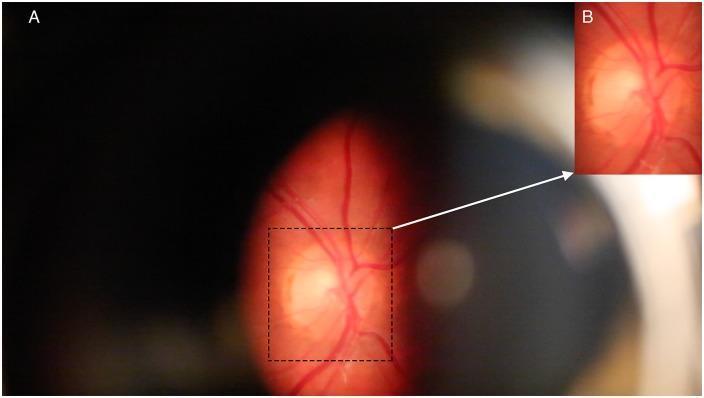
This clinical photograph displays a fundus view of a human retina obtained via an imaging slit-lamp and digital camera. Panel A presents a full-frame view as observed through a Meditron ophthalmodynamometer, showing the optic disc as a bright, pale, yellowish-white structure. Retinal arteries and veins emerge from the disc, branching across a mottled orange-red background. The image contains peripheral artifacts, including a large dark region on the left and slight blurring. Panel B is a magnified inset of the region of interest defined by a dashed box in Panel A. This cropped view provides higher detail of the optic disc and the distribution of proximal retinal vasculature. The educational focus of this image is the visualization of the optic nerve head and the associated vascular network for the analysis of retinal vascular pulsations and hemodynamic changes under induced intraocular pressure. Key anatomical features include the optic disc, retinal arteries, and retinal veins, which are essential for studies in ophthalmology and neuro-ophthalmology.
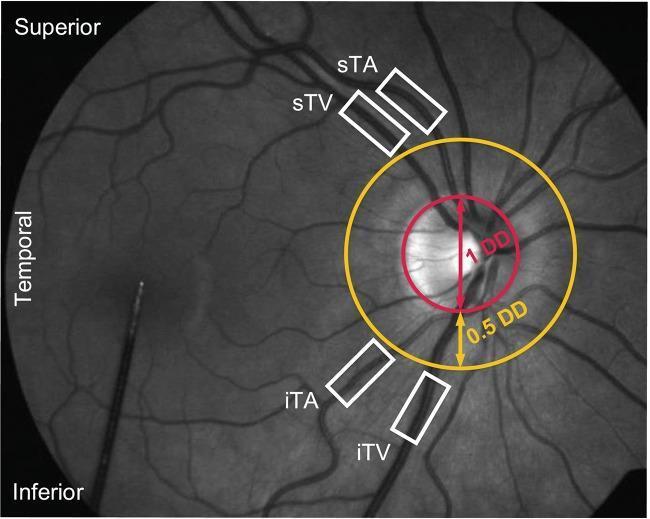
This monochrome fundus photograph depicts the retinal anatomy of a healthy subject during Dynamic Vessel Analysis (DVA). The optic disc is centrally located on the right side of the frame, with two concentric colored circles overlaid to define measurement boundaries: a red circle indicating 1 optic disc diameter (DD) and a gold circle marking a 0.5 DD distance from the disc margin. Four primary retinal vessel segments are highlighted with white rectangular boxes for vessel diameter measurement: the superior temporal artery (sTA) and vein (sTV) in the upper temporal quadrant, and the inferior temporal artery (iTA) and vein (iTV) in the lower temporal quadrant. The labels 'Superior', 'Inferior', and 'Temporal' provide cardinal orientation. The image demonstrates the typical branching morphology of the retinal vasculature, with veins appearing slightly wider and darker than their corresponding arteries. This visual illustrates the protocol for selecting vessel segments at least 0.5 DD from the optic disc to ensure accurate assessment of retinal microvascular reactivity and hemodynamic responses.
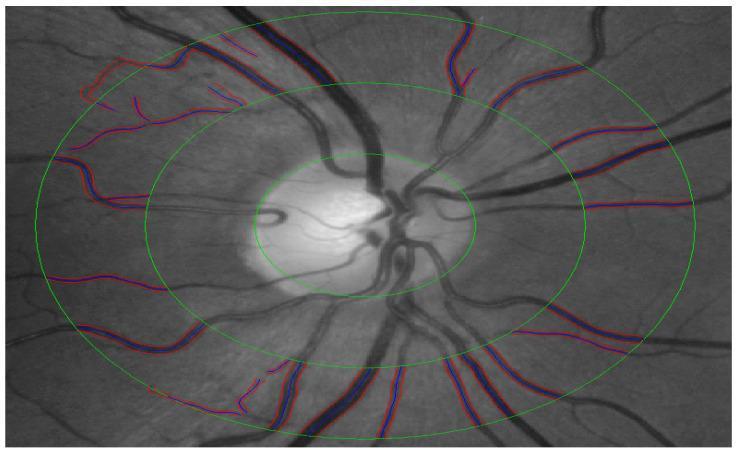
This monochromatic fundus photograph captures the optic nerve head (ONH) and surrounding retinal vasculature, specifically demonstrating the semi-automated grading of retinal vessels. The optic disc is centrally positioned, appearing as a bright, circular structure from which retinal arteries and veins emerge and branch into the periphery. Overlaid on the image are three concentric green rings centered on the ONH, spaced at intervals of 0.5 and 1.0 disc diameters (DD) from the disc margin. These rings define the standardized zones for measuring the Central Retinal Artery Equivalent (CRAE) and Central Retinal Vein Equivalent (CRVE). Within the outer measurement zone, specific vascular segments are traced with blue and red colored lines, indicating the software-assisted identification and measurement of arteries and veins. This visual tool is essential for assessing the Arteriole-to-Venule Ratio (AVR), a key clinical marker in evaluating systemic cardiovascular health, hypertensive retinopathy, and microvascular changes associated with metabolic diseases.
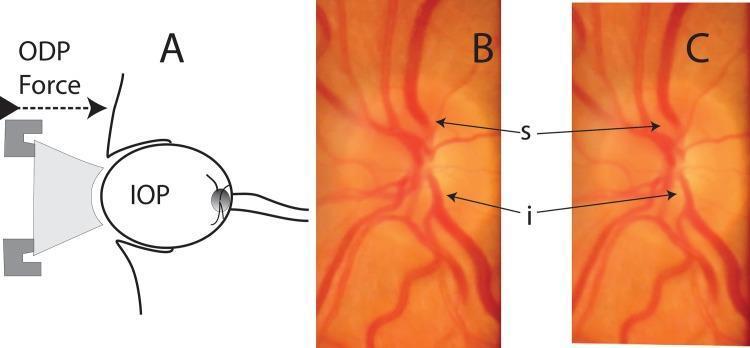
This composite educational graphic illustrates the principles and clinical observation of ophthalmodynamometry. Panel A is a schematic diagram showing an ophthalmodynamometer applying external force (ODP) to the globe, which interacts with the baseline intraocular pressure (IOP) to determine venous pulsation pressure. Panels B and C are high-magnification clinical photographs of the optic disc and peripapillary retina, specifically highlighting the superior (s) and inferior (i) hemi-veins. Panel B demonstrates the dilation phase of retinal venous pulsation, where the vessels appear wider and more engorged. Panel C demonstrates the collapse phase of the same pulsation cycle, showing the hemi-veins in a narrower, constricted state. This visual comparison is used to teach the identification of spontaneous or induced venous pulsation, a critical clinical marker in the assessment of intracranial pressure and glaucoma. The set serves as a guide for ophthalmology residents to understand how external pressure influences retinal vascular dynamics and how to visually distinguish between the peak and trough of the venous pulse.
ophthalmodynamometer types uses technique Bailliart Riva-Rocci ophthalmology
https://eyewiki.org/Ocular_Ischemic_Syndrome
Ophthalmodynamometer
Definition
Principle of Operation
- Diastolic reading = force (grams) at which arterial pulsation first appears
- Systolic reading = force (grams) at which arterial pulsation ceases entirely
Types of Ophthalmodynamometers
| Type | Description |
|---|---|
| Bailliart's ODM | Oldest, most widely known. A spring-loaded plunger pressed against the sclera; calibrated in grams of force |
| Suction cup ODM (Meditron / Servo-Med) | Applies negative pressure (suction) to reduce IOP rather than raise it; reduces CRA pressure by drawing blood toward the eye |
| Digital ODM | Simplest form — gentle finger pressure on the globe while observing the disc; qualitative only |
| Contact lens ODM | Combined with a fundus contact lens for slit-lamp use |
Technique (Bailliart's ODM)
- Seat the patient at the slit lamp or have them recline.
- Instil topical anaesthetic drops.
- Dilate the pupil for adequate disc visualisation.
- The examiner holds a direct ophthalmoscope in one hand and the ODM in the other.
- The ODM foot plate is placed on the temporal sclera (or through a contact lens on the cornea in newer designs).
- Pressure is gradually increased while observing the retinal arteries on the optic disc.
- First endpoint (diastolic) - note the gauge reading when arterial pulsations first appear.
- Second endpoint (systolic) - note the reading when the artery collapses completely (flow ceases).
- The procedure is repeated on the fellow eye for comparison.
- Convert gauge reading to mmHg using a conversion table (Bailliart's calibration: 1 gram force ~ approximately corresponds to a specific mmHg equivalent via nomogram).
Normal Values
| Parameter | Normal |
|---|---|
| Diastolic OA pressure | ~35-40 mmHg |
| Systolic OA pressure | ~60-80 mmHg |
| Ratio (ophthalmic artery pressure / brachial systolic BP) | > 0.66 (>66%) is normal |
| Inter-eye difference (diastolic) | < 20% difference |
Clinical Uses
- General hypertension assessment
- Intracranial hypertension (raised ICP raises venous pulsation threshold)
- Toxaemia of pregnancy
- Simple glaucoma
Interpretation Summary
| Finding | Implication |
|---|---|
| Low diastolic ODM reading (pulsations appear easily) | Reduced CRA perfusion pressure → suspect carotid stenosis / OIS |
| Asymmetric readings (>20% difference between eyes) | Significant ipsilateral carotid artery stenosis |
| Normal ODM in suspected CRVO | Supports venous rather than arterial/carotid aetiology |
| Improvement post-carotid endarterectomy | Confirms haemodynamic cause; good prognostic sign |
Limitations & Current Status
- Low sensitivity and specificity compared to modern vascular imaging (Duplex Doppler, MRA, CTA).
- Risk of globe trauma if excessive pressure applied; corneal abrasion; vitreous haemorrhage (rare).
- Requires a cooperative, dilated patient and experienced examiner.
- Largely replaced in clinical practice by carotid Duplex ultrasound, Color Doppler imaging of the ophthalmic artery, and OCT-Angiography.
- Still taught as a concept for understanding CRA/OA perfusion physiology and for the bedside "digital ODM" sign in OIS.
Defination of staphyloma