
Explain me about the recent pulmonary embolism classification according to the recent guidelines, according to AHA.
AHA pulmonary embolism classification guidelines 2023 2024 massive submassive low-risk
"pulmonary embolism" AND "classification" AND "guidelines"
https://litfl.com/goodbye-massive-and-submassive
PMID: 41712677
https://journalfeed.org/article-a-day/2026/new-pe-guidelines…
pulmonary embolism classification severity categories risk stratification diagram
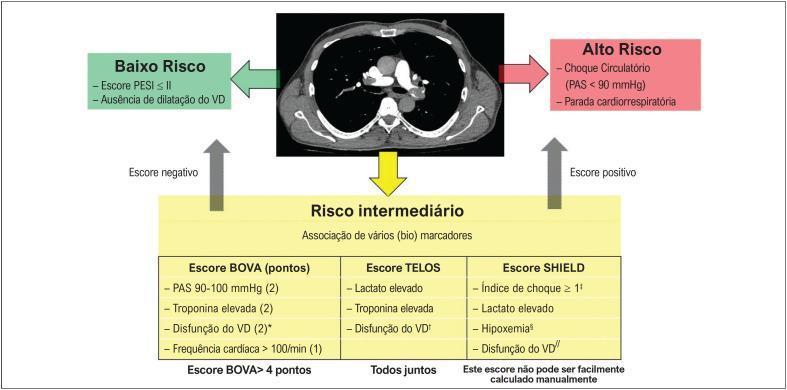
A medical infographic and diagnostic algorithm in Portuguese for risk stratification of acute pulmonary embolism (APE). At the center is a diagnostic image: a transverse/axial CT pulmonary angiogram (CTPA) showing the mediastinum and major hilar vessels, including the pulmonary artery and heart chambers. The algorithm branches into three risk categories: 'Baixo Risco' (Low Risk), defined by a PESI score ≤ II and absence of right ventricular (RV) dilation; 'Alto Risco' (High Risk), characterized by circulatory shock (SBP < 90 mmHg) or cardiorespiratory arrest; and 'Risco intermediário' (Intermediate Risk). The intermediate section details an association of biomarkers across three scoring systems: the BOVA score (incorporating SBP, troponin, RV dysfunction, and heart rate), the TELOS score (lactate, troponin, and RV dysfunction), and the SHIELD score (shock index, lactate, hypoxemia, and RV dysfunction). Arrows indicate the clinical flow based on positive or negative scores, integrating clinical vitals, imaging findings of RV strain, and laboratory markers for triage and management.
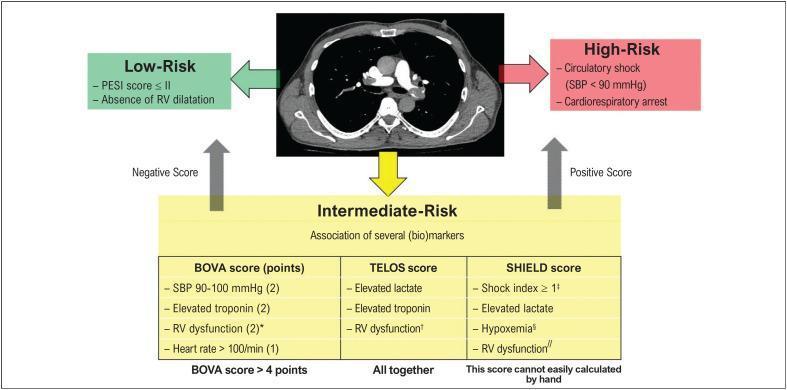
This composite educational graphic combines diagnostic imaging and a clinical decision-making algorithm for the risk stratification of acute pulmonary embolism (PE). At the center is an axial view of a Contrast-Enhanced Computed Tomography (CT) scan of the chest, specifically a CT pulmonary angiogram (CTPA). The image displays the thoracic cage, lungs, mediastinum, and cardiac structures, notably demonstrating filling defects in the pulmonary arteries consistent with PE. The surrounding flowchart categorizes PE severity into three tiers: Low-Risk, Intermediate-Risk, and High-Risk. Low-Risk is defined by a Pulmonary Embolism Severity Index (PESI) score ≤ II and absence of Right Ventricular (RV) dilatation. High-Risk is identified by hemodynamic instability (circulatory shock, SBP < 90 mmHg, or cardiorespiratory arrest). The Intermediate-Risk section utilizes integrated biomarkers and scoring systems, including the BOVA score (focusing on SBP, troponin, RV dysfunction, and heart rate), the TELOS score (lactate, troponin, and RV dysfunction), and the SHIELD score (shock index, lactate, hypoxemia, and RV dysfunction). This educational visual illustrates how imaging findings of RV strain and clinical scores guide patient prognosis and triage.
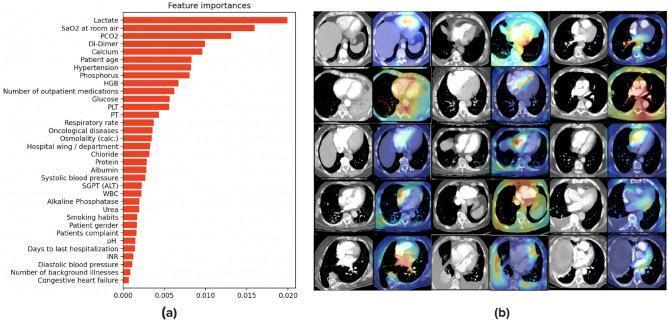
This composite educational graphic illustrates the interpretability of a multimodal machine learning model for pulmonary embolism (PE) risk stratification. (a) A horizontal bar chart displays 'Feature Importances' from Electronic Health Record (EHR) data. Key clinical features contributing to model prediction include lactate levels, SaO2 at room air, PCO2, D-Dimer, calcium, patient age, and hypertension. (b) A 5x6 grid presents diagnostic interpretability through Grad-CAM visualizations. It pairs axial 2D slices from 3D Computed Tomography Pulmonary Angiograms (CTPA) with corresponding heatmaps. These heatmaps utilize a color gradient (red/yellow/green indicating high activation) to highlight anatomical regions prioritized by the model for classification. Predominant activation occurs within cardiothoracic structures, including the pulmonary trunk, right and left ventricles, aorta, inferior vena cava, and general heart area. This demonstrates the model's focus on physiologically relevant hemodynamic and vascular markers for determining PE severity and associated 30-day mortality risk.
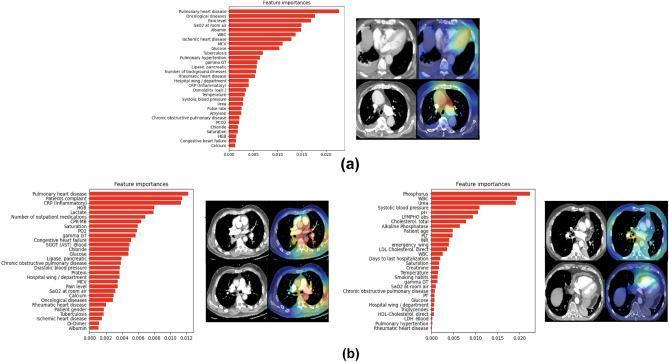
This infographic presents misclassified examples from a multimodal classifier designed for Pulmonary Embolism (PE) risk stratification, comparing Electronic Health Record (EHR) features and 3D CT Pulmonary Angiography (CTPA) imaging. (a) Displays a false negative case featuring a bar chart of EHR feature importance (e.g., Pulmonary heart disease, Patients Complaint, CRP) and corresponding 3D Grad-CAM heatmaps overlaying the left ventricle and pulmonary artery. (b) Shows two false positive examples with their respective feature importance rankings (including Phosphorus, WBC, and Urea) and Grad-CAM visualizations. The heatmaps in these cases highlight the pulmonary trunk, aorta, right ventricle chamber, and areas indicating potential PE clots. This visual provides an educational comparison of how deep learning models utilize diverse data modalities to assess acute PE severity, illustrating anatomical regions of high diagnostic importance such as the heart chambers and major thoracic vessels. It serves as a study of model interpretability and the clinical relevance of multimodal diagnostic fusion.
Pulmonary Embolism Classification - 2026 AHA/ACC Guideline
Background: Why the Old Classification Was Retired
The New System: AHA/ACC Acute PE Clinical Categories (A through E)
CATEGORY A - Subclinical (Incidental) PE
| Feature | Detail |
|---|---|
| Definition | PE found incidentally on imaging done for another reason, without attributable symptoms |
| Hemodynamics | Stable |
| Severity scores | Not applicable |
| RV function | Normal |
| Biomarkers | Normal |
| Mortality risk | < 1% |
| Disposition | Discharge from ED; outpatient management reasonable |
CATEGORY B - Low-Severity Symptomatic PE
| Feature | Detail |
|---|---|
| Definition | Symptomatic PE with low clinical severity score |
| Severity scores | PESI class I-II, sPESI = 0, Hestia = 0 |
| RV function | Normal or mildly impaired |
| Biomarkers | Normal or mildly elevated |
| Mortality risk | < 1-2% |
| Disposition | Early discharge generally recommended |
CATEGORY C - Intermediate-Severity Symptomatic PE
| Feature | Detail |
|---|---|
| Definition | Symptomatic with elevated clinical severity score |
| Severity scores | PESI class III-V, sPESI ≥ 1, Hestia ≥ 1 |
| Hemodynamics | Normotensive (no shock) |
| Subcategory | RV Dysfunction? | Biomarkers (Troponin/BNP)? | Implication |
|---|---|---|---|
| C1 | Absent | Normal | Elevated score only; lowest risk within C |
| C2 | Present | Elevated | RV strain; higher risk of deterioration |
| C3 | Present | Elevated + BOVA score high or NEWS-2 elevated | Highest-risk normotensive group; pre-failure state approaching D |
- C1-C2: Systemic thrombolysis and catheter-based therapies are Class 3 (Harm)
- C3: Role of systemic thrombolysis and catheter-based therapies is "unclear" - the PEITHO trial showed thrombolysis prevented cardiovascular collapse but at the cost of more bleeding including intracranial hemorrhage. PERT activation is Class 1
CATEGORY D - Incipient Cardiopulmonary Failure
| Feature | Detail |
|---|---|
| Definition | Normotensive shock or pre-failure state |
| Key finding | Rising lactate, rising creatinine, evidence of end-organ hypoperfusion despite preserved blood pressure |
| Hemodynamics | Borderline - may have relative hypotension or tachycardia without meeting shock criteria |
| Mortality risk | Very high |
- D1: Incipient failure - pre-shock physiology, clinical deterioration trend
- D2: More overt early failure with organ dysfunction markers
CATEGORY E - Established Cardiopulmonary Failure
| Feature | Detail |
|---|---|
| Definition | Overt shock or cardiac arrest |
| Mortality risk | > 40% |
| Subcategory | Description |
|---|---|
| E1 | Persistent hypotension + vasopressor requirement + RV failure (cardiogenic/obstructive shock) |
| E2 | Refractory shock despite therapy, or cardiac arrest |
- E1: Advanced therapies are "reasonable" (Class 2a) - systemic thrombolysis, CDL, MT, or surgical embolectomy
- E2: Systemic thrombolysis is reasonable; VA-ECMO may be needed; surgical embolectomy is not recommended over other options
Summary Table
| Category | Old Equivalent | Hemodynamics | RV/Biomarkers | Mortality | Advanced Therapy |
|---|---|---|---|---|---|
| A | Low-risk (incidental) | Stable | Normal | < 1% | Class 3 Harm |
| B | Low-risk | Stable | Normal/mild | < 2% | Class 3 Harm |
| C1-C2 | Submassive (lower) | Normotensive | ± elevated | Low-mod | Class 3 Harm |
| C3 | Submassive (higher) | Normotensive | Elevated+BOVA | Moderate | Unclear |
| D | Submassive (extreme) | Pre-shock | Elevated | High | May consider |
| E1 | Massive | Shock | RV failure | > 40% | Reasonable |
| E2 | Massive + arrest | Refractory shock/arrest | Critical | > 40% | Reasonable + ECMO |
Key Ancillary Changes in the 2026 Guideline
- PERT (PE Response Teams) - Upgraded to Class 1, Level B-NR for Categories C-E. This is a major elevation from prior guidance.
- DOACs over warfarin - Class 1, Level B-R recommendation for eligible patients.
- LMWH over UFH - Class 1, Level B-R for parenteral anticoagulation.
- Lactate measurement - Now Class 1 for all C-E patients. A rising lactate in a normotensive patient may push a patient from C3 to Category D.
- Echocardiography - Preferred over CT-RHC for RV assessment in C-D patients. Should NOT be used to rule out PE (COR 3, No Benefit).
- Scoring tools for disposition: PESI, sPESI, and Hestia criteria guide discharge in B-C patients. The BOVA score is used to predict deterioration (not discharge).
Historical Context
| Year | Source | Classification |
|---|---|---|
| 2011 | AHA Scientific Statement | Massive / Submassive / Low-risk |
| 2019 | ESC Guidelines | High / Intermediate-high / Intermediate-low / Low |
| 2026 | AHA/ACC Guideline (first ever) | Categories A - E with subcategories |
Note: An erratum was issued (PMID: 42441758) - check the current publication for any minor corrections.