
Pulmonary function test
Reading File
Searching sources...
Finding Sources
Finding Sources
Reading File
Reading File
Reading File
Reading File
Reading File
Reading File
Reading File
Reading File
Reading File
Now let me fetch the key interpretive flow diagram and lung volumes diagram:
Loading Image
Finding Sources
Finding Sources
Reading File
Loading Image
Reading File
Loading Image
Finding Sources
I now have comprehensive material from authoritative textbooks to compose a detailed answer. Let me compile everything.
Pulmonary Function Tests (PFTs)
PFTs are a battery of non-invasive tests that measure how well the lungs move air and transfer gases. They do not diagnose specific diseases but reveal patterns of abnormality that allow quantification of severity, early detection, and monitoring of treatment response.
1. Definition and Purpose
"Pulmonary function tests (PFTs) permit accurate, reproducible assessment of the functional state of the respiratory system. PFTs do not diagnose specific diseases. Different diseases cause different patterns of abnormalities in a battery of PFTs."
- Murray & Nadel's Textbook of Respiratory Medicine
The clinical goals are to:
- Quantify the severity of respiratory disease
- Detect disease early (e.g., subclinical COPD)
- Characterize natural history and response to treatment
- Assess operative risk and fitness for procedures (e.g., lung resection)
2. Lung Volumes and Capacities
These are the foundational parameters all PFTs measure:
| Volume/Capacity | Definition | Measured by |
|---|---|---|
| Tidal Volume (TV) | Air in/out with normal breathing | Spirometer |
| Inspiratory Reserve Volume (IRV) | Extra air inhaled above TV | Spirometer |
| Expiratory Reserve Volume (ERV) | Extra air exhaled below TV | Spirometer |
| Residual Volume (RV) | Air remaining after maximal exhalation | Plethysmography/dilution |
| Functional Residual Capacity (FRC) | ERV + RV | Plethysmography/dilution |
| Inspiratory Capacity (IC) | TV + IRV | Spirometer |
| Vital Capacity (VC) | TV + IRV + ERV | Spirometer |
| Total Lung Capacity (TLC) | VC + RV | Plethysmography/dilution |
- Three volumes (TV, IRV, ERV) can be measured with a simple spirometer.
- RV and any capacity containing it (FRC, TLC) require body plethysmography, inert gas dilution, or nitrogen washout.
3. Categories of PFTs
A. Spirometry
- The most useful, cost-effective, and commonly performed PFT.
- Measures volume of air inhaled/exhaled using a pneumotachometer.
- Key parameters:
- FVC (Forced Vital Capacity): total air forcefully exhaled
- FEV1 (Forced Expiratory Volume in 1 second): air expelled in the first second
- FEV1/FVC ratio: distinguishes obstruction from restriction
- PEF (Peak Expiratory Flow): max flow rate during forced exhalation
- FEF 25-75%: mid-expiratory flow (reflects small airway disease)
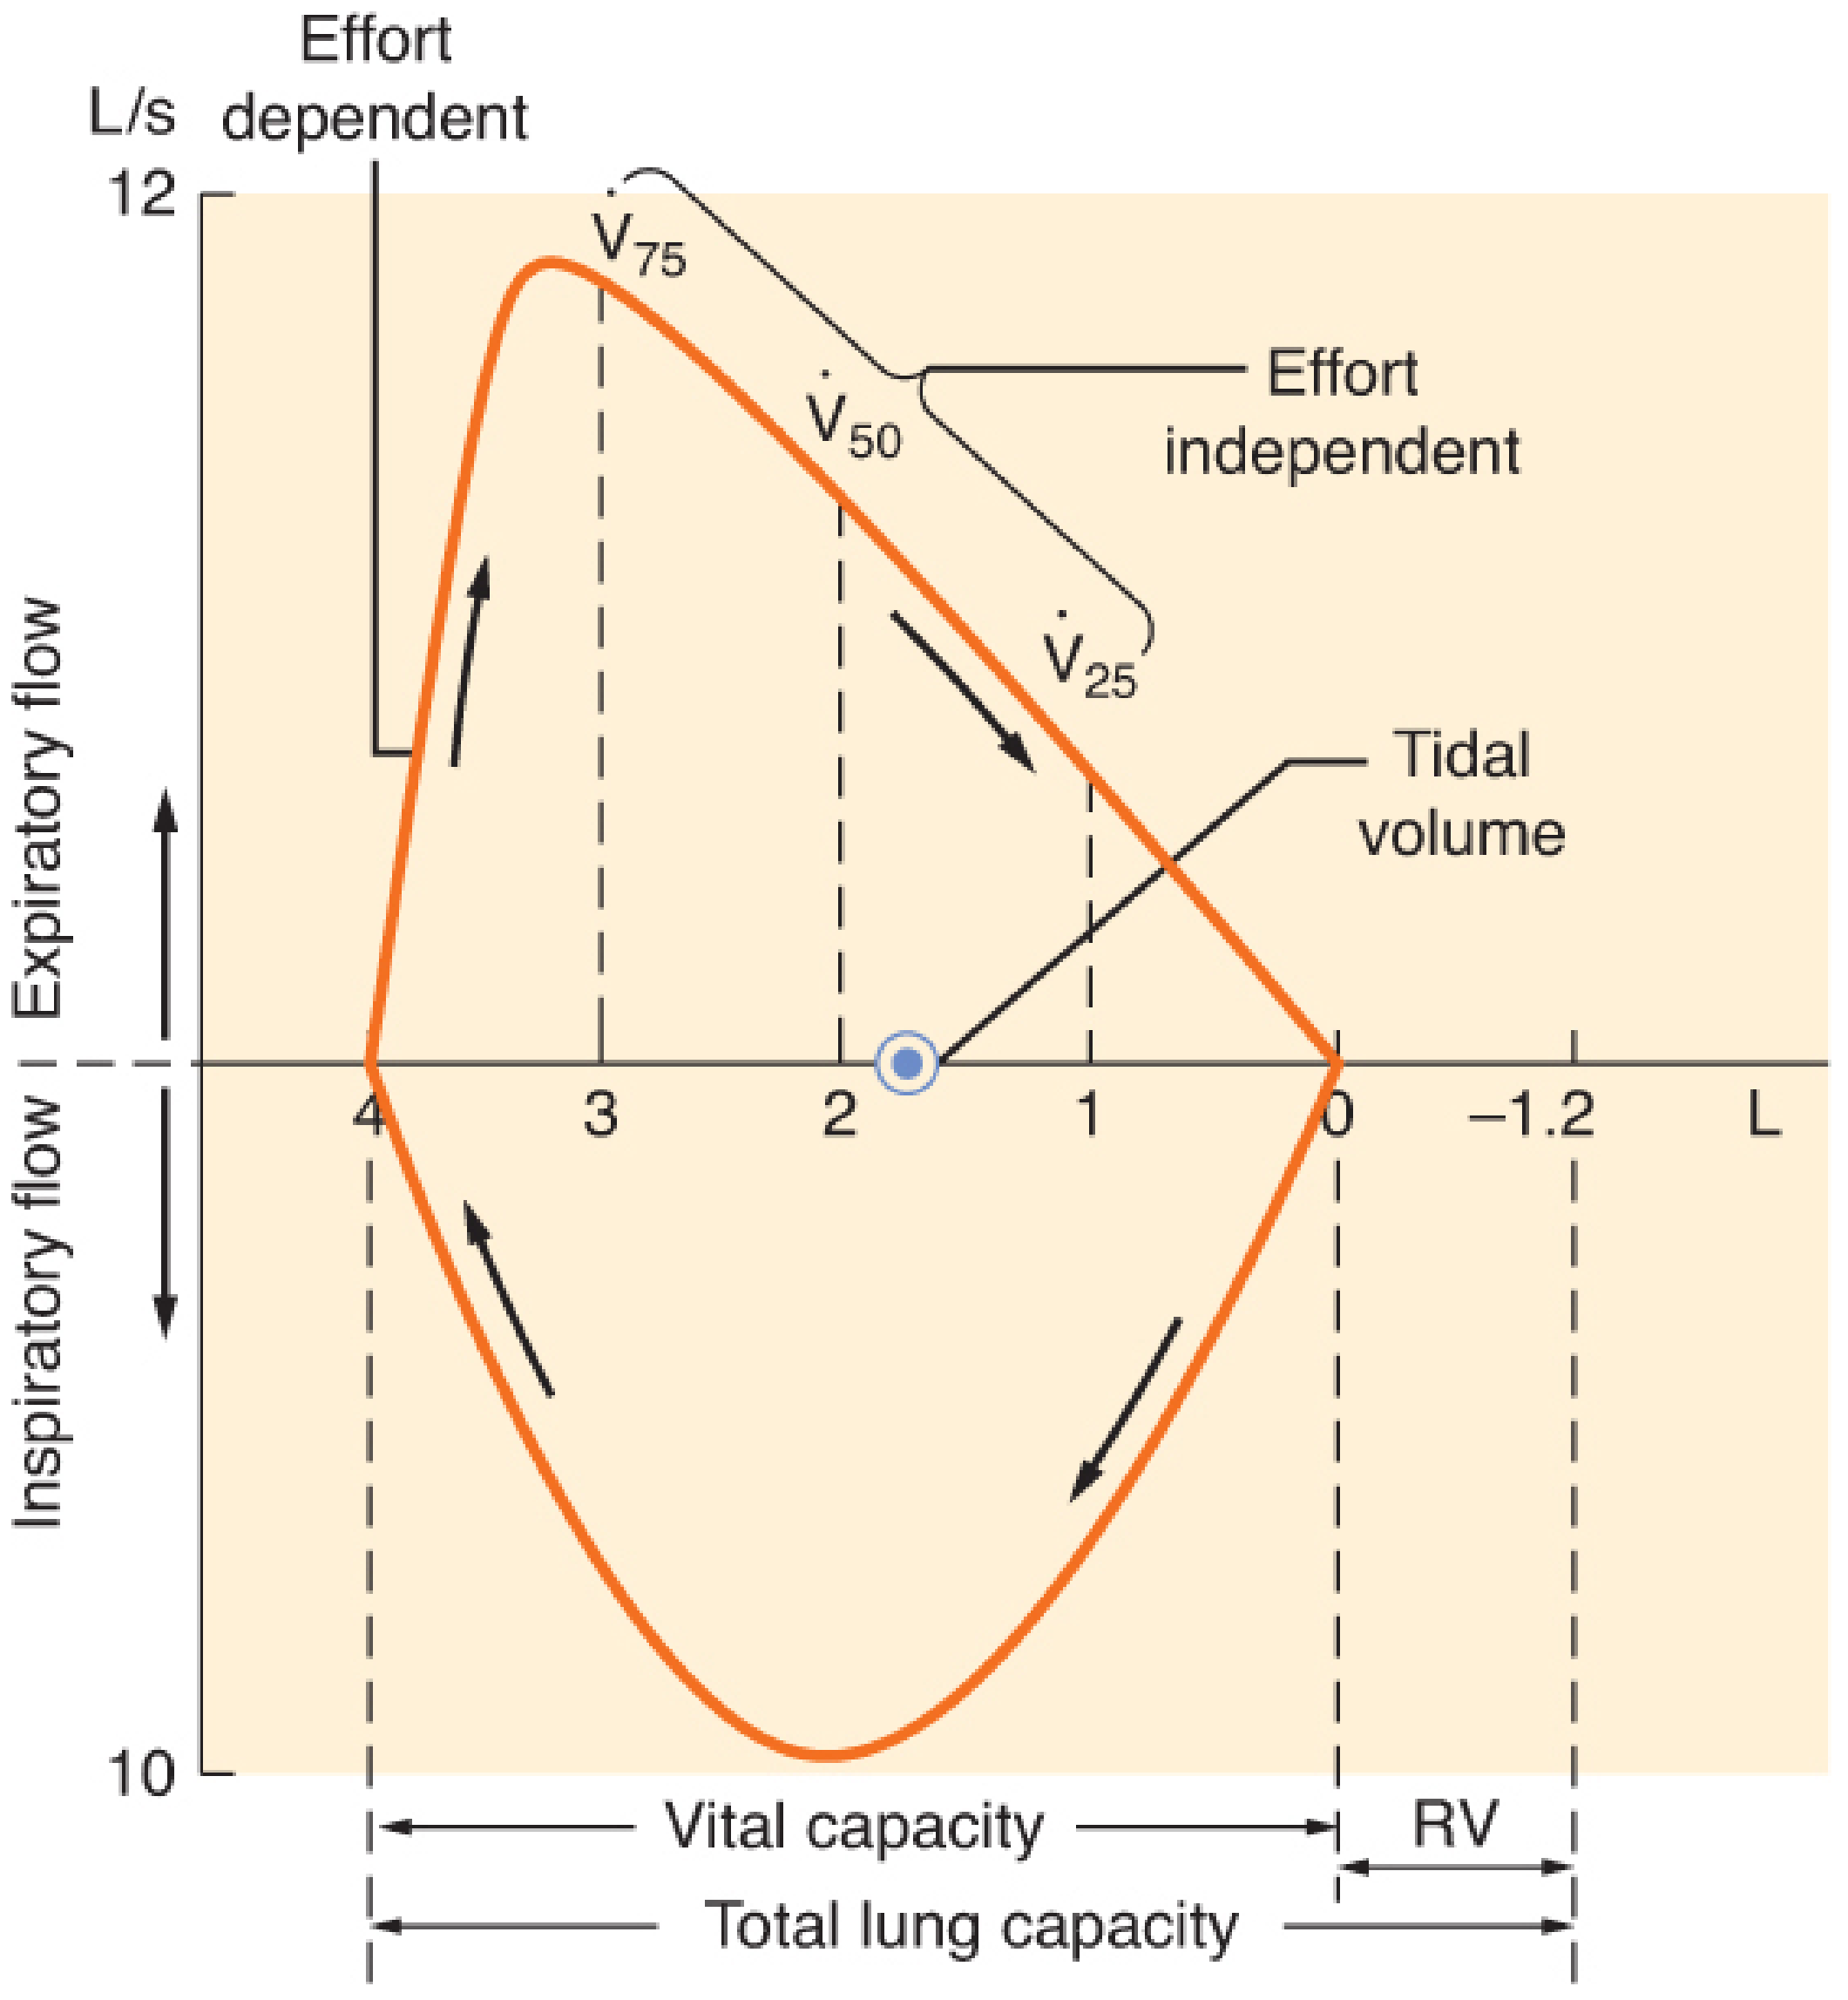
- Effort dependent: the first 25-30% of maximal expiration requires patient cooperation and well-trained technicians.
B. Lung Volume Measurement
- Body plethysmography (preferred): uses Boyle's law (P1V1 = P2V2) in a sealed box
- Helium dilution / Nitrogen washout: dilution techniques for measuring FRC and TLC
C. Diffusing Capacity (DLCO / TLCO)
- Measures gas transfer across the alveolar-capillary membrane.
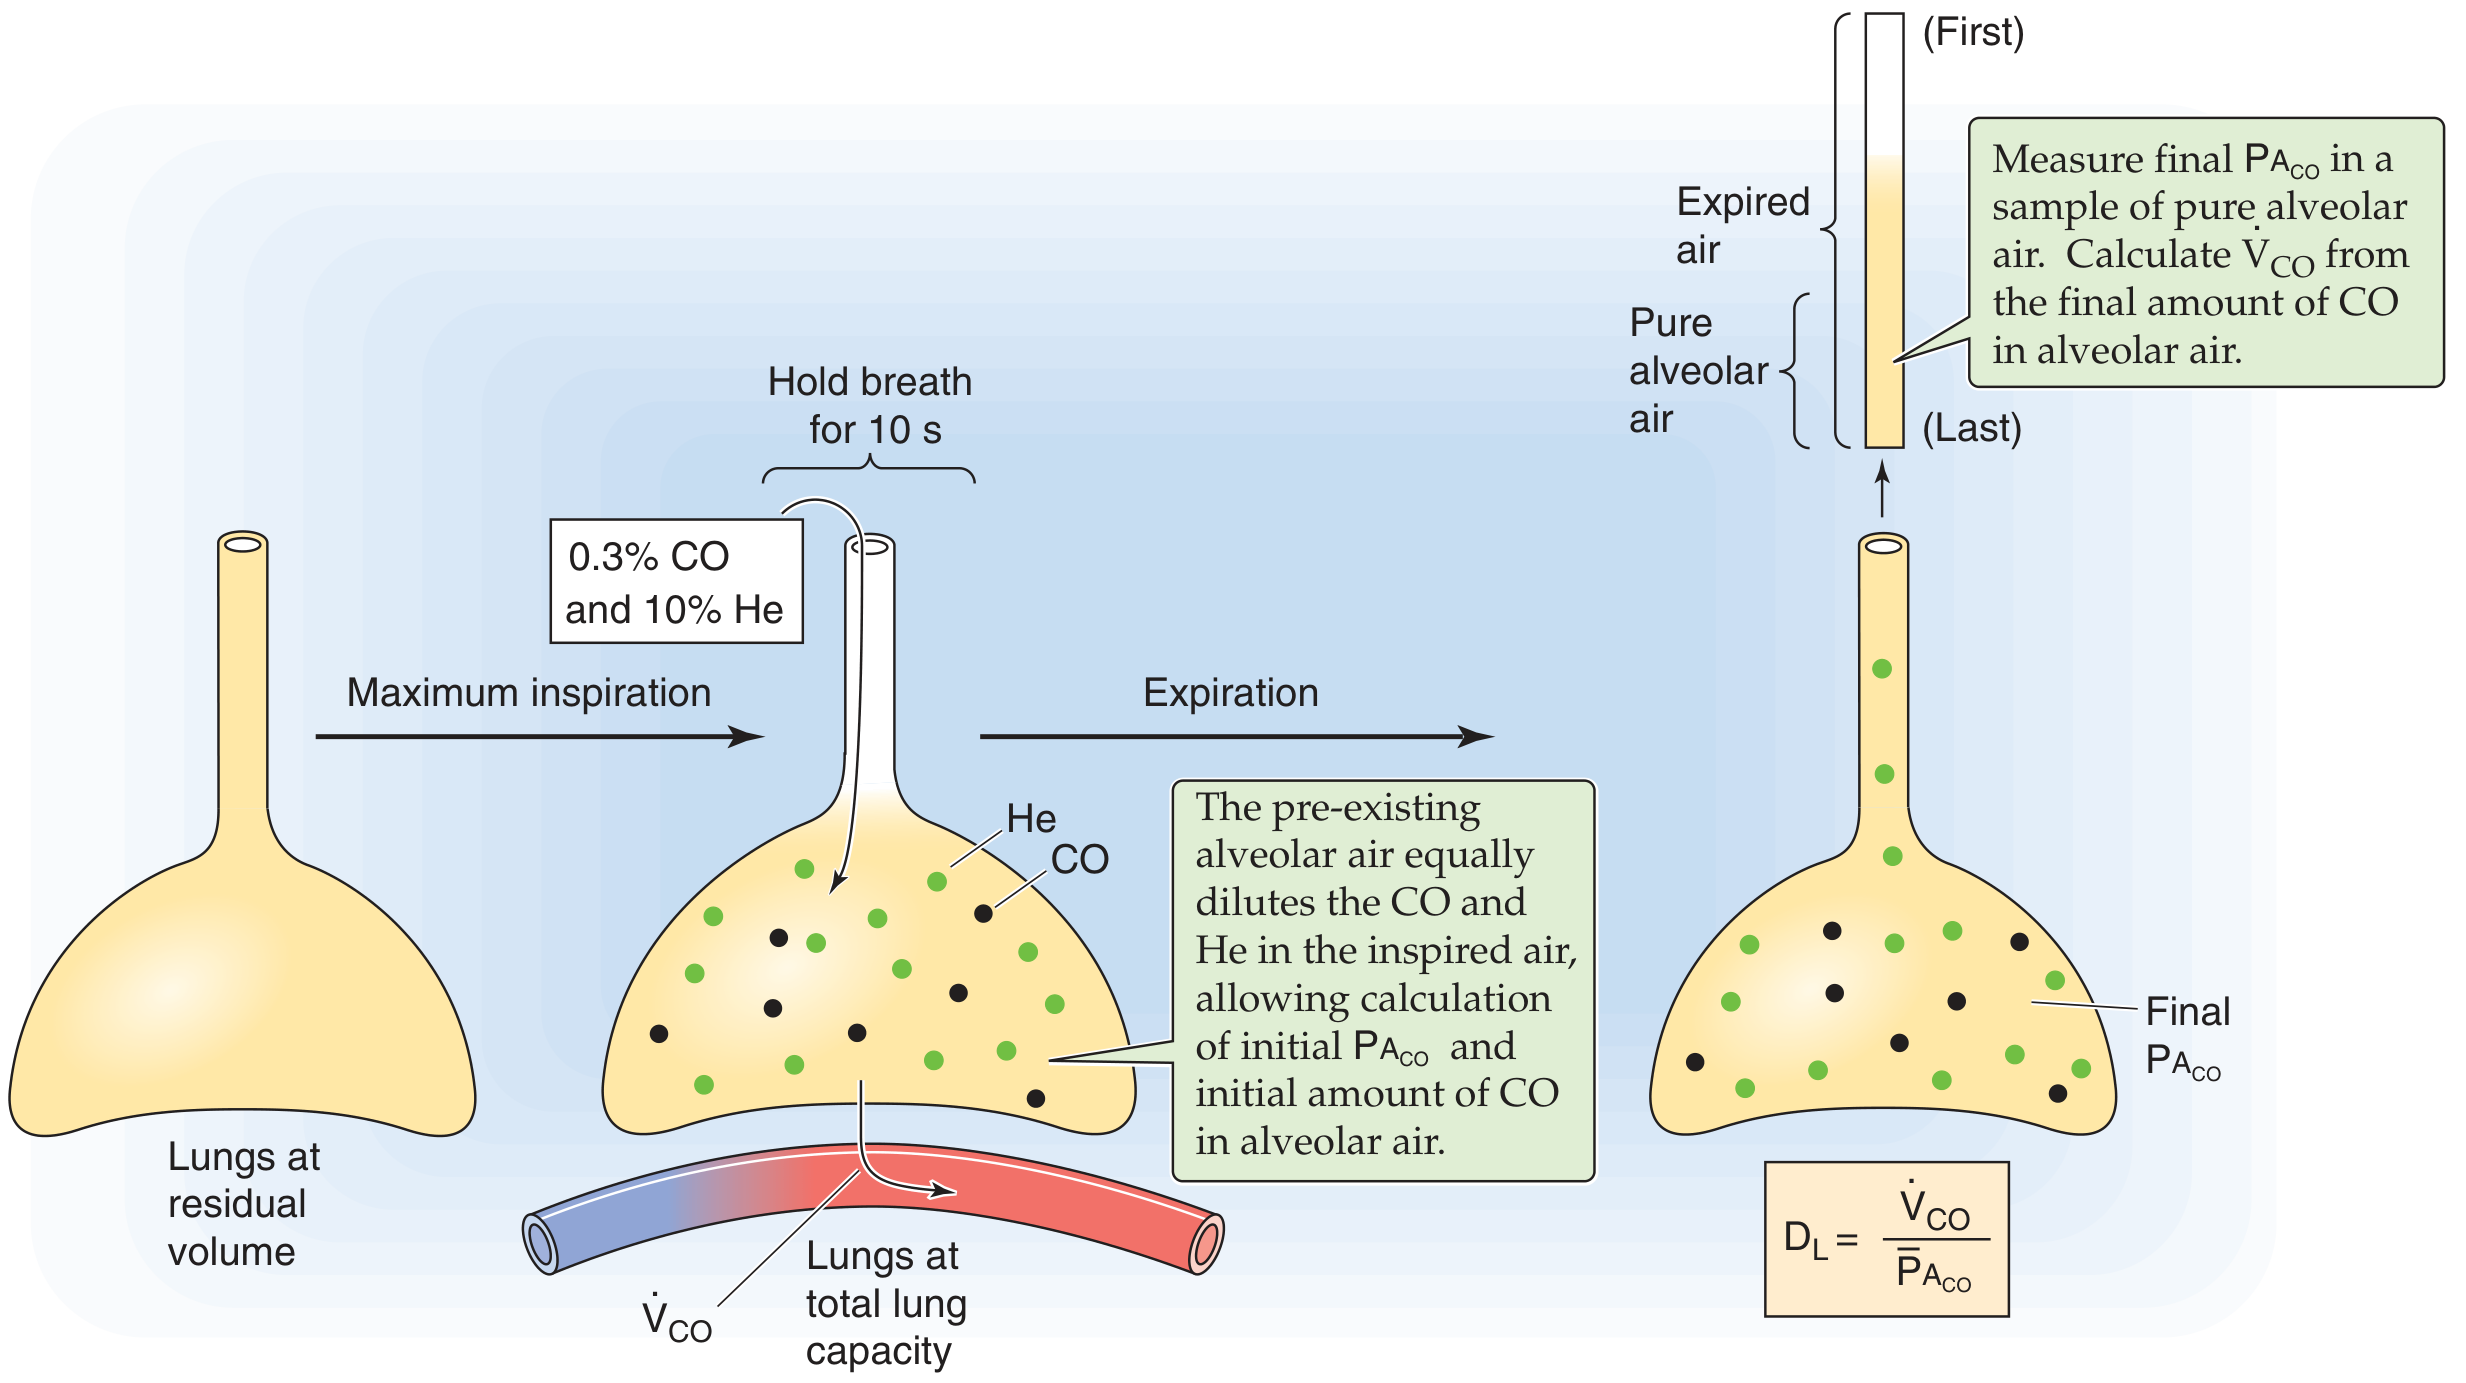
- Standard method: Single-breath DLCO - patient inhales 0.3% CO + inert tracer gas (helium, methane, or neon), holds breath for ~10 seconds, then exhales.
- Factors affecting DLCO (from Murray & Nadel):
| Factor | Effect on DLCO | Mechanism |
|---|---|---|
| Anemia (uncorrected) | Reduced | Fewer heme sites for CO binding |
| Polycythemia | Increased | More heme sites |
| Carboxyhemoglobin | Reduced | Blocks CO binding sites |
| Altitude (low FiO2) | Increased | More heme sites available |
| Valsalva maneuver | Reduced | Decreases capillary blood volume |
| Mueller maneuver | Increased | Increases capillary blood volume |
| Supine position/exercise | Increased | Capillary recruitment |
D. Airway Resistance (Raw)
- Measured by body plethysmography; Raw = Palv / airflow
- Specific airway conductance (sGAW = GAW/TGV) is normalized for lung volume
E. Bronchodilator Reversibility Testing
- Albuterol (180 mcg) is inhaled; spirometry repeated after 10-20 minutes
- Significant reversibility: FEV1 or FVC improvement ≥12% AND ≥200 mL (ATS/ERS criteria)
- Helps distinguish asthma (reversible) from COPD (largely fixed obstruction)
F. Bronchial Provocation (Challenge) Tests
- Methacholine challenge: used when obstruction is suspected but baseline spirometry is normal
- Positive if PC20 (concentration causing 20% FEV1 fall) is low
G. Exercise Testing / 6-Minute Walk Test (6MWT)
- Patient walks a 30-m corridor for 6 minutes at comfortable pace
- Absolute contraindications: unstable angina, MI within 1 month
- Relative contraindications: resting HR >120, systolic BP >180, diastolic BP >100 mmHg
- Terminate if: chest pain, severe dyspnea, diaphoresis, profound desaturation
4. Interpretation: The Three Patterns
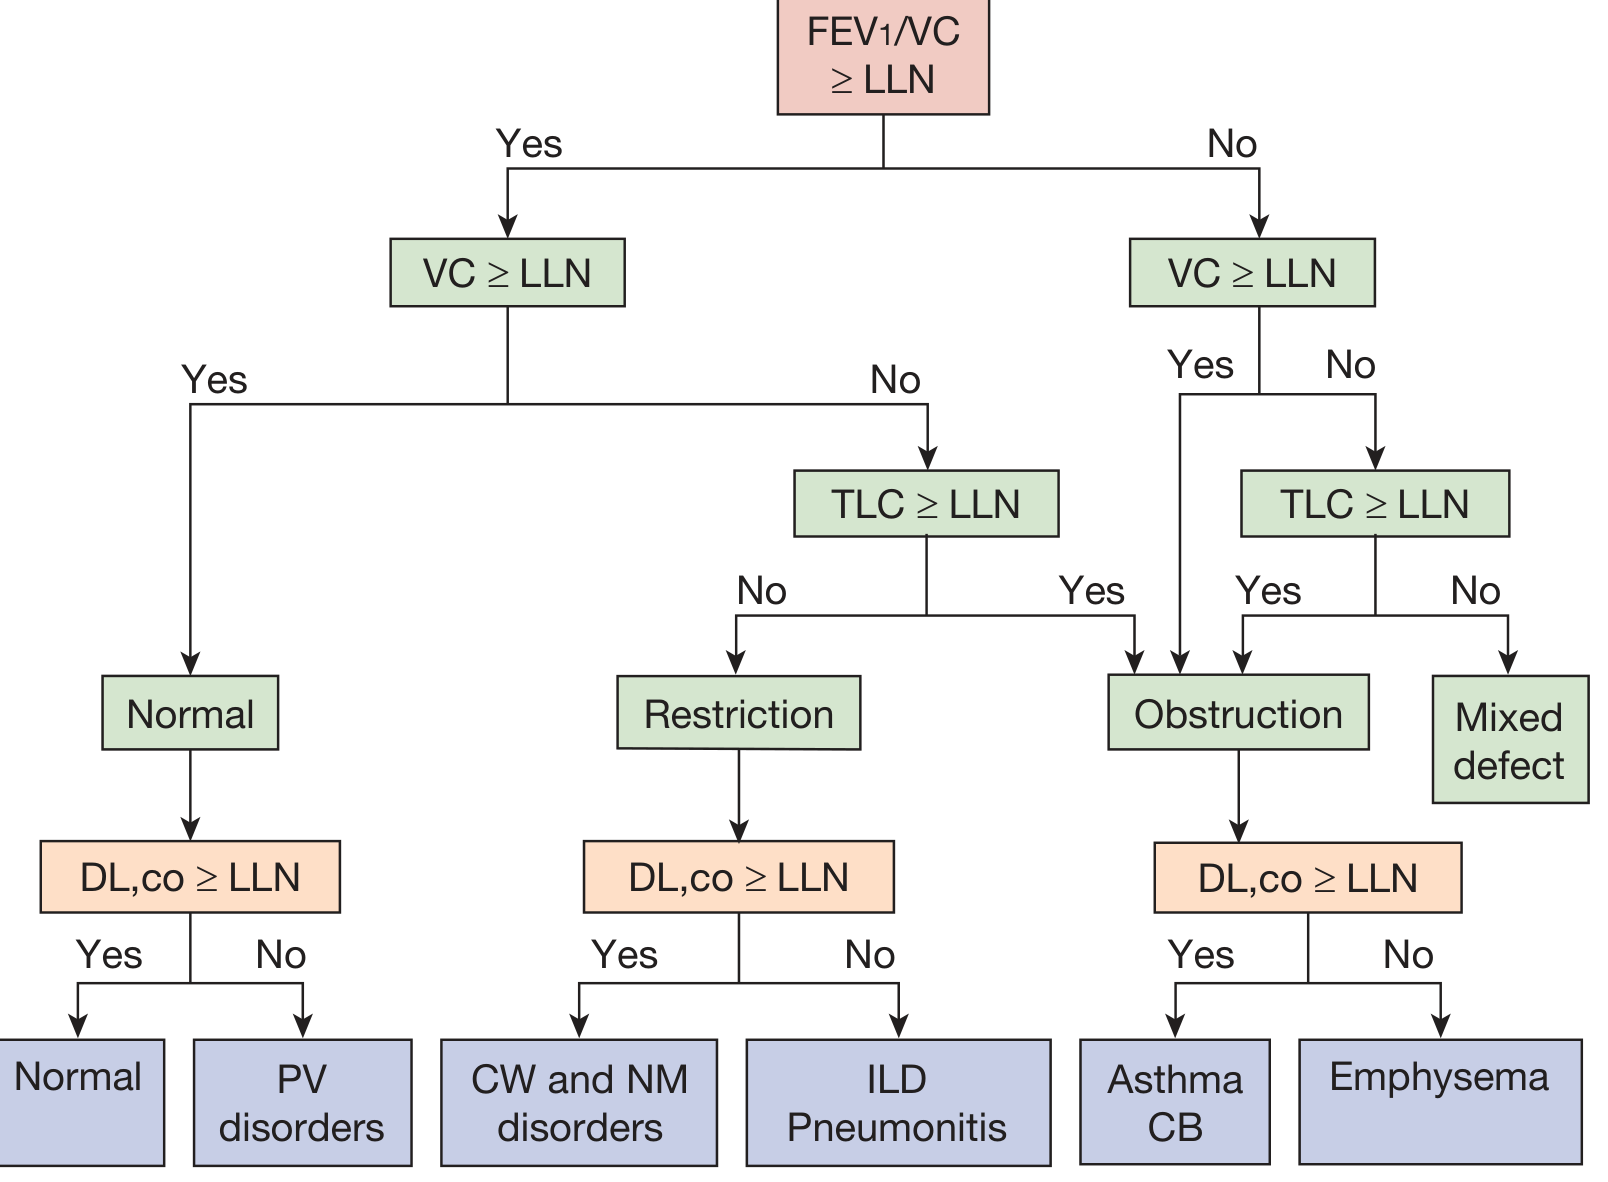
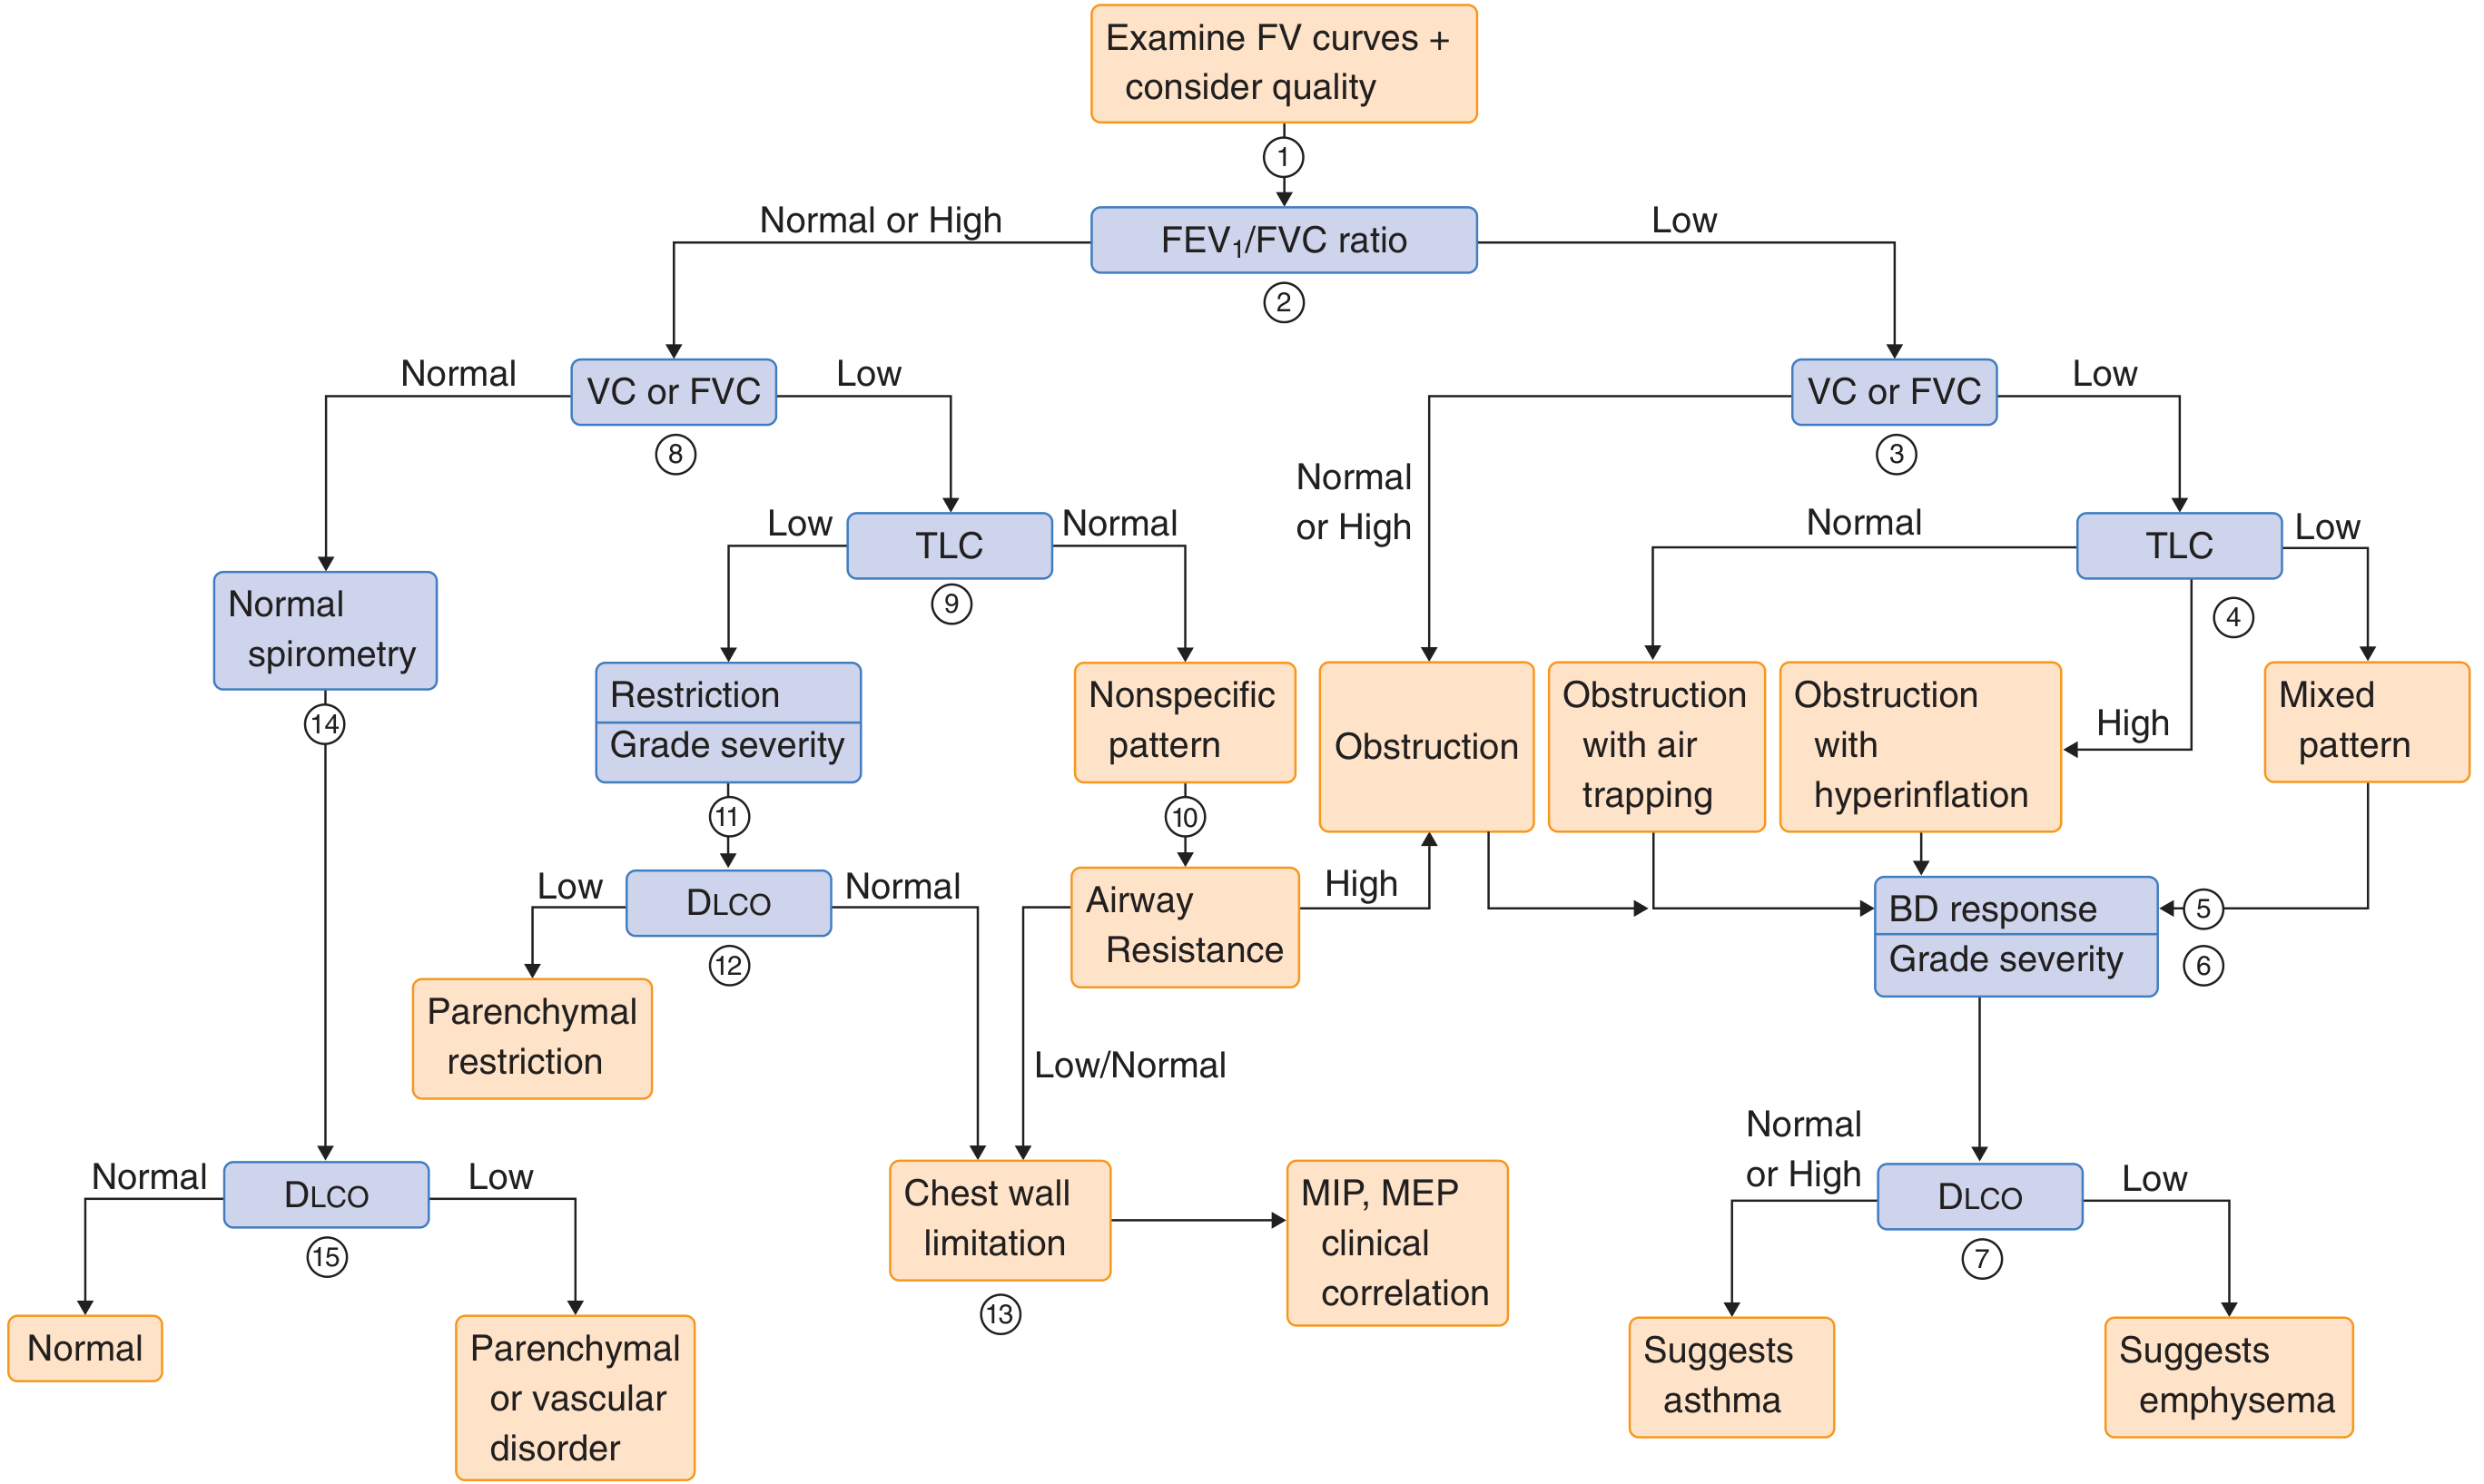
The ATS/ERS algorithm starts with the FEV1/VC ratio compared to the Lower Limit of Normal (LLN = 5th percentile). The classic 70% fixed cutoff is now not recommended as it overdiagnoses COPD in the elderly.
A. Obstructive Pattern
| Parameter | Finding |
|---|---|
| FEV1/VC | Reduced (< LLN) |
| FVC | Normal or reduced |
| TLC | Normal or elevated (hyperinflation) |
| RV | Often elevated (air trapping) |
| DLCO | Normal (asthma, chronic bronchitis) or Reduced (emphysema) |
Causes: COPD (chronic bronchitis, emphysema), asthma, bronchiectasis, cystic fibrosis, small airway disease, upper airway obstruction
B. Restrictive Pattern
| Parameter | Finding |
|---|---|
| FEV1/VC | Normal or high |
| FVC | Reduced |
| TLC | Reduced (required to confirm true restriction) |
| RV | Usually reduced (except neuromuscular disorders) |
| DLCO | Reduced (parenchymal disease, ILD) or normal (chest wall/neuromuscular) |
Causes:
- Primary parenchymal - pneumonia, fibrosis, atelectasis, tumor
- Surgical removal of lung tissue
- Pleura/chest wall - pleural fibrosis, effusion, kyphoscoliosis, obesity
- Neuromuscular disorders (spinal cord, peripheral nerve, NMJ, muscle)
In neuromuscular disease: ERV is specifically decreased (loss of expiratory force), so RV is often paradoxically increased while TLC is reduced.
C. Mixed Obstructive-Restrictive Pattern
- Low FEV1/VC AND reduced TLC
- Caused by pathologic processes affecting both airflow and lung volumes
D. DLCO Severity Classification (Fishman's)
| Severity | DLCO (% predicted) |
|---|---|
| Mild | >60, but < LLN |
| Moderate | 40-60 |
| Severe | <40 |
5. Reference Values and LLN
- Reference values account for height, age, sex, and ethnic background.
- The LLN (5th percentile / z-score < -1.645) is preferred over fixed cutoffs (e.g., FEV1 < 80% predicted).
- A study of 11,413 patients showed fixed cutoffs could misdiagnose >20% of patients.
- Z-scores (standard deviations from mean) avoid age/height bias inherent in percentage-of-predicted thresholds.
- Goldman-Cecil Medicine
6. Severity Grading of Obstruction (GOLD-based)
| Grade | FEV1 % Predicted (post-bronchodilator) |
|---|---|
| Mild | ≥80% |
| Moderate | 50-79% |
| Severe | 30-49% |
| Very Severe | <30% |
7. Specific PFT Findings by Disease
| Disease | FEV1/FVC | FVC | TLC | DLCO | Notes |
|---|---|---|---|---|---|
| Asthma | Low (reversible) | Normal/Low | Normal/High | Normal | Reversible with bronchodilator |
| COPD/Emphysema | Low | Low/Normal | High | Low | Air trapping, hyperinflation |
| Chronic Bronchitis | Low | Low/Normal | Normal/High | Normal | Airway secretions |
| IPF / ILD | Normal/High | Low | Low | Low | Hallmark: reduced DLCO + restriction |
| Pulmonary hypertension | Normal | Normal | Normal | Low | Isolated DLCO reduction |
| Chest wall/NM disease | Normal/High | Low | Low | Normal | Normal DLCO |
| Kyphoscoliosis | Normal/High | Low | Low | May be low | Thoracic cage restriction |
8. Flow-Volume Loops
The shape of the flow-volume loop gives additional diagnostic clues:
- Normal: characteristic bell shape on expiration, flat inspiratory limb
- Obstruction: concave (scooped) expiratory limb - flow drops rapidly
- Restriction: narrow tall loop with reduced volumes but preserved flow rates
- Variable extrathoracic obstruction (e.g., vocal cord dysfunction, tracheomalacia): flattening of the inspiratory limb
- Variable intrathoracic obstruction: flattening of the expiratory limb
- Fixed obstruction (tracheal stenosis): flattening of both limbs
9. Quality Criteria
Because PFTs are effort-dependent, results must meet acceptability and reproducibility criteria (ATS/ERS standards):
- At least 3 acceptable maneuvers with FVC and FEV1 values within 150 mL of each other
- The largest FVC and FEV1 from acceptable maneuvers are used
- Poor reproducibility with consistently subnormal peak flows raises concern for poor effort
- Consistently low values despite maximal effort may signal neuromuscular disease
Sources:
- Murray & Nadel's Textbook of Respiratory Medicine, 2-Volume - Chapters 31 & 32
- Fishman's Pulmonary Diseases and Disorders - Chapter 31
- Goldman-Cecil Medicine - Chapter 73
- Barash, Cullen, and Stoelting's Clinical Anesthesia - Chapter 38
Diagrams
Searching sources...
Finding Sources
Finding Sources
Reading File
Reading File
Finding Sources
Reading File
Reading File
Reading File
Loading Image
Loading Image
Loading Image
Reading File
Finding Sources
Loading Image
Reading File
Reading File
Finding Sources
Reading File
Reading File
Loading Image
Reading File
Loading Image
Reading File
Loading Image
Reading File
I now have an excellent set of diagrams. Let me compile them all into a well-organized visual reference.
PFT Diagrams
Here are all the key diagrams for Pulmonary Function Tests, sourced from authoritative textbooks.
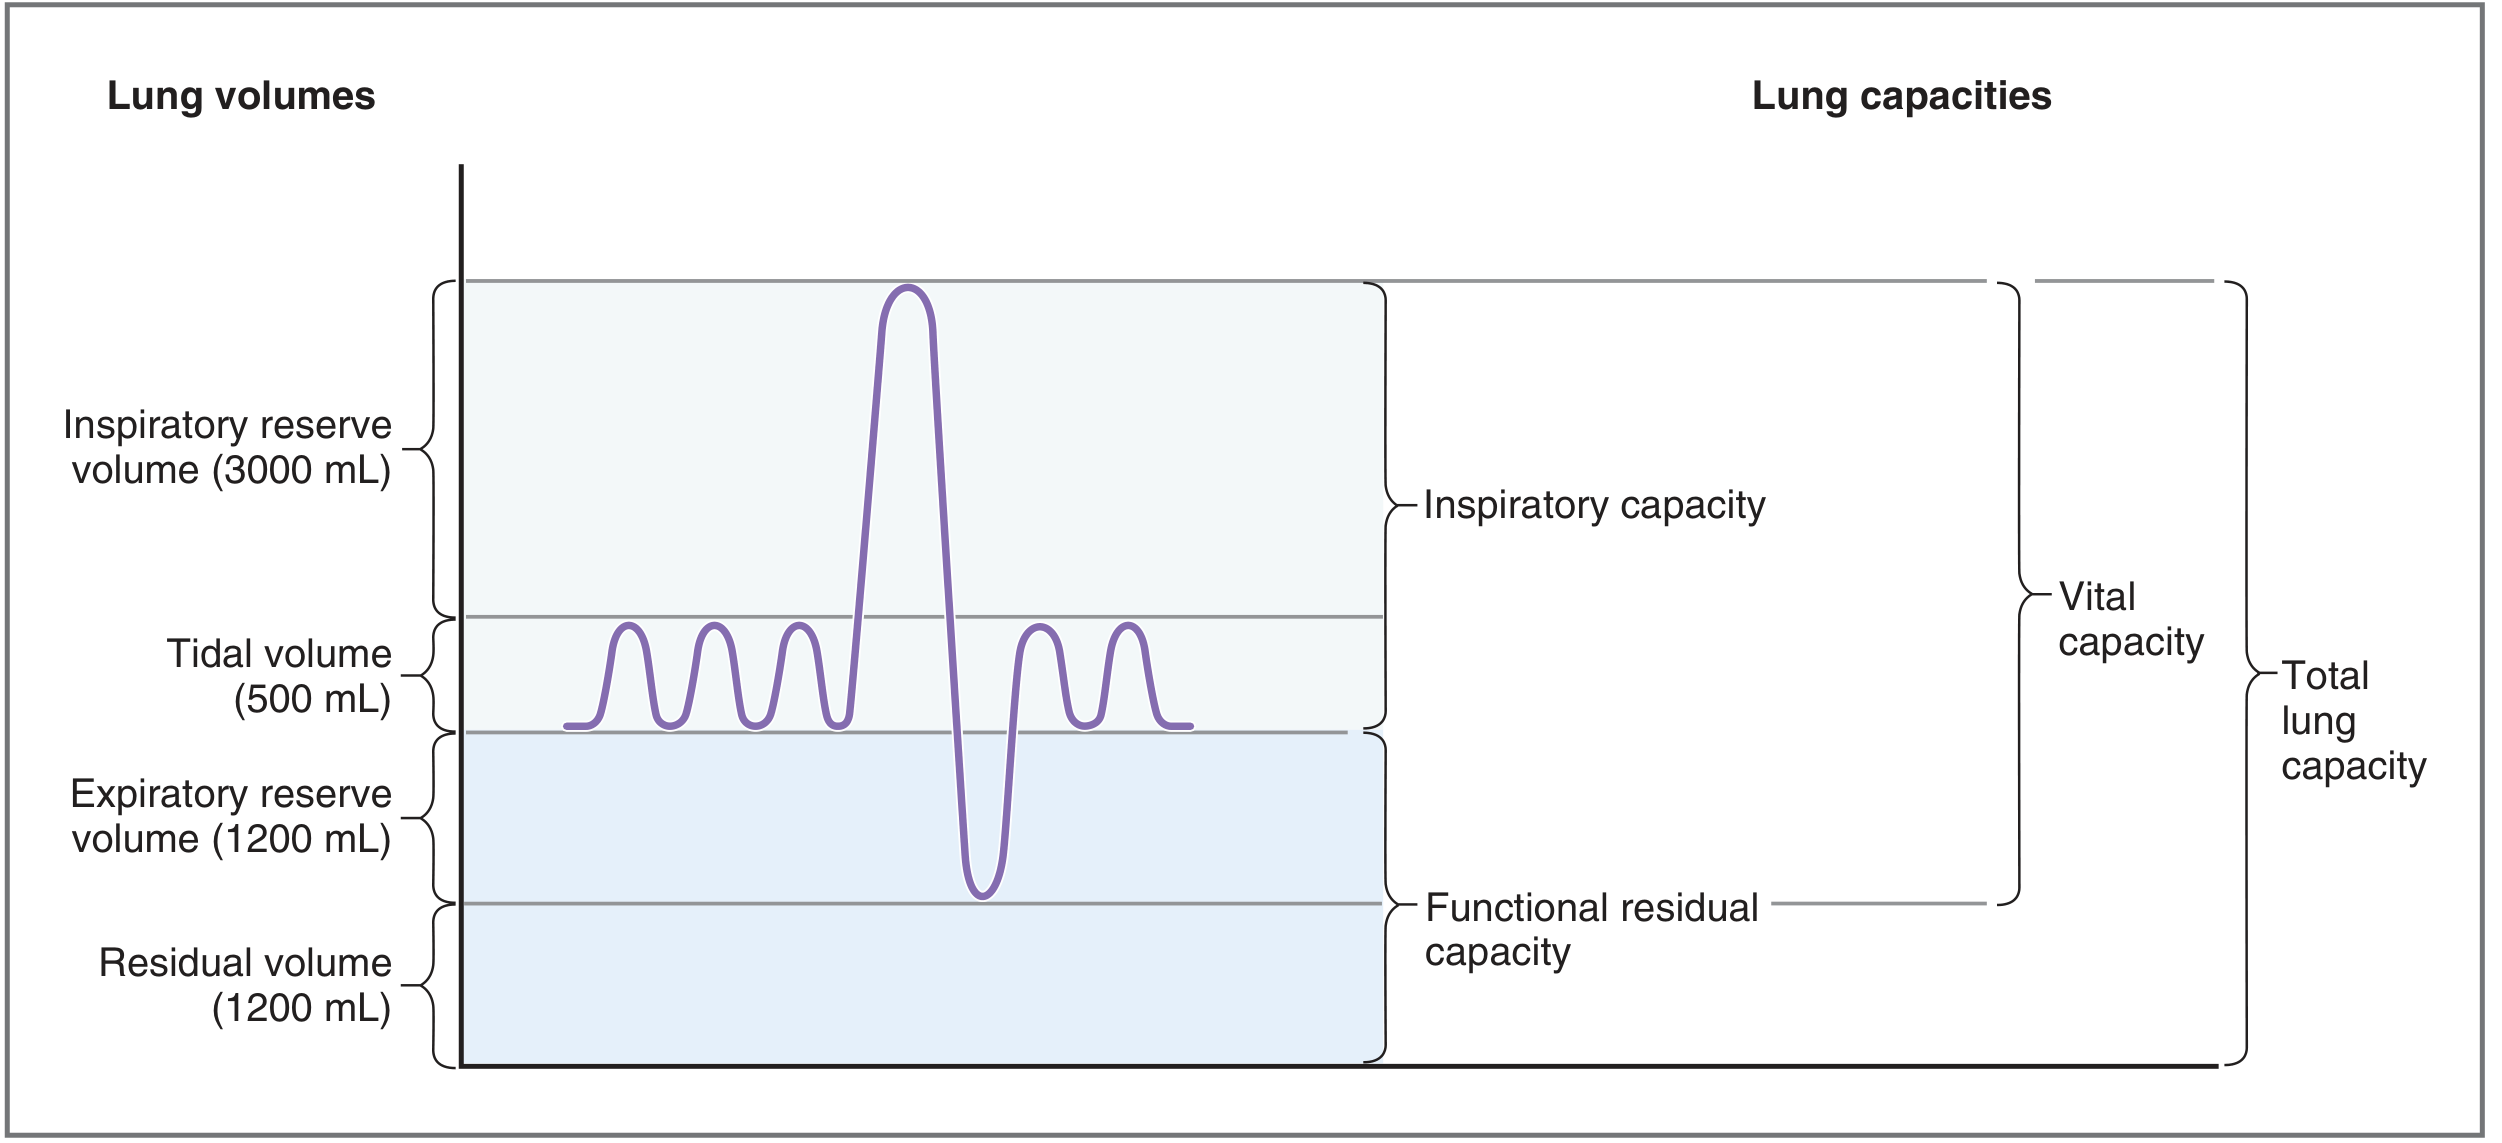
1. Lung Volumes and Capacities
From Costanzo Physiology 7e - The classic schematic showing all 4 volumes and 4 capacities with normal values:
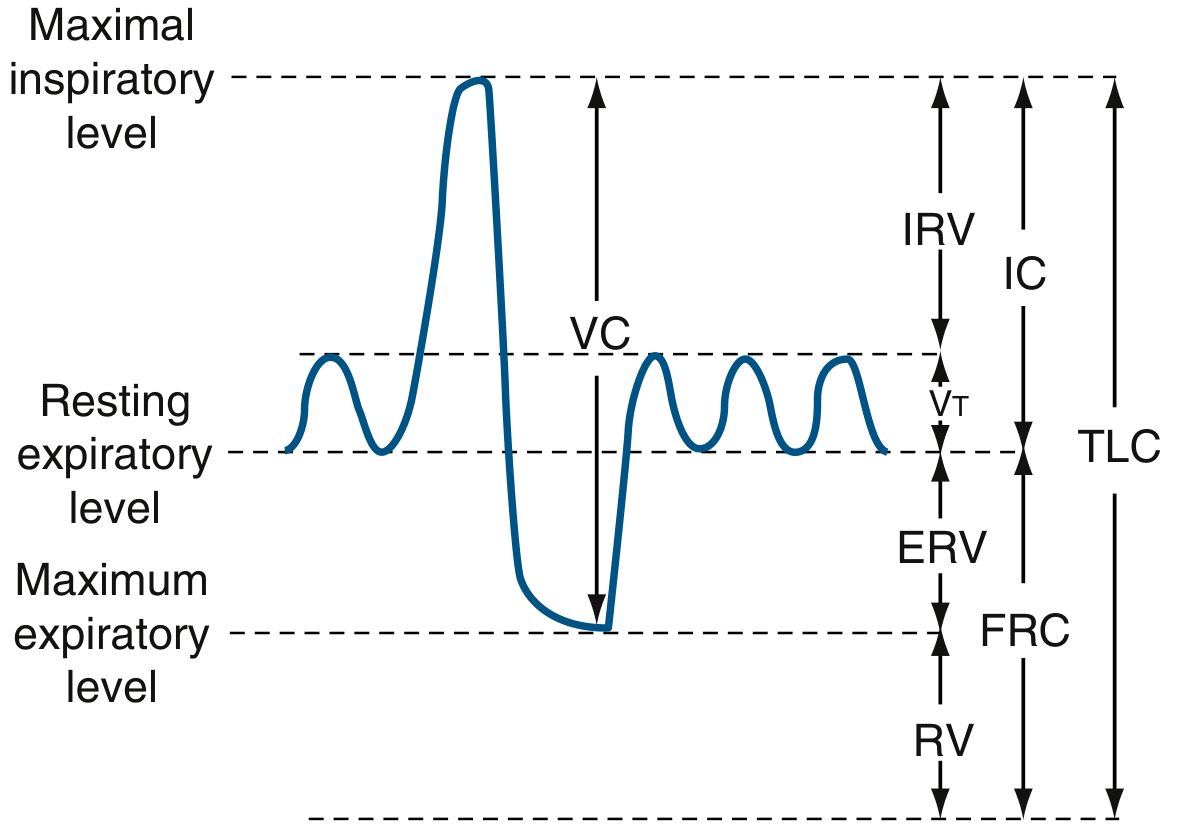
From Murray & Nadel's Textbook of Respiratory Medicine - Detailed spirometer tracing with all compartments labeled (IRV, VT, ERV, RV, IC, FRC, VC, TLC):
2. Volume-Time Spirograms (FVC Curve)
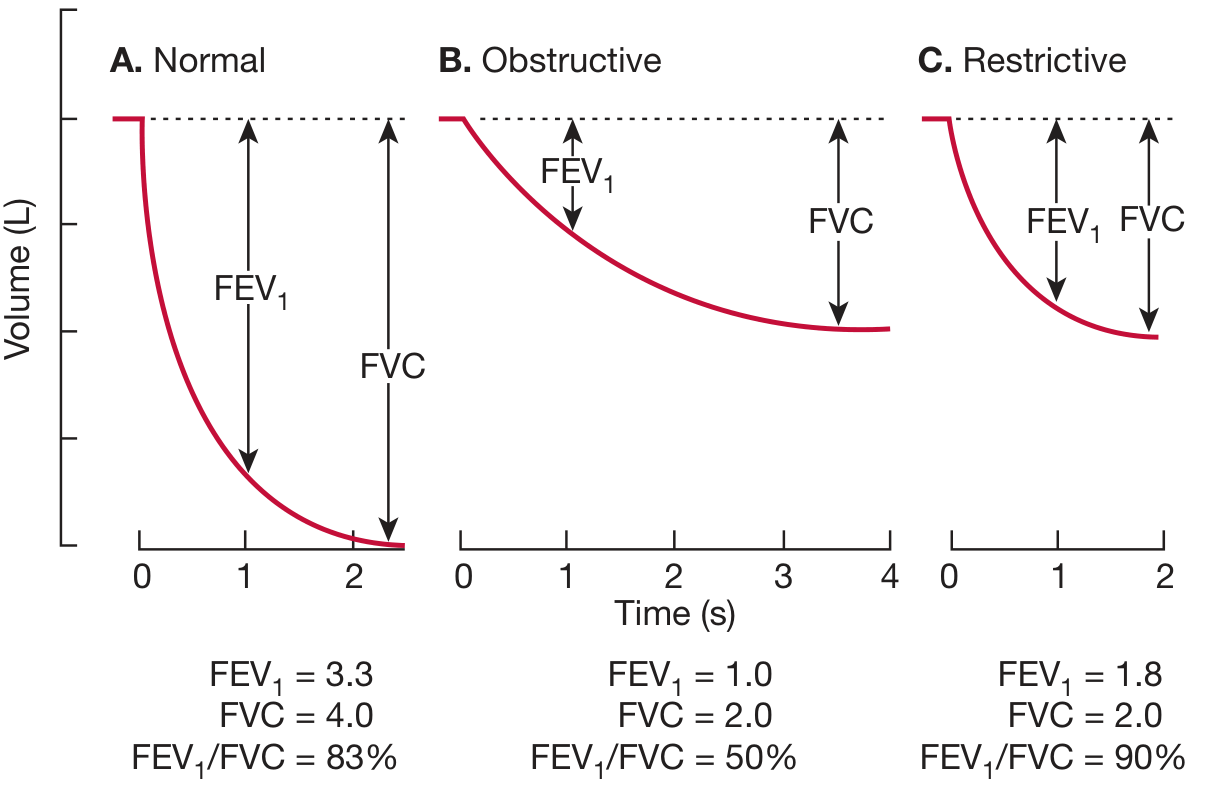
From Fishman's Pulmonary Diseases - Normal vs. Obstructive vs. Restrictive spirograms side by side, showing FEV1/FVC values for each pattern:
- Normal: FEV1 = 3.3 L, FVC = 4.0 L, FEV1/FVC = 83%
- Obstructive: FEV1 = 1.0 L, FVC = 2.0 L, FEV1/FVC = 50% (prolonged expiration)
- Restrictive: FEV1 = 1.8 L, FVC = 2.0 L, FEV1/FVC = 90% (short, steep, small volume)
3. Flow-Volume Curve (Normal)
From Barash Clinical Anesthesia - Normal flow-volume loop showing effort-dependent (high lung volume) and effort-independent (low lung volume) portions, with V75, V50, V25 marked:
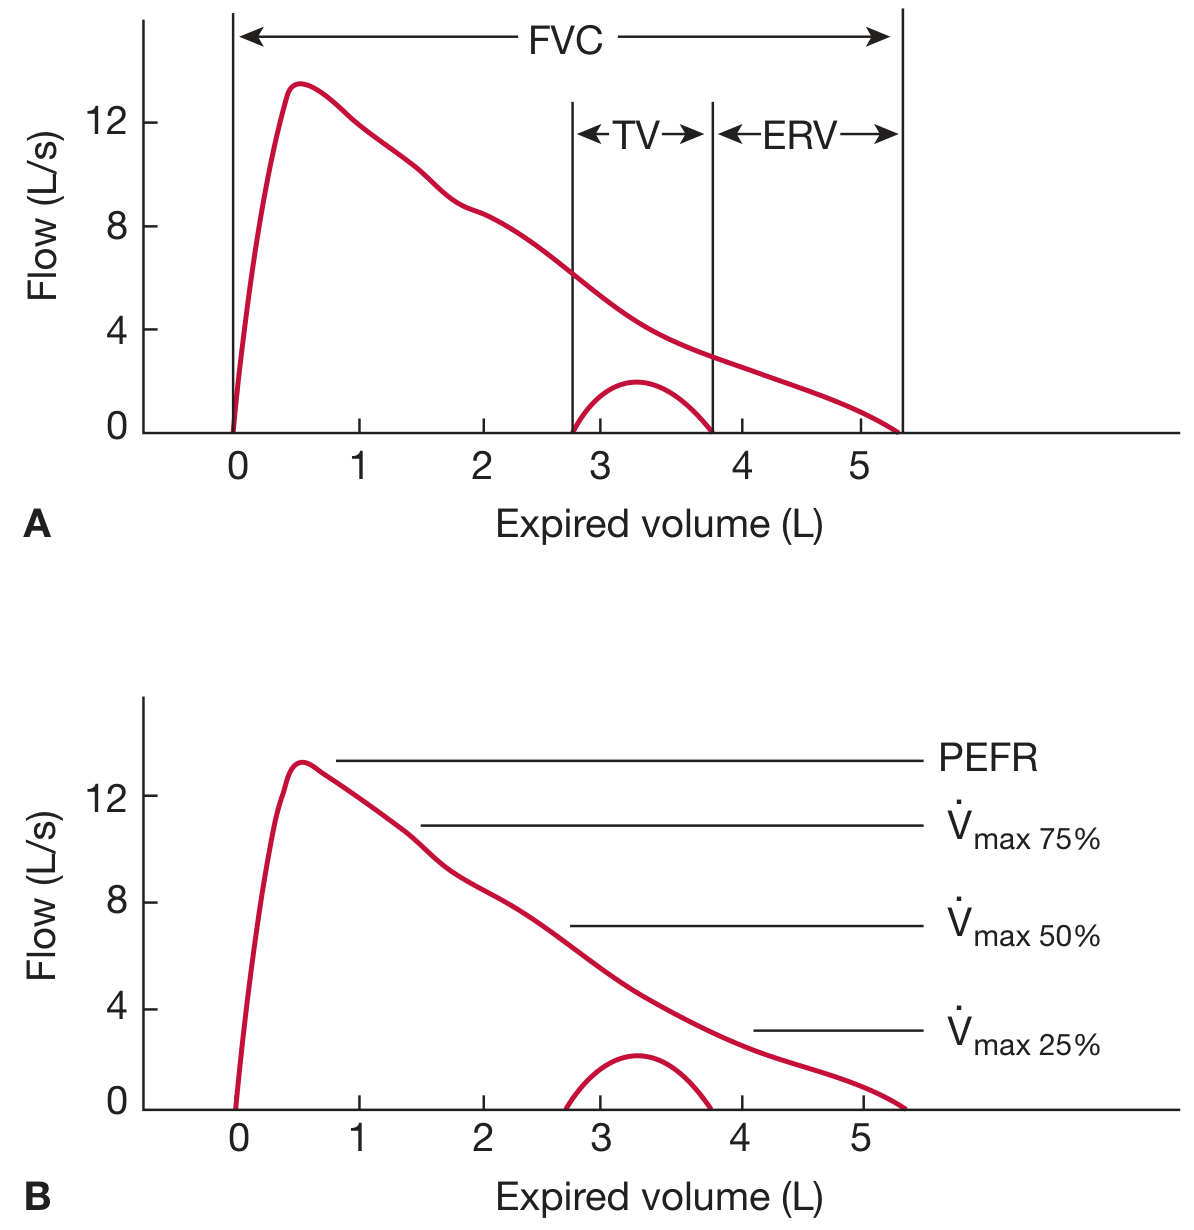
From Fishman's Pulmonary Diseases - Expiratory flow-volume curve showing PEFR, V̇max 75%, 50%, 25% with TV and ERV subdivisions:
4. Flow-Volume Loops: Disease Patterns
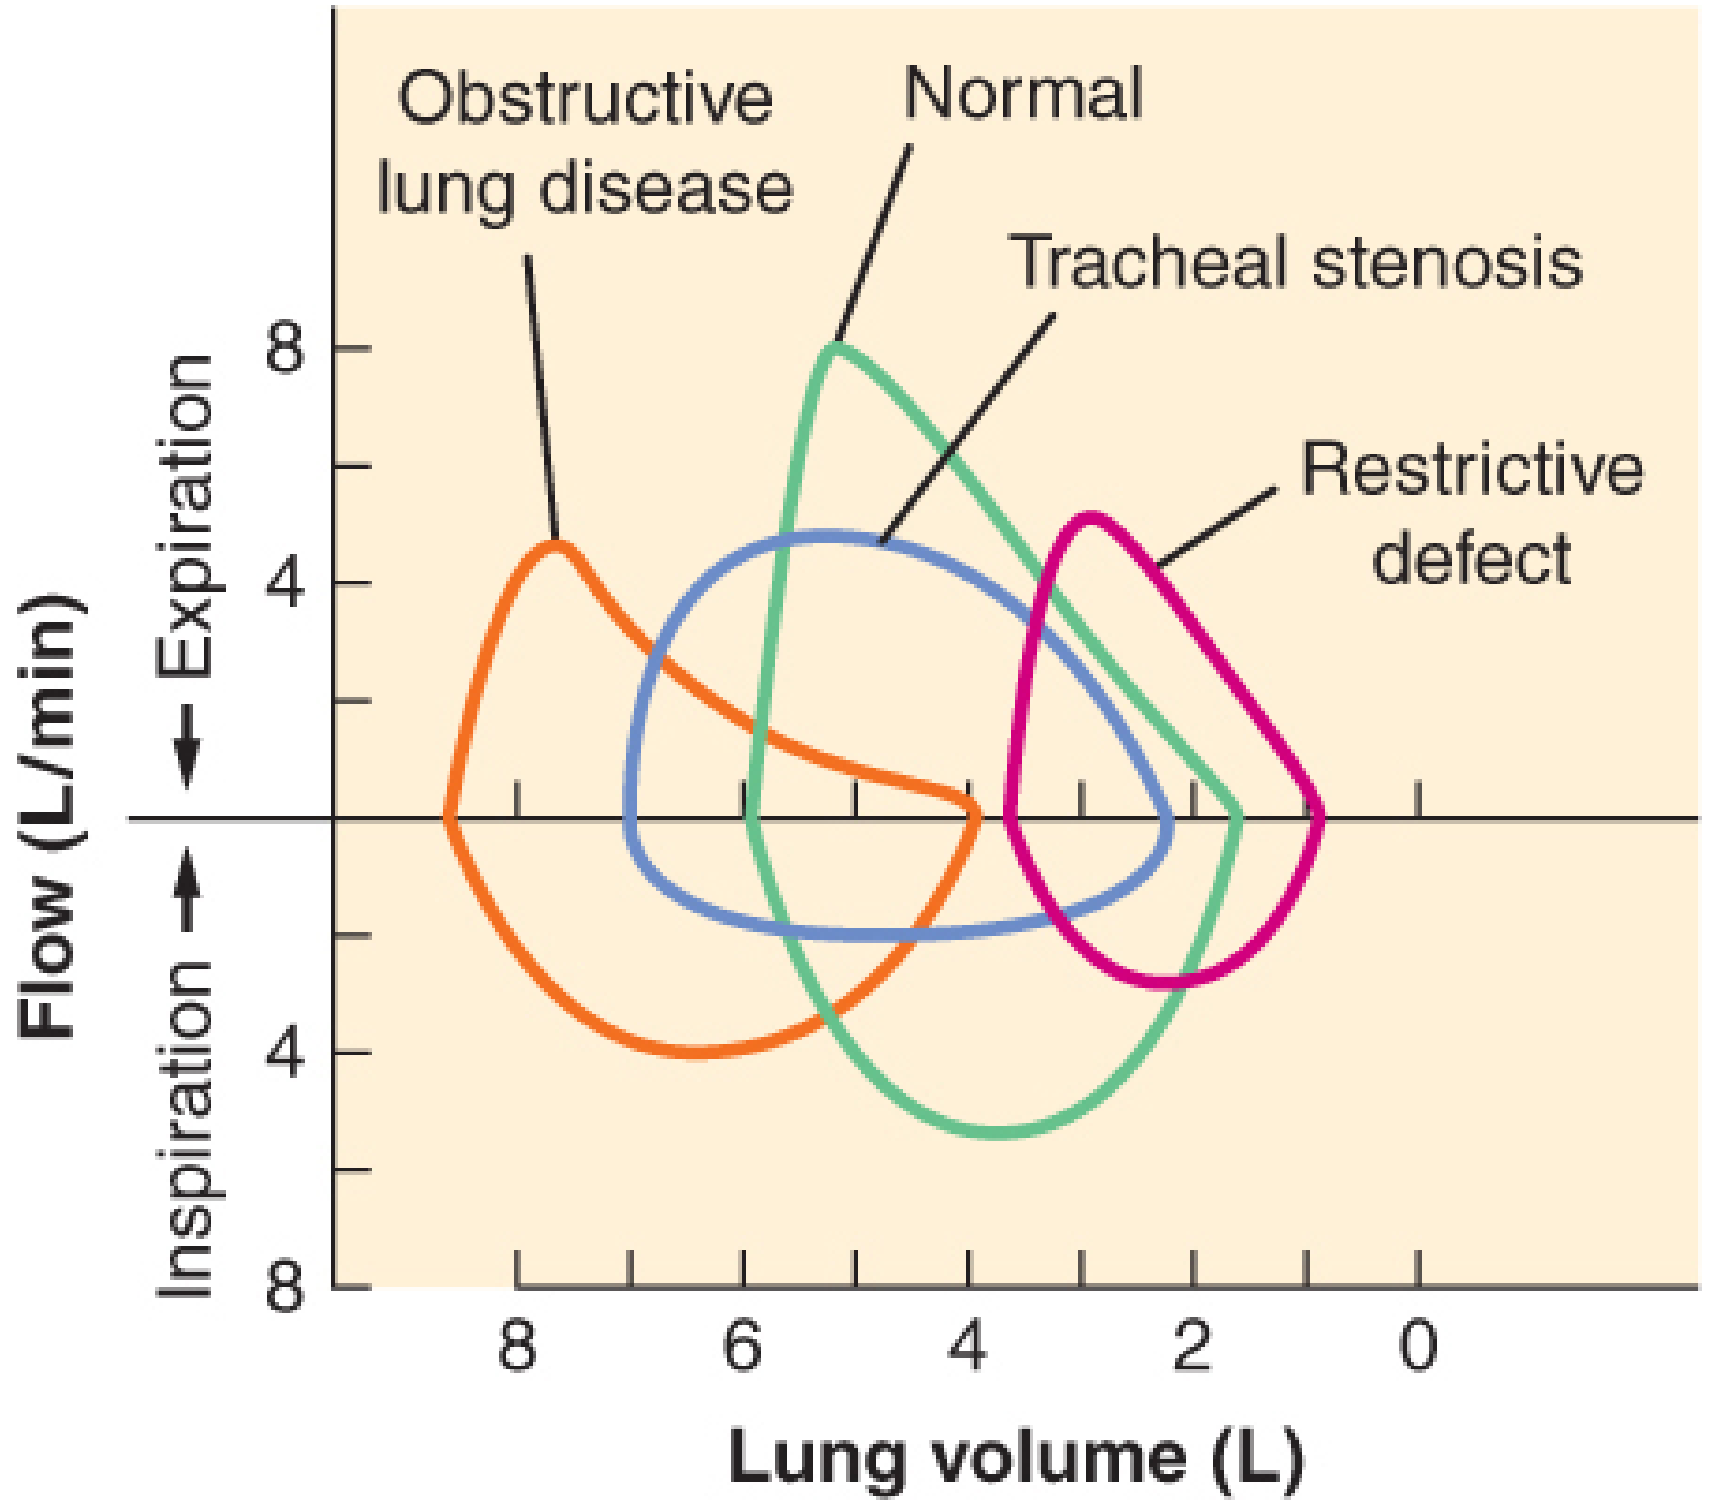
From Barash Clinical Anesthesia - Overlapping loops comparing Normal, Obstructive (COPD), Fixed obstruction (tracheal stenosis), and Restrictive defect (pulmonary fibrosis):
- Obstructive: shifted left (hyperinflation), concave/scooped expiratory limb, reduced peak flow
- Restrictive: narrow tall loop shifted right, reduced total volume, preserved flow rates
- Fixed obstruction: both inspiratory and expiratory limbs flattened ("box" shape)
5. PFT Interpretation Algorithms
From Fishman's Pulmonary Diseases - ATS/ERS recommended algorithm starting from FEV1/VC ratio, branching to Normal, Restriction, Obstruction, or Mixed defect, then incorporating DLCO to identify specific disorders (PV disorders, CW/NM disease, ILD, Asthma/CB, Emphysema):
From Goldman-Cecil Medicine - Comprehensive algorithm incorporating bronchodilator response, airway resistance, MIP/MEP, and DLCO to fully characterize obstruction (simple, air trapping, hyperinflation, mixed), restriction (parenchymal vs. chest wall), and isolated parenchymal/vascular disorders:
6. DLCO Single-Breath Method
From Medical Physiology (Boron & Boulpaep) - Step-by-step diagram of the single-breath DLCO maneuver: inhale 0.3% CO + 10% He at RV → hold breath for 10 s at TLC → exhale → measure final alveolar PA,CO → calculate DL = V̇CO / P̄A,CO:
Quick Reference Summary
| Pattern | FEV1/FVC | FVC | TLC | DLCO |
|---|---|---|---|---|
| Normal | ≥ LLN | Normal | Normal | Normal |
| Obstruction | ↓ (< LLN) | Normal/↓ | Normal/↑ | Normal or ↓ |
| Restriction | Normal/↑ | ↓ | ↓ | ↓ (parenchymal) or normal |
| Mixed | ↓ | ↓ | ↓ | Variable |
This is a shared conversation. Sign in to Orris to start your own chat.