
Explain cardio physiology with images
Reading File
Now let me search the medical library for cardiology/cardiovascular physiology content with images.
Finding Sources
Finding Sources
Good. Let me read the most comprehensive cardio physiology sections from Guyton & Hall and Ganong's, plus search for key topics with images.
Reading File
Reading File
Finding Sources
Finding Sources
Excellent - I have good content and image URLs. Let me now read more key sections and fetch the images in parallel.
Reading File
Reading File
Loading Image
Now let me fetch the cardiac muscle histology and ventricular fiber images, and also read more content on action potentials and conduction.
Loading Image
Loading Image
Reading File
Excellent! Let me fetch the action potential images and read more on the cardiac cycle and conduction system.
Loading Image
Loading Image
Finding Sources
Reading File
Now let me get the Frank-Starling content and cardiac cycle diagram, plus the conduction system image.
Reading File
Finding Sources
I now have rich content and images from Guyton & Hall and Costanzo Physiology. Let me fetch two more key images and compile the comprehensive answer.
Loading Image
Loading Image
I now have comprehensive content and images. Let me compile the full cardiovascular physiology explanation.
Cardiovascular Physiology
Sources: Guyton and Hall Textbook of Medical Physiology | Costanzo Physiology 7th Edition | Ganong's Review of Medical Physiology
1. Heart Structure and Blood Flow
The heart is a four-chambered pump that keeps two circuits running simultaneously: the pulmonary circulation (right heart → lungs → left heart) and the systemic circulation (left heart → body → right heart).
The wall has three layers:
- Endocardium - inner lining
- Myocardium - muscular middle layer (does the pumping work)
- Epicardium - outer layer, covered by the pericardium
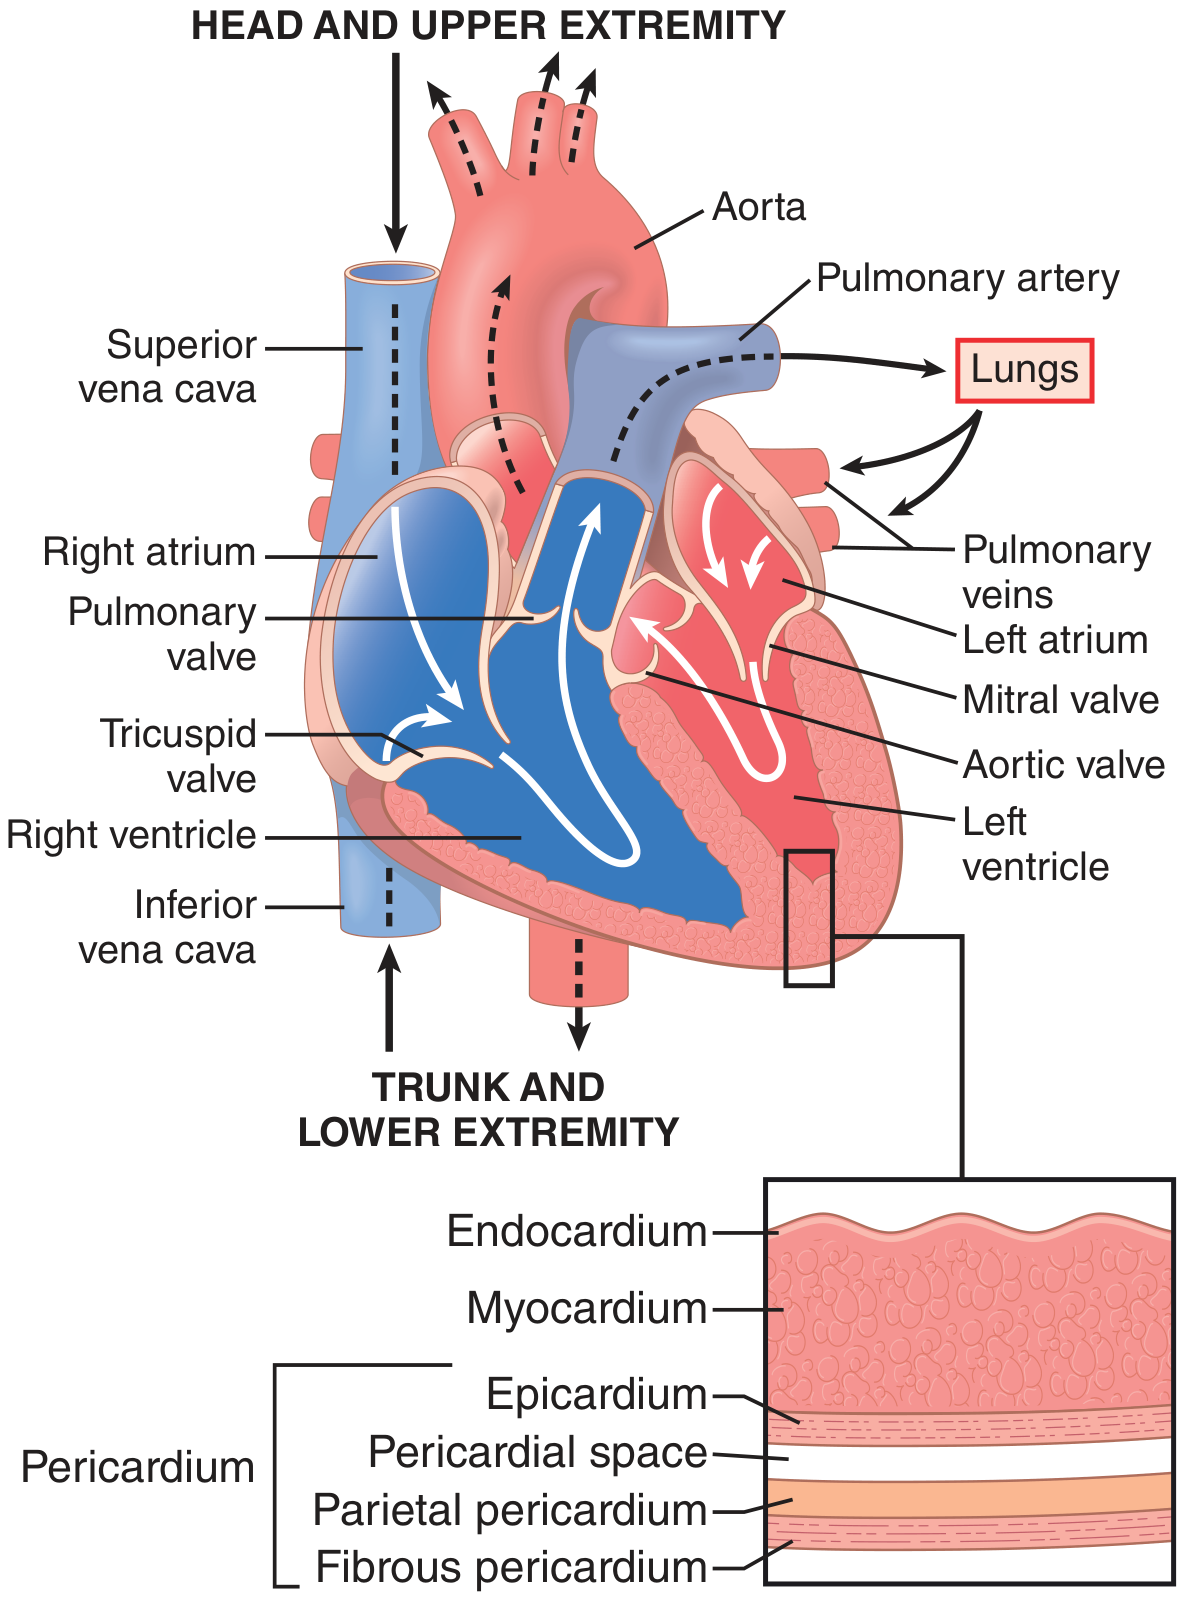
Blood from the body (deoxygenated) enters the right atrium via the superior and inferior venae cavae → through the tricuspid valve → right ventricle → through the pulmonary valve → pulmonary artery → lungs (gas exchange) → pulmonary veins → left atrium → through the mitral valve → left ventricle → through the aortic valve → aorta → systemic tissues.
2. Cardiac Muscle Microstructure
The heart is composed of three types of cardiac muscle:
- Atrial muscle - contracts to push blood into ventricles
- Ventricular muscle - contracts powerfully to eject blood into arteries
- Specialized excitatory/conductive fibers - generate and propagate the electrical signal (SA node, AV node, His-Purkinje system)
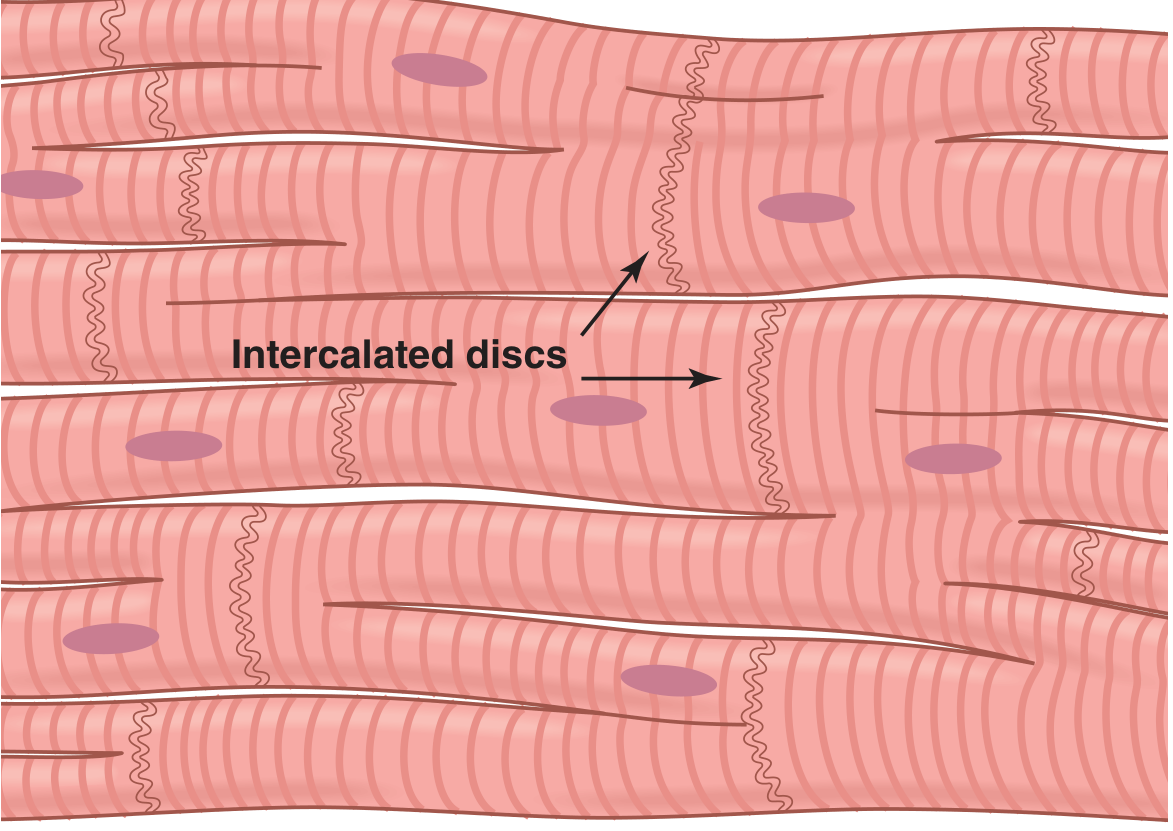
Cardiac muscle is striated (like skeletal muscle) and uses actin-myosin sliding filament mechanism. The key structural feature is the intercalated disc - cell membrane junctions containing gap junctions that allow free ion diffusion, making the heart a functional syncytium: when one cell fires, the action potential spreads to all cells rapidly.
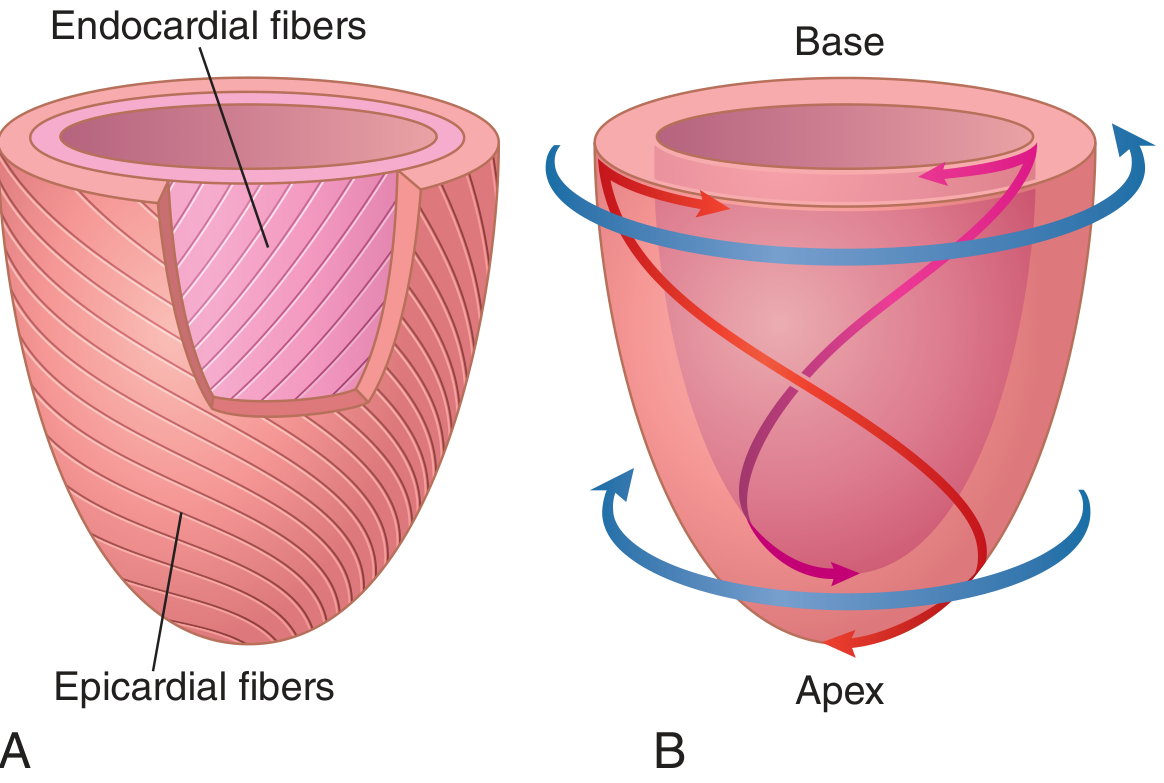
The left ventricle has a unique double-helix fiber arrangement: subepicardial fibers spiral leftward, subendocardial fibers spiral rightward. This creates a twisting/torsion motion during systole that maximizes ejection efficiency, and a recoil (untwisting) during diastole that facilitates rapid filling.
3. Cardiac Action Potential
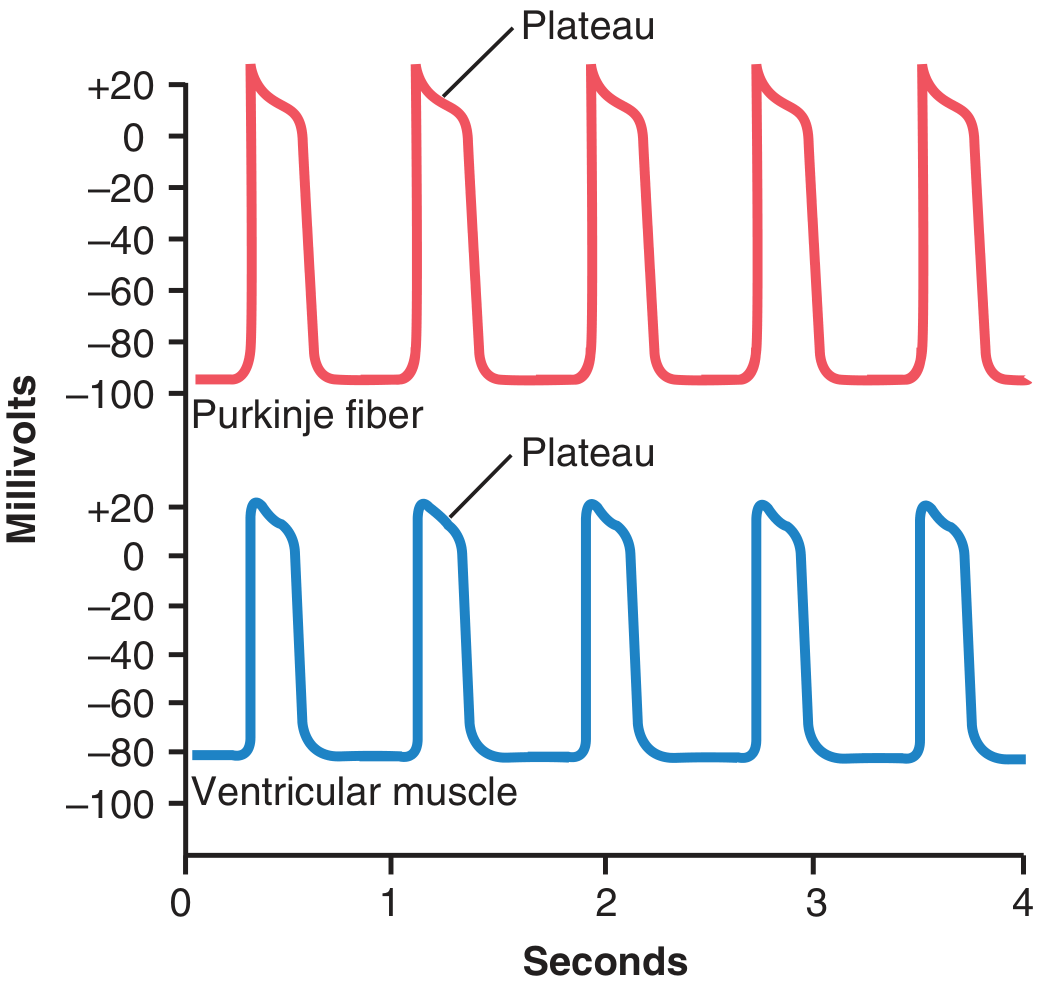
The ventricular muscle action potential has 5 phases and lasts about 300 ms (15x longer than skeletal muscle).
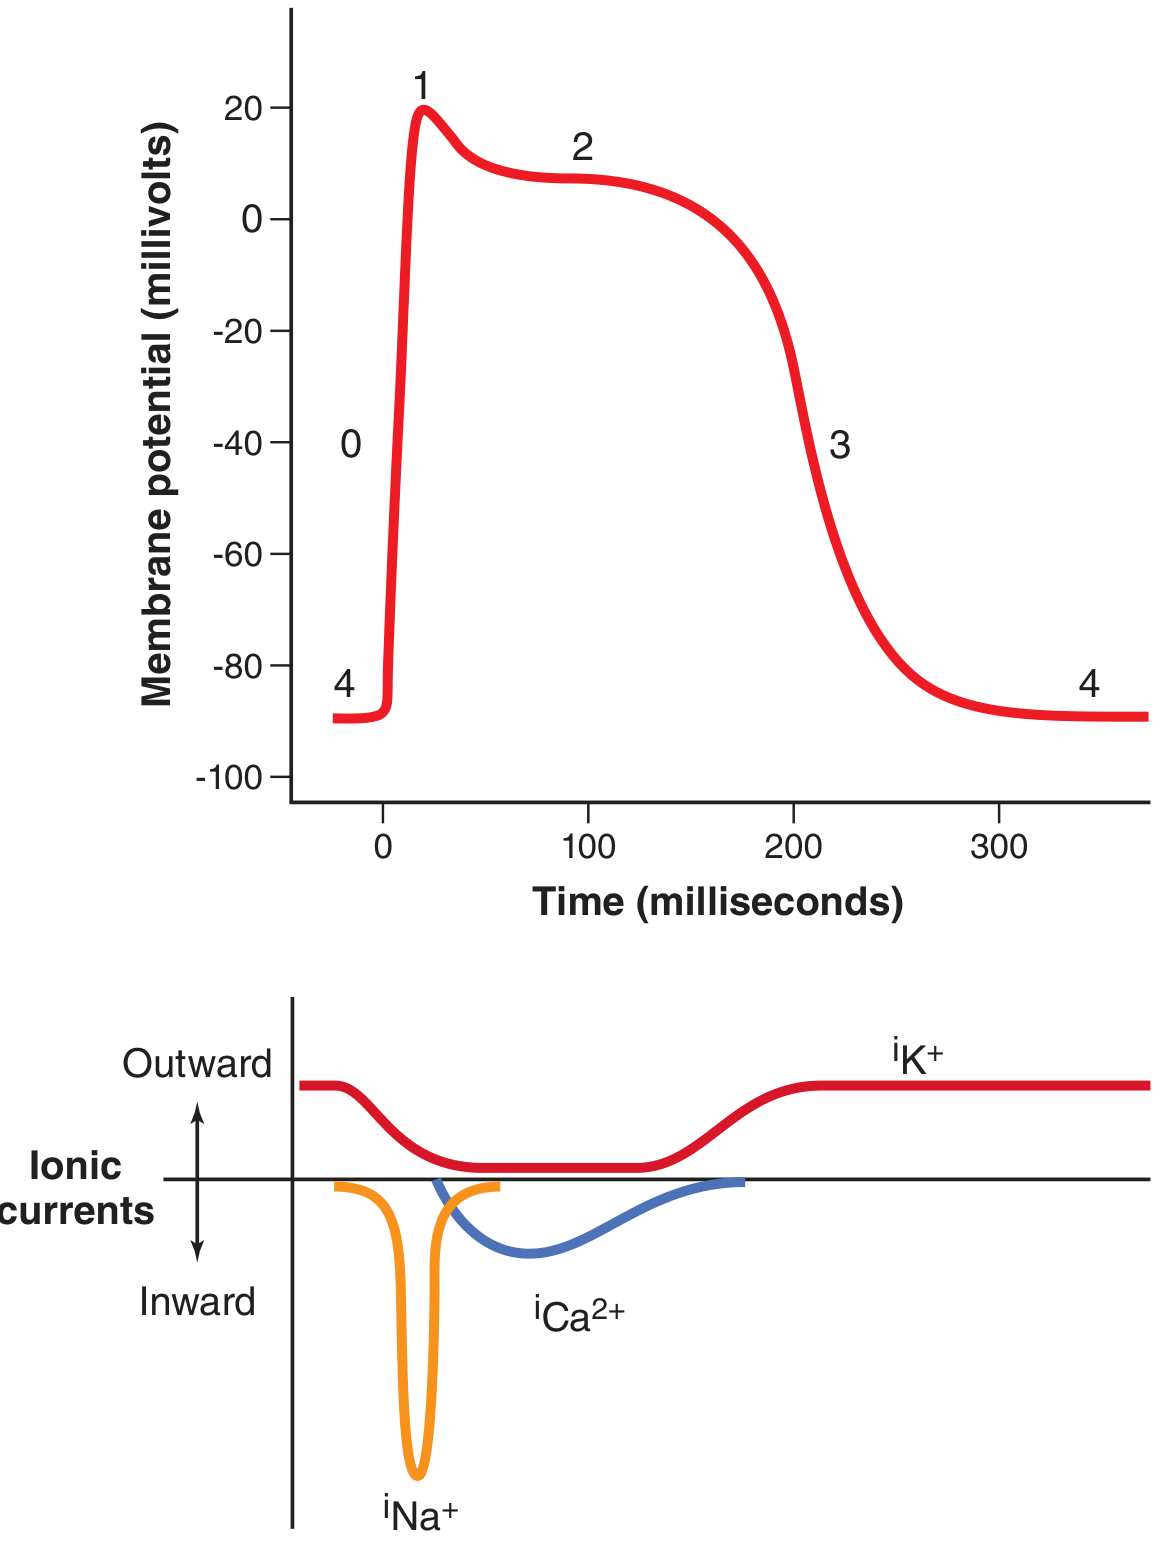
| Phase | Name | Ionic Event | mV Change |
|---|---|---|---|
| 0 | Rapid depolarization | Fast Na⁺ channels open | -85 → +20 mV |
| 1 | Initial repolarization | Fast Na⁺ channels close; K⁺ exits | +20 → ~0 mV |
| 2 | Plateau | L-type Ca²⁺ channels open (slow); K⁺ channels close | ~0 mV sustained |
| 3 | Rapid repolarization | Ca²⁺ channels close; slow K⁺ channels open | 0 → -85 mV |
| 4 | Resting potential | K⁺ leak | -85 to -90 mV |
The plateau phase (Phase 2) is unique to cardiac muscle and is critical because:
- It allows prolonged contraction for adequate stroke volume
- Ca²⁺ entry during plateau directly triggers myofilament contraction (vs. skeletal muscle which uses only SR calcium)
- It prevents tetanic summation (which would be fatal in the heart)
Comparison: Purkinje fiber vs. Ventricular muscle
4. Refractory Period
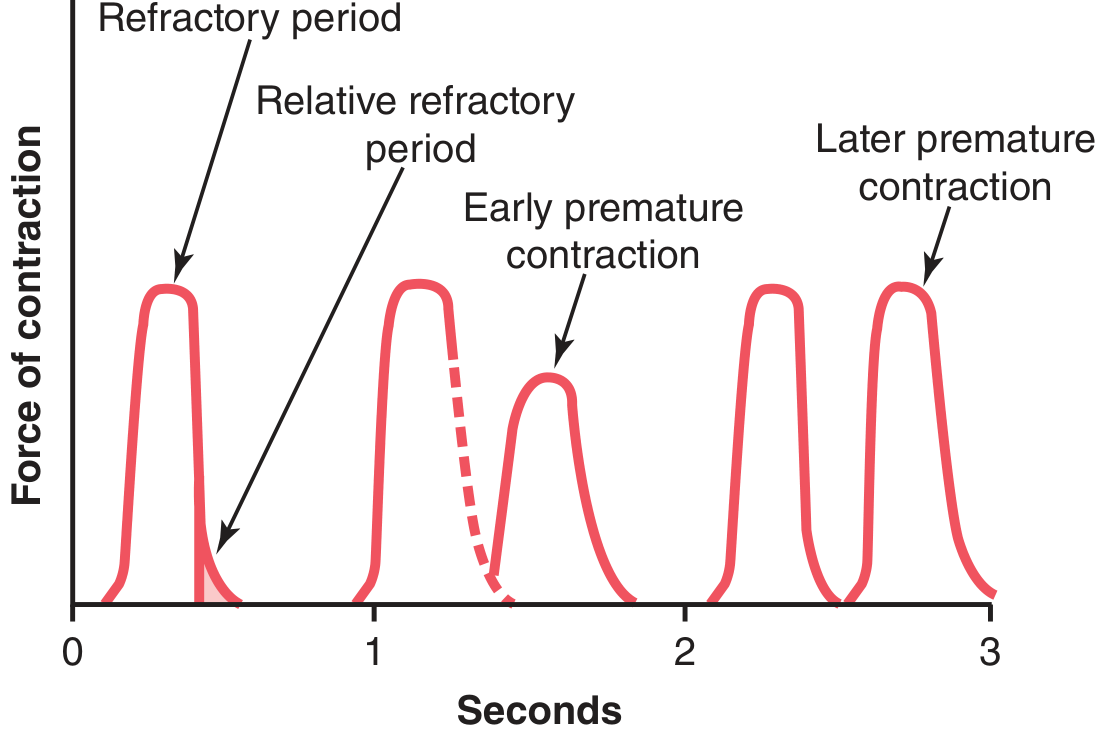
Cardiac muscle has a long refractory period (~0.25-0.30 sec), roughly matching the duration of the plateau. This means the ventricle cannot be re-stimulated while it is contracting - preventing sustained tetanus (summation), which would stop cardiac output entirely.
There is also a shorter relative refractory period (~0.05 sec) after the absolute period, during which the muscle can be excited only by a very strong stimulus (producing a weaker, premature contraction).
5. Cardiac Conduction System
The conduction system allows orderly, sequential contraction of atria then ventricles.
Sequence of activation:
- SA Node (sinoatrial node) - right atrial wall, near SVC opening. The pacemaker - fastest spontaneous depolarization rate (~60-100 bpm). Sets the rhythm for the whole heart.
- Internodal pathways - conduct impulse from SA node across the atria
- AV Node (atrioventricular node) - at junction of atria and ventricles. Introduces a 0.1-second delay allowing atria to finish emptying before ventricles contract
- Bundle of His - common pathway through the fibrous AV septum
- Left and Right Bundle Branches - travel down the interventricular septum
- Purkinje Fibers - spread impulse rapidly (4 m/sec) to all ventricular myocardium from apex upward
Key rule: Under normal conditions, the SA node dominates because it depolarizes fastest. If it fails, the AV node takes over (~40-60 bpm), then Purkinje fibers (~20-40 bpm) - these are called escape rhythms.
- Ganong's Review of Medical Physiology, p. 520
6. The Cardiac Cycle
Each complete heartbeat consists of 7 phases (Costanzo Physiology):
| Phase | Event | ECG Correlation | Valves |
|---|---|---|---|
| A - Atrial Systole | Atria contract; final filling of ventricle | P wave | Mitral/tricuspid open |
| B - Isovolumetric Ventricular Contraction | Ventricular pressure rises; no ejection yet (all valves closed) | QRS complex | Mitral closes → S1 |
| C - Rapid Ventricular Ejection | Ventricle ejects blood into aorta/pulmonary artery | ST segment | Aortic/pulmonic opens |
| D - Reduced Ventricular Ejection | Ejection slows; ventricular volume at minimum | T wave | - |
| E - Isovolumetric Ventricular Relaxation | Pressure falls; no filling yet | After T wave | Aortic closes → S2 |
| F - Rapid Ventricular Filling | Passive filling from atria | - | Mitral opens |
| G - Reduced Ventricular Filling (Diastasis) | Slow filling; little pressure change | - | Mitral open |
Heart Sounds:
- S1 ("lub") - closure of mitral and tricuspid valves at start of ventricular systole
- S2 ("dub") - closure of aortic and pulmonic valves at end of systole
- S3 - pathological (ventricular gallop in heart failure) - rapid filling phase
- S4 - atrial contraction against stiff ventricle (hypertrophy)
7. Frank-Starling Law
The Frank-Starling law states: the more the heart is filled during diastole, the stronger the subsequent contraction. Greater stretch of myocytes increases the sensitivity of troponin C to Ca²⁺ and optimizes actin-myosin overlap, producing more force.
Physiologically, this means cardiac output is largely self-regulating: if venous return increases (e.g., during exercise), the heart automatically pumps more without needing neural input. Venous return is the primary determinant of cardiac output under normal conditions.
"When increased quantities of blood flow into the heart, the increased volume of blood stretches the walls of the heart chambers and causes the cardiac muscle to contract with increased force, ejecting the extra blood." - Guyton & Hall, p. 251
8. Cardiac Output and Distribution
Cardiac output (CO) = Heart Rate × Stroke Volume
At rest: CO ≈ 5 L/min (70 bpm × ~70 mL)
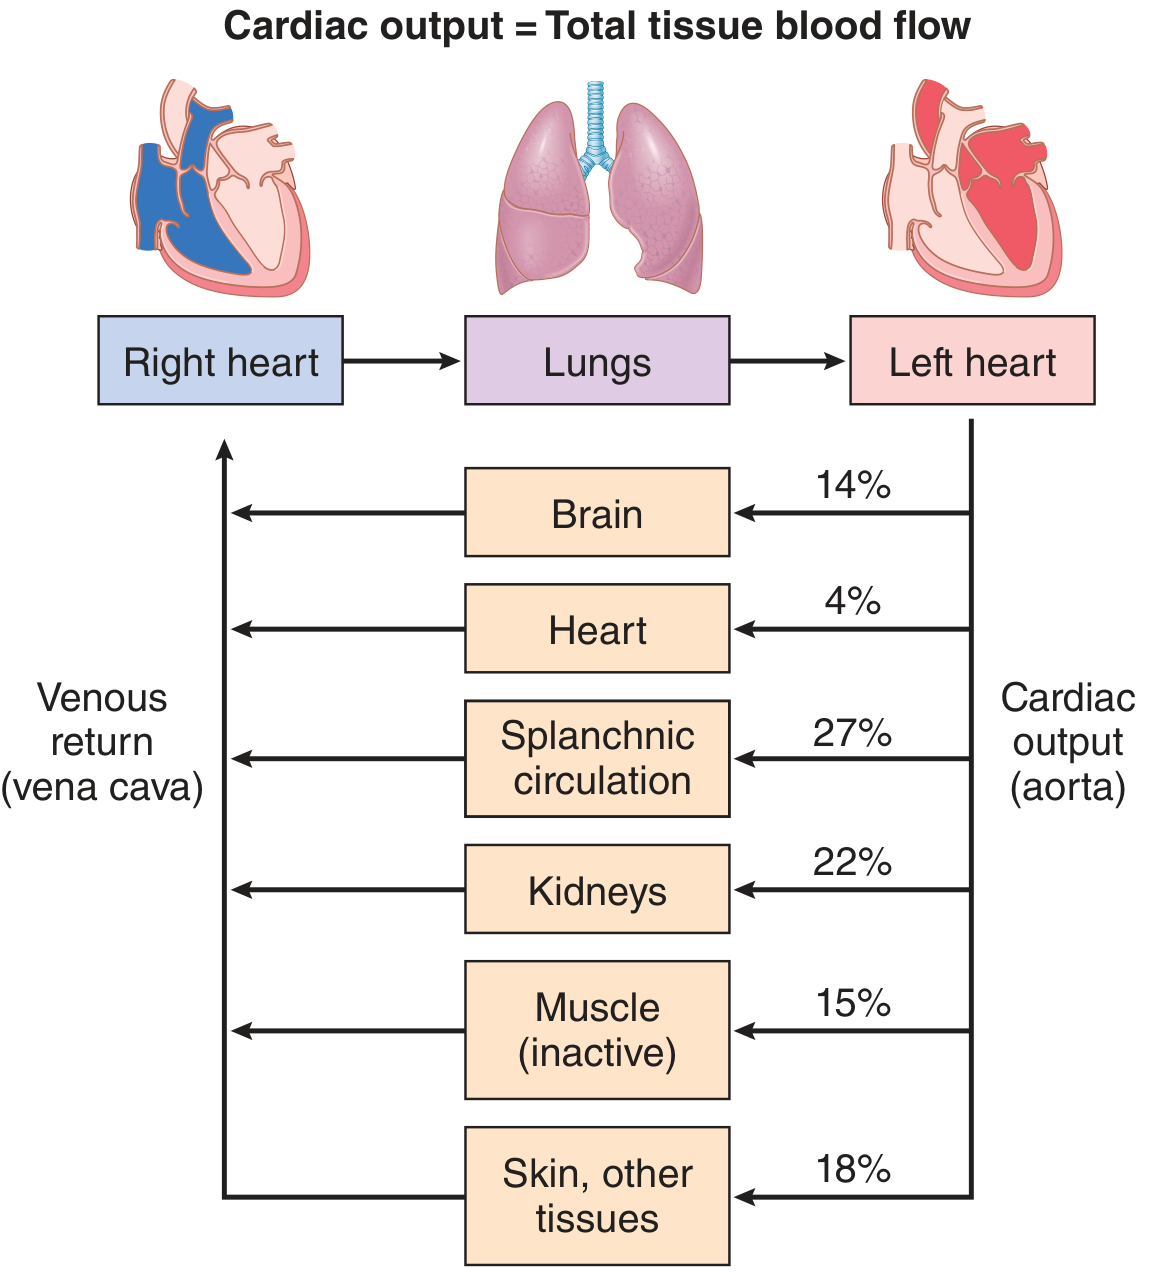
The cardiac output equals the sum of all regional blood flows in the body. At rest, the distribution is:
| Organ | % of Cardiac Output |
|---|---|
| Splanchnic (gut/liver) | 27% |
| Kidneys | 22% |
| Skeletal muscle (inactive) | 15% |
| Brain | 14% |
| Skin + other | 18% |
| Heart | 4% |
During maximal exercise, cardiac output can increase to 20-25 L/min (trained athletes: up to 35-40 L/min), primarily due to increased stroke volume and heart rate, plus massive redistribution of blood to active muscles.
Summary - Key Concepts
| Concept | Key Point |
|---|---|
| Cardiac muscle structure | Syncytium via gap junctions; striated; intercalated discs |
| Action potential | 5 phases; plateau (Phase 2) due to Ca²⁺; ~300 ms duration |
| Pacemaker | SA node: 60-100 bpm → AV node: 40-60 bpm → Purkinje: 20-40 bpm |
| Cardiac cycle | 7 phases; systole (B-D) + diastole (E-G+A) |
| Frank-Starling | Stretch → stronger contraction; auto-regulates output |
| Cardiac output | 5 L/min at rest; governed mainly by venous return |
| Refractory period | ~0.25-0.30 sec; prevents tetanus; essential for survival |
This is a shared conversation. Sign in to Orris to start your own chat.