
How does LAD and Rad effect the heart
coronary artery anatomy LAD RCA heart diagram
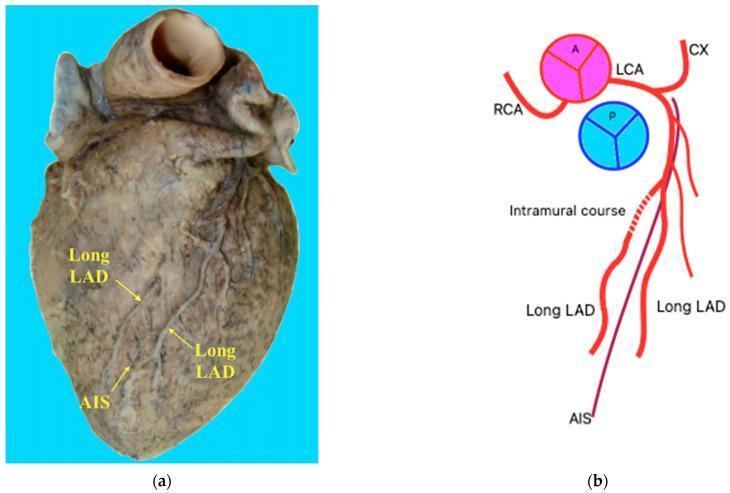
This educational image consists of a clinical photograph (a) and a schematic diagram (b) illustrating a dual left anterior descending (LAD) coronary artery variant. The photograph displays a dissected human heart specimen in the anterior view, highlighting the course of the coronary vasculature. Labeled structures include the Anterior Interventricular Sulcus (AIS) and two distinct 'Long LAD' branches descending parallel to each other. The schematic representation details the origin of these vessels from the Left Coronary Artery (LCA), alongside the Right Coronary Artery (RCA) and Circumflex Artery (CX). A critical anatomical feature demonstrated is the 'intramural course' of the right-sided LAD branch, where a portion of the vessel is embedded within the myocardium (myocardial bridge) before resurfacing. This variant is clinically significant for cardiothoracic surgery and interventional cardiology, as it represents a deviation from standard coronary anatomy (specifically resembling Pellegrini Type XIII) that can impact diagnostic interpretation and surgical planning for revascularization.
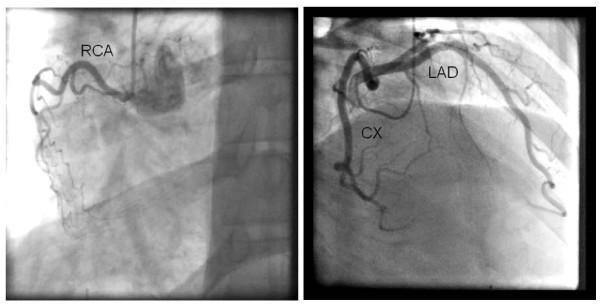
This diagnostic coronary angiogram consists of two panels demonstrating the anatomy of the coronary arterial tree. The left panel shows a hypoplastic right coronary artery (RCA), characterized by its small caliber and limited distal distribution. The right panel displays the left coronary system, including the left anterior descending (LAD) and circumflex (CX) arteries. The images reveal a left-dominant coronary circulation pattern, where the circumflex artery provides the primary blood supply to the posterior aspect of the heart. A notable finding is the marked tortuosity of the epicardial vessels, a feature often associated with chronic hypertension and arterial remodeling. Despite the tortuous course, there is no evidence of hemodynamically significant obstructive stenoses in the epicardial segments of the LAD, CX, or RCA. This study illustrates non-obstructive coronary artery disease in a patient with left-dominant anatomy and vessel tortuosity.
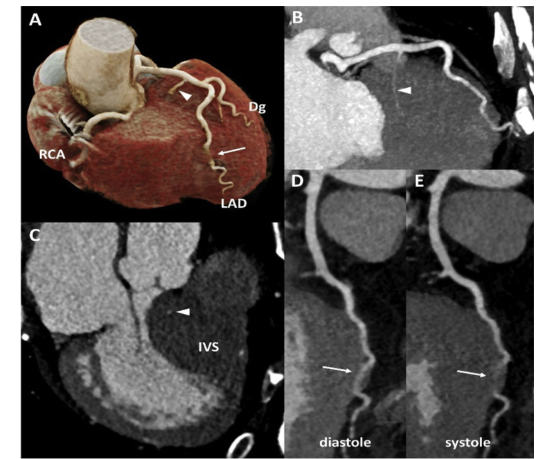
Summary : This figure presents multiple cardiac CT images illustrating the anatomy and course of the coronary arteries, with specific attention to the left anterior descending artery (LAD), right coronary artery (RCA), and their relationship to the interventricular septum (IVS) during different phases of the cardiac cycle. photo: # Cardiac Anatomy Overview : • Panel A shows a 3D reconstructed cardiac CT image highlighting the RCA, LAD, and a diagonal branch (Dg). • The LAD is traced along the anterior surface of the heart, with a white arrow indicating its course. • The RCA is visible on the right side of the heart. • A white arrowhead marks a specific anatomical point on the LAD. # Coronary Artery Course : • Panel B displays a curved multiplanar reconstruction of the LAD, with a white arrowhead indicating a notable segment. • The LAD is seen running along the anterior interventricular groove. # Interventricular Septum (IVS) Relationship : • Panel C shows a cross-sectional CT image of the heart, with the IVS labeled. • The white arrowhead points to the LAD as it courses over the IVS. # Cardiac Cycle Phases : • Panels D and E compare the LAD's appearance during diastole and systole. • Both panels show the LAD (white arrows) in similar anatomical positions, but the surrounding cardiac structures differ due to the phase of the cardiac cycle. # Technical Details : • Images are grayscale except for the 3D reconstruction in panel A, which uses color to differentiate anatomical structures. • No scale bars or magnification details are provided. • Labels include RCA (right coronary artery), LAD (left anterior descending artery), Dg (diagonal branch), and IVS (interventricular septum). # Spatial Relationships : • The LAD is consistently shown on the anterior surface of the heart, running parallel to the IVS. • The RCA is positioned on the right side of the heart. • The anatomical course of the LAD is compared across different imaging planes and cardiac phases. # Analysis : • The figure demonstrates the anatomical course of the LAD and its relationship to the IVS, as well as the consistency of its position during diastole and systole. • The use of multiple imaging planes and 3D reconstruction provides a comprehensive view of coronary artery anatomy. • No obvious anomalies or pathologies are visible in the presented images.
LAD and RCA - Effects on the Heart
Note: I'm assuming "Rad" refers to the RCA (Right Coronary Artery). If you meant something else (e.g., radiation therapy), let me know!
Overview: The Two Main Coronary Arteries
The LAD (Left Anterior Descending Artery)
- Diagonal branches - supply the anterior surface of the left ventricle
- Septal perforating branches - supply the anterior 2/3 of the interventricular septum
- Most of the left atrium and left ventricle
- The anterior 2/3 of the interventricular septum
- The AV bundle (bundle of His) and its branches
- Part of the right ventricle at the sternocostal surface
| Occlusion Site | Effect |
|---|---|
| Proximal LAD | Anterior/anteroseptal STEMI - large territory at risk (V1-V4 changes on ECG); often called the "widow maker" |
| Mid/distal LAD | Anterior MI, smaller territory |
| Proximal LAD with aVR STE | May indicate left main disease |
| Proximal LAD (de Winter pattern) | J-point depression + tall T waves in precordials - STEMI equivalent |
- Large anterior wall MI
- Bundle branch blocks (especially LBBB)
- Cardiogenic shock due to massive LV dysfunction
- Ventricular arrhythmias
The RCA (Right Coronary Artery)
- SA nodal branch - to the sinoatrial node (in ~60% of people)
- Right marginal branch - along the inferior margin toward the apex
- AV nodal branch - supplies the atrioventricular node
- Posterior interventricular artery (posterior descending artery / PDA) - in right-dominant circulation (~67% of people)
- Right atrium and right ventricle
- SA node (in most people)
- AV node (in most people)
- Posterior 1/3 of the interventricular septum
- Posteroinferior part of the left ventricle
| Occlusion Site | Effect |
|---|---|
| Proximal RCA | Inferior STEMI (ST elevation in II, III, aVF) + right ventricular infarction |
| RCA before acute marginal branch | RV infarction in ~30% of cases |
| AV nodal branch | Heart block (1st, 2nd, or 3rd degree) - often reversible |
| SA nodal branch | Sinus bradycardia, sick sinus syndrome |
- Right ventricular infarction - leads to hypotension, elevated JVP, and sensitivity to preload (nitroglycerin and diuretics can cause catastrophic hypotension)
- AV block - because the AV node loses its blood supply
- Sinus bradycardia due to SA node ischemia
Side-by-Side Summary
| Feature | LAD | RCA |
|---|---|---|
| Origin | Left coronary artery | Right aortic sinus directly |
| Runs in | Anterior interventricular sulcus | Coronary sulcus (right side) then posterior |
| Main territory | Anterior LV, anterior septum, apex | RV, SA/AV nodes, posterior LV, posterior septum |
| MI territory | Anterior/anteroseptal (V1-V4) | Inferior (II, III, aVF) |
| Conduction risk | Bundle branch blocks | AV block, sinus bradycardia |
| Special danger | "Widow maker" - cardiogenic shock | RV infarction, hemodynamic compromise |
| Dominance note | Always major | Dominant (gives PDA) in ~67% of people |
Coronary Artery Distribution Diagram
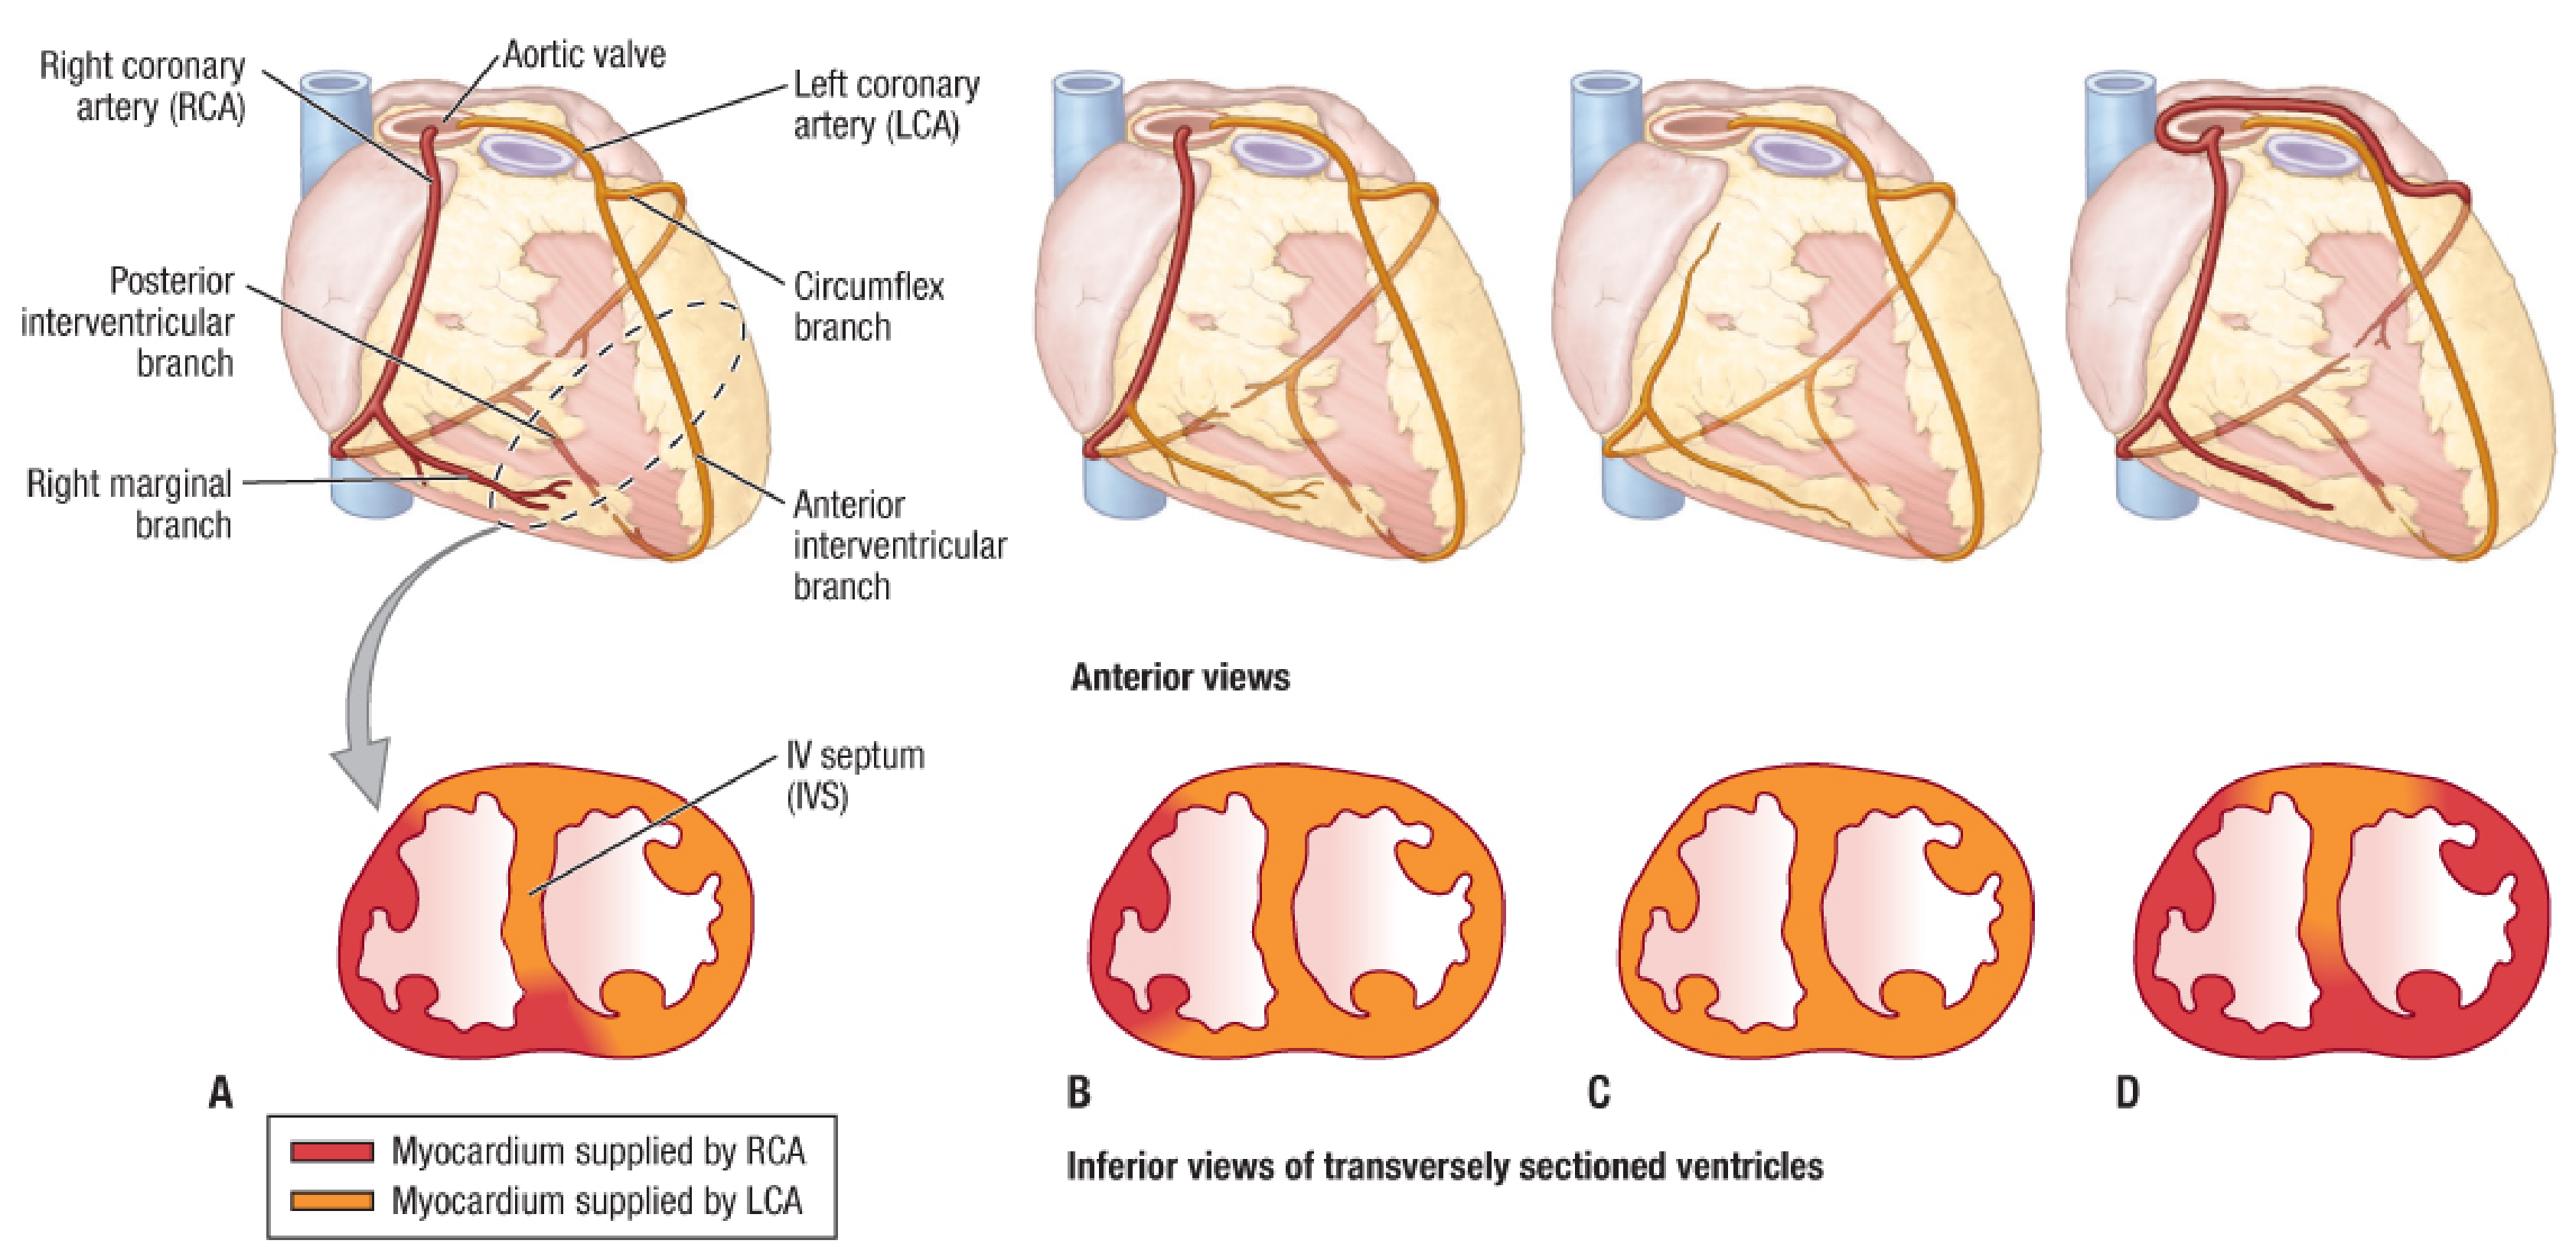
- Gray's Anatomy for Students - Coronary arteries section, pp. 237-239
- Color Atlas of Human Anatomy, Vol. 2 - Cardiac blood vessels, p. 58
- Fischer's Mastery of Surgery, 8th ed. - Left/Right Coronary Artery
- Rosen's Emergency Medicine - Anatomic Location of Acute Myocardial Infarction
- Tintinalli's Emergency Medicine - Electrocardiography, Right Ventricular Infarction
I meant left axis deviation and right axis deviation mechanical changes on heart
left axis deviation right axis deviation ECG causes diagram
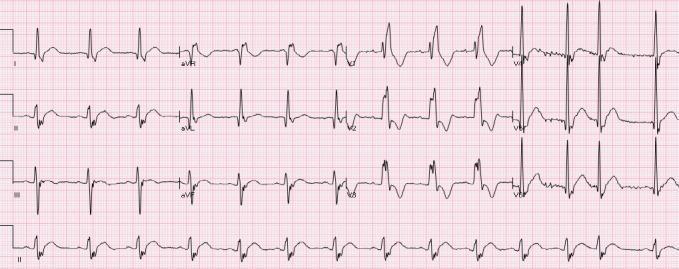
This diagnostic image is a 12-lead electrocardiogram (ECG) demonstrating a combination of conduction abnormalities and ST-segment deviations. The ECG shows a widened QRS complex with an rSR' pattern in the right precordial leads (V1-V3), characteristic of a Right Bundle Branch Block (RBBB). Concomitant left axis deviation is present, indicative of a Left Anterior Fascicular Block (LAFB), together forming a bifascicular block pattern. Notably, there is mild, diffuse ST-segment elevation (STE) visible in the lateral leads (I, aVL, V4-V6) and inferior leads (II, aVF). In the clinical context of non-ischemic dilated cardiomyopathy with negative cardiac biomarkers, these ST-segment changes represent a chronic, non-ischemic ST-elevation (NISTE) pattern rather than acute myocardial infarction. The ST segments appear relatively stable and are associated with secondary repolarization changes from the intraventricular conduction delay. This tracing serves as an educational example of how baseline conduction defects and cardiomyopathy can simulate or mask ischemic patterns, emphasizing the importance of clinical correlation and comparison with prior ECGs in diagnosis.
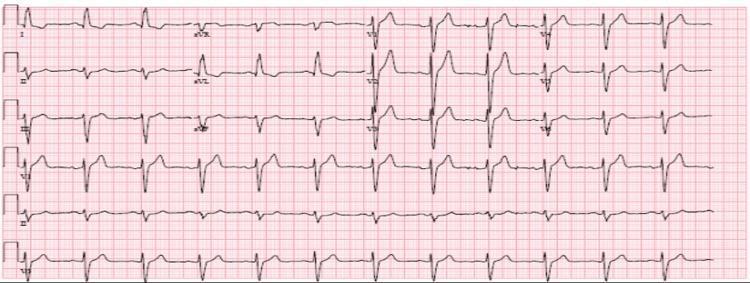
This diagnostic image is a 12-lead electrocardiogram (ECG) demonstrating a sinus rhythm with features characteristic of left ventricular hypertrophy (LVH) and left axis deviation. The limb leads show a predominantly positive QRS complex in Lead I and a predominantly negative QRS complex in Lead aVF, consistent with left axis deviation. In the precordial leads (V1-V6), there is evidence of voltage criteria for LVH, specifically high-amplitude R-waves in the lateral leads (V5 and V6) and deep S-waves in the right precordial leads (V1 and V2). The ST segments and T waves are generally unremarkable across most leads, though there is a slight ST depression and T-wave inversion in the lateral leads, which can be associated with an LVH strain pattern. This tracing serves as an educational example of cardiac remodeling secondary to chronic hypertension or renal disease in a preoperative clinical context.
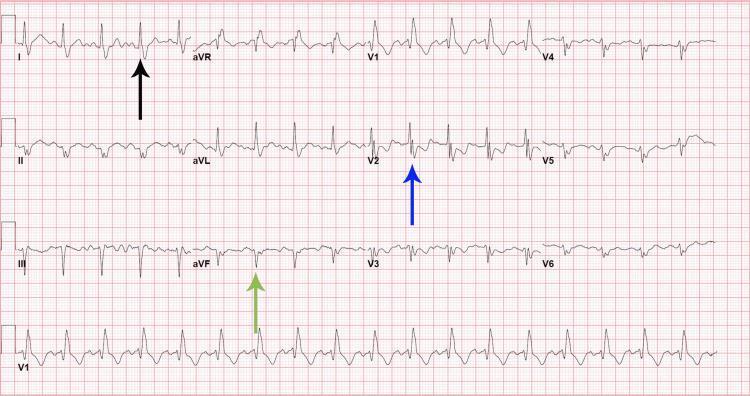
A standard 12-lead electrocardiogram (ECG) displayed on a pink grid background, illustrating bifascicular block findings. The tracing reveals sinus tachycardia with a marked left axis deviation, characterized by a predominantly positive QRS complex in lead I (black arrow) and a negative QRS deflection in lead aVF (green arrow). The precordial leads show classic morphology for a right bundle branch block (RBBB), specifically highlighting an rsR' pattern in lead V2 (blue arrow). Combined, the left axis deviation (suggestive of left anterior fascicular block) and the RBBB findings constitute a bifascicular block. The image provides clinical teaching value for identifying intraventricular conduction delays and cardiac axis abnormalities in an acute clinical setting.
Left Axis Deviation (LAD) and Right Axis Deviation (RAD) - Mechanical Changes on the Heart
What is the QRS Axis?
- Normal axis: -30° to +90°/+100°
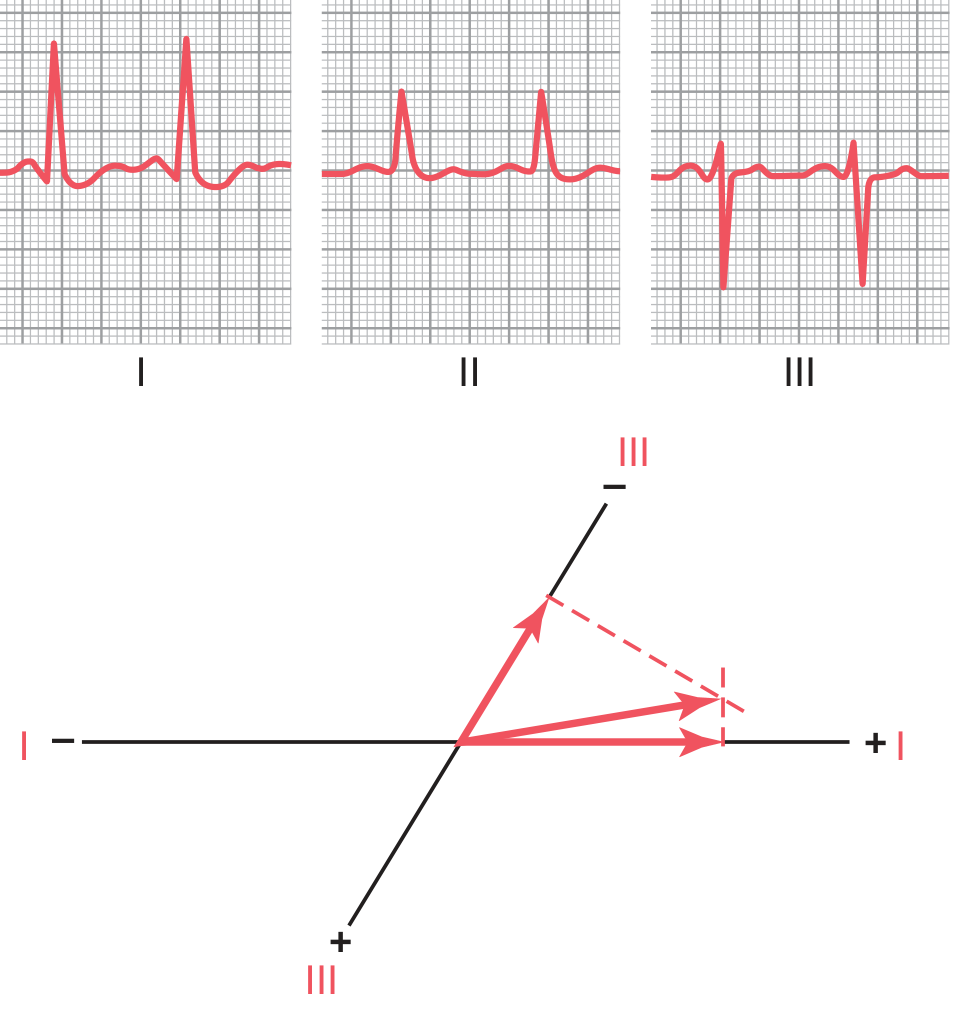
- Left axis deviation (LAD): more negative than -30°
- Right axis deviation (RAD): more positive than +90° to +100°
Left Axis Deviation (LAD) - Mechanical Causes
1. Left Ventricular Hypertrophy (LVH) - Most Common Structural Cause
- More muscle mass on the left generates greater electrical potential
- The hypertrophied LV takes longer to depolarize than the right ventricle
- The result: the mean QRS vector is dragged toward the left and superiorly, causing LAD
- Hypertension (chronic pressure overload forces LV to enlarge)
- Aortic stenosis (LV pumps against high outflow resistance)
- Aortic regurgitation (volume overload stretches and hypertrophies LV)
- Congenital conditions with LV enlargement
2. Left Anterior Fascicular Block (LAFB) - Most Common Cause of Marked LAD
- Depolarization of the anterior LV is delayed and takes an abnormal inferior-to-superior route
- This swings the mean vector superiorly and to the left (axis more negative than -45°)
- No significant ventricular muscle is lost - this is a conduction rather than structural problem, but it often coexists with underlying LV disease
3. Inferior MI
- Necrosis of the inferior LV wall removes electrical potential from the inferior region
- The surviving superior/lateral LV depolarization now dominates
- The mean vector shifts upward and leftward - producing LAD
- A dead (infarcted) area contributes no electrical force, so the opposite wall's vector wins
4. Other Causes of LAD
| Cause | Mechanical Basis |
|---|---|
| Left bundle branch block (LBBB) | LV depolarized late via abnormal pathway |
| Wolff-Parkinson-White (WPW) | Bypass tract pre-excites part of ventricle |
| Ventricular pacing | Abnormal depolarization sequence |
| Primum ASD | Abnormal septal activation |
| Obesity / pregnancy | Heart displaced superiorly (positional) |
Right Axis Deviation (RAD) - Mechanical Causes
1. Right Ventricular Hypertrophy (RVH) - Core Structural Cause
- Greater RV muscle mass generates more electrical potential on the right
- RV takes longer to depolarize
- The mean QRS vector swings rightward and inferiorly - producing RAD
- Pulmonary hypertension (chronic or acute) - RV must pump against high pulmonary resistance, leading to pressure hypertrophy
- Cor pulmonale - from COPD, pulmonary fibrosis, etc.
- Pulmonary valve stenosis - RV pressure overload
- Tetralogy of Fallot - congenital RV outflow obstruction
- Atrial septal defect (secundum ASD) - chronic RV volume overload
- Ventricular septal defect (VSD) - RV pressure/volume overload
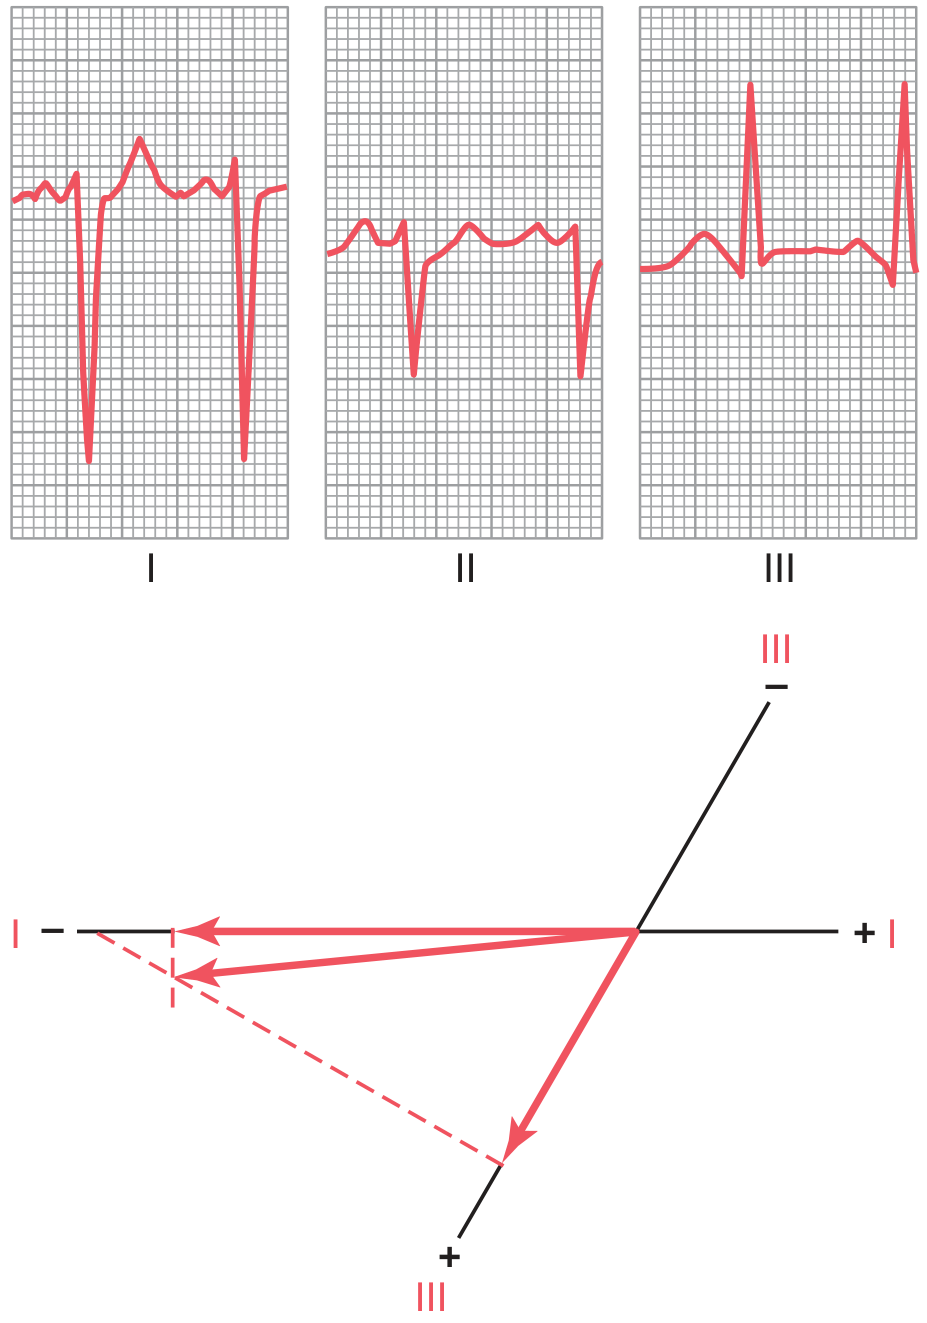
2. Pulmonary Embolism (Acute Cor Pulmonale)
- Acute massive PE suddenly raises pulmonary vascular resistance
- RV acutely dilates (not hypertrophies) under sudden pressure overload
- RAD appears acutely, along with the classic S1Q3T3 pattern
- This is a functional/hemodynamic change rather than a structural one, but the mechanism is the same
3. Left Posterior Fascicular Block (LPFB)
- The posterior fascicle activates the inferoposterior LV wall
- When blocked, the anterior fascicle activates first (superiorly), then depolarization spreads inferoposteriorly later
- Mean vector shifts rightward and inferiorly
- RAD > +110-120°
- Very rare in isolation - must exclude RVH, lateral MI, and other RAD causes before diagnosing LPFB
4. Other Causes of RAD
| Cause | Mechanical Basis |
|---|---|
| Lateral MI | Loss of lateral LV forces, right-dominant vector |
| Dextrocardia | Heart is mirror-imaged to the right |
| Left pneumothorax | Heart shifts rightward |
| Neonates/young children | Normal - RV mass exceeds LV at birth |
| Right bundle branch block (RBBB) | Delayed RV depolarization pulls axis rightward |
Side-by-Side Summary
| Feature | Left Axis Deviation | Right Axis Deviation |
|---|---|---|
| Axis range | More negative than -30° | More positive than +90-100° |
| Primary structural cause | LV hypertrophy | RV hypertrophy |
| Primary conduction cause | Left anterior fascicular block | Left posterior fascicular block |
| Infarction cause | Inferior MI | Lateral MI |
| Key diseases | Hypertension, aortic stenosis, LBBB | Pulmonary hypertension, PE, COPD, tetralogy |
| ECG appearance | Tall R in I, deep S in III | Deep S in I, tall R in III |
| Mechanical principle | LV mass/conduction dominates | RV mass/conduction dominates |
- Guyton and Hall Textbook of Medical Physiology - Abnormal Ventricular Conditions That Cause Axis Deviation (pp. 156-157)
- Harrison's Principles of Internal Medicine, 22E - QRS Complex; Bundle Branch Blocks and Related Patterns
- Goldman-Cecil Medicine - Approach to Interpreting the ECG; Intraventricular Blocks
- Rosen's Emergency Medicine - Electrocardiography