
Co2 dissociation curve with graph explain
Reading File
Finding Sources
Finding Sources
Reading File
Reading File
Reading File
Loading Image
Loading Image
Loading Image
Reading File
Loading Image
Reading File
I now have everything I need for a comprehensive, well-illustrated answer. Let me compose it.
CO₂ Dissociation Curve
What It Is
The CO₂ dissociation curve plots the total CO₂ content of blood (in all forms) on the Y-axis against the partial pressure of CO₂ (PCO₂) on the X-axis. It describes how blood picks up CO₂ at the tissues and releases it at the lungs.
Graph 1 - The Basic CO₂ Dissociation Curve
From Guyton and Hall Textbook of Medical Physiology:
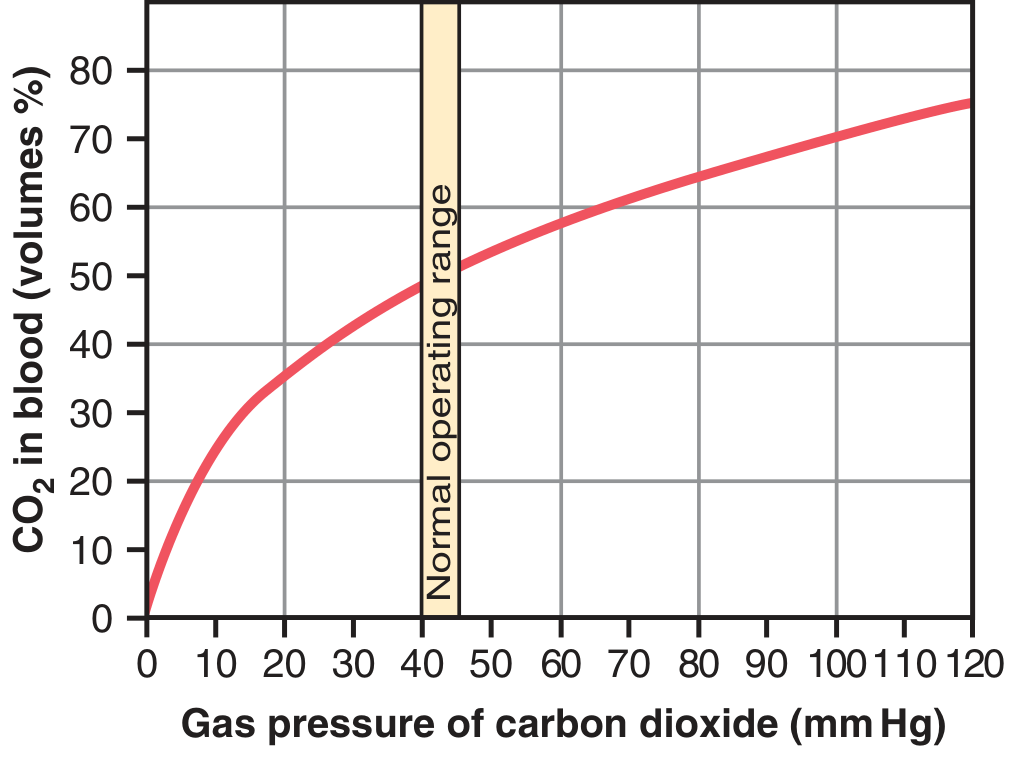
Key features of this curve:
- The curve rises steeply at low PCO₂ values and flattens at high values (it is not sigmoidal like the O₂ curve, but more hyperbolic/linear in the physiologic range)
- Normal arterial PCO₂ = 40 mm Hg → ~48 vol% CO₂ in blood
- Normal venous PCO₂ = 45 mm Hg → ~52 vol% CO₂ in blood
- Only 4 vol% of CO₂ is exchanged during one pass (tissues → lungs), even though total blood CO₂ is ~50 vol%
Compared to the O₂ dissociation curve, the CO₂ curve is much steeper and more linear in the physiologic working range, meaning small changes in PCO₂ produce relatively large changes in CO₂ content. - Murray & Nadel's Textbook of Respiratory Medicine
Graph 2 - CO₂ Dissociation Curve Showing All Three Forms
From Morgan & Mikhail's Clinical Anesthesiology (based on Nunn's Applied Respiratory Physiology):
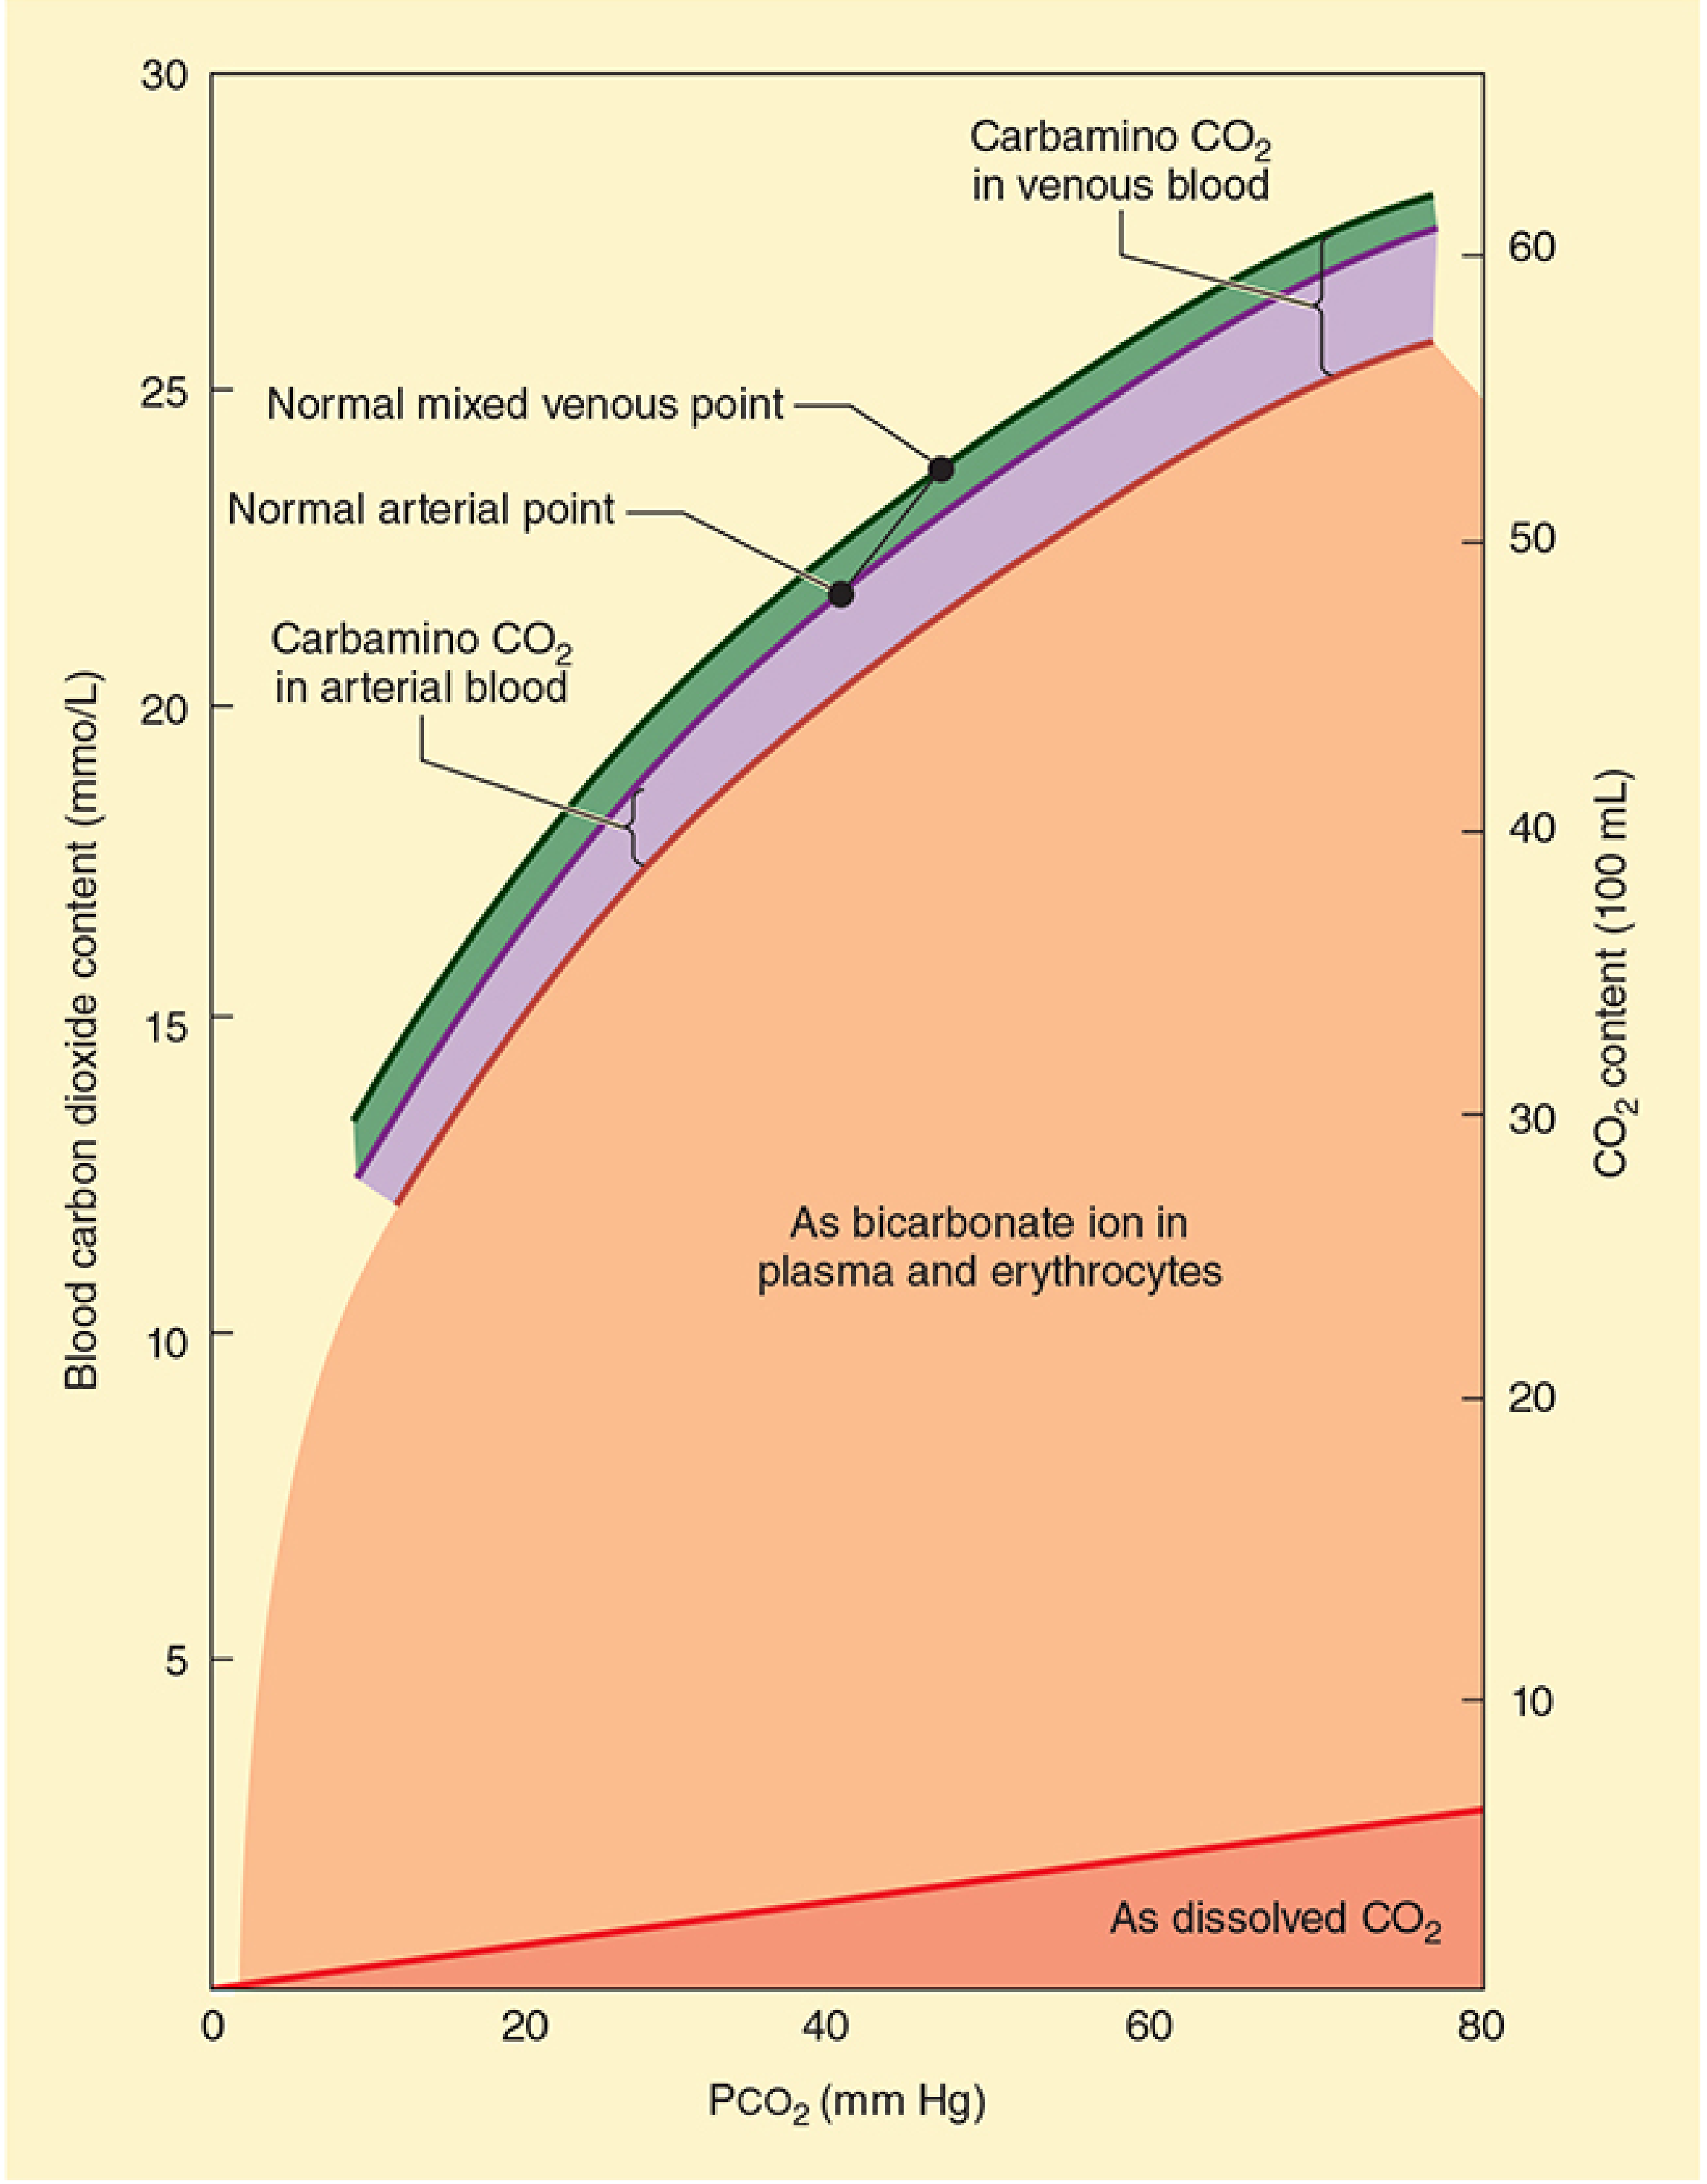
This graph shows the three forms of CO₂ transport that make up the total CO₂ content:
| Form | Contribution | Mechanism |
|---|---|---|
| Bicarbonate (HCO₃⁻) | ~70% | CO₂ + H₂O → H₂CO₃ → H⁺ + HCO₃⁻ (catalyzed by carbonic anhydrase in RBCs); HCO₃⁻ exits RBC via chloride shift |
| Carbaminohemoglobin | ~20-30% | CO₂ binds directly to amine groups on Hb (and plasma proteins); loose bond, easily released at lungs |
| Dissolved CO₂ | ~5-10% | Physically dissolved in plasma; directly proportional to PCO₂ |
- The large orange area = bicarbonate (dominant form)
- The green/purple band at the top = carbamino CO₂ (venous vs. arterial difference)
- The thin red line at the bottom = dissolved CO₂
- Normal arterial point = PCO₂ 40 mm Hg, ~22 mmol/L
- Normal mixed venous point = PCO₂ 45 mm Hg, ~24 mmol/L
Graph 3 - Effect of Oxygen Saturation (Haldane Effect)
From Murray & Nadel's Textbook of Respiratory Medicine:
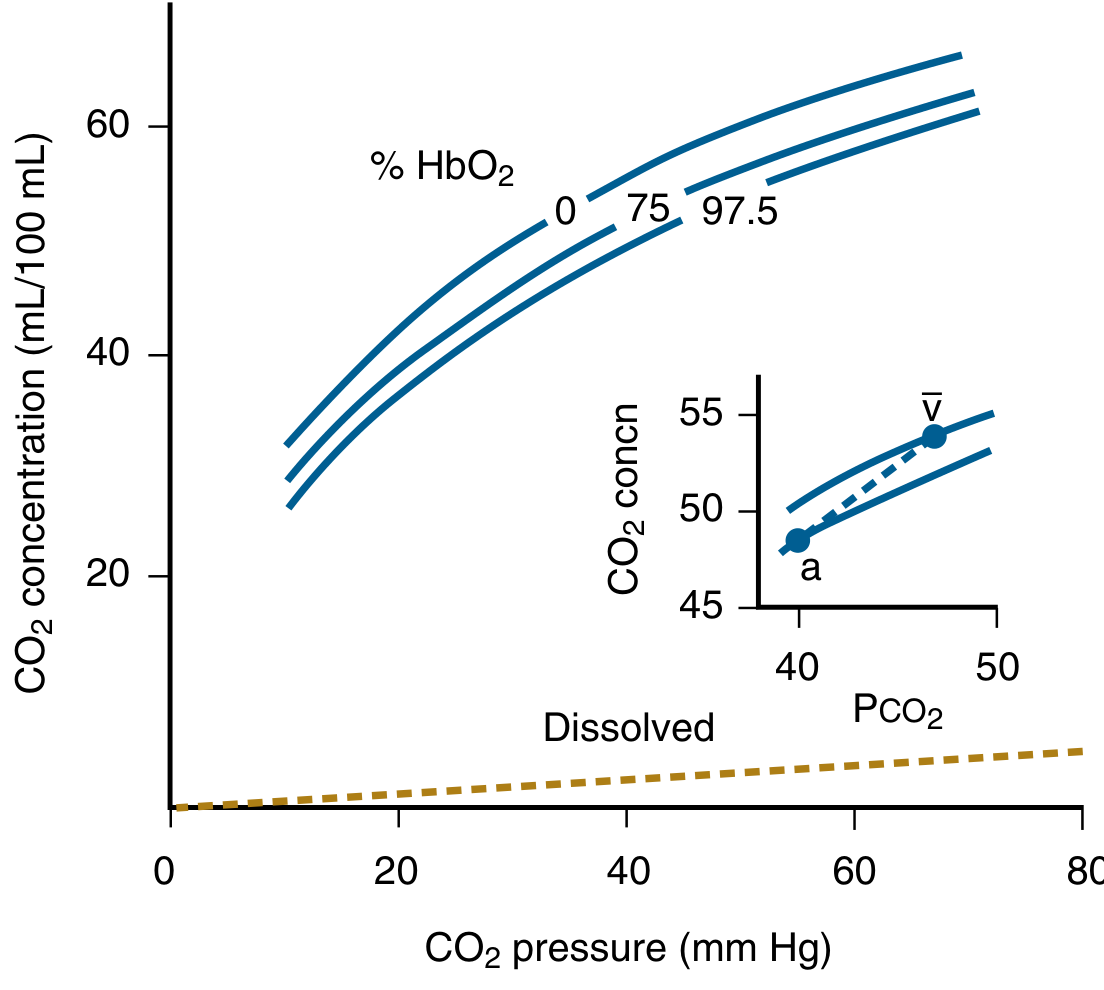
This graph shows that the CO₂ dissociation curve shifts upward when hemoglobin is less saturated with O₂ - this is the Haldane Effect.
Graph 4 - The Haldane Effect Explained
From Guyton and Hall:
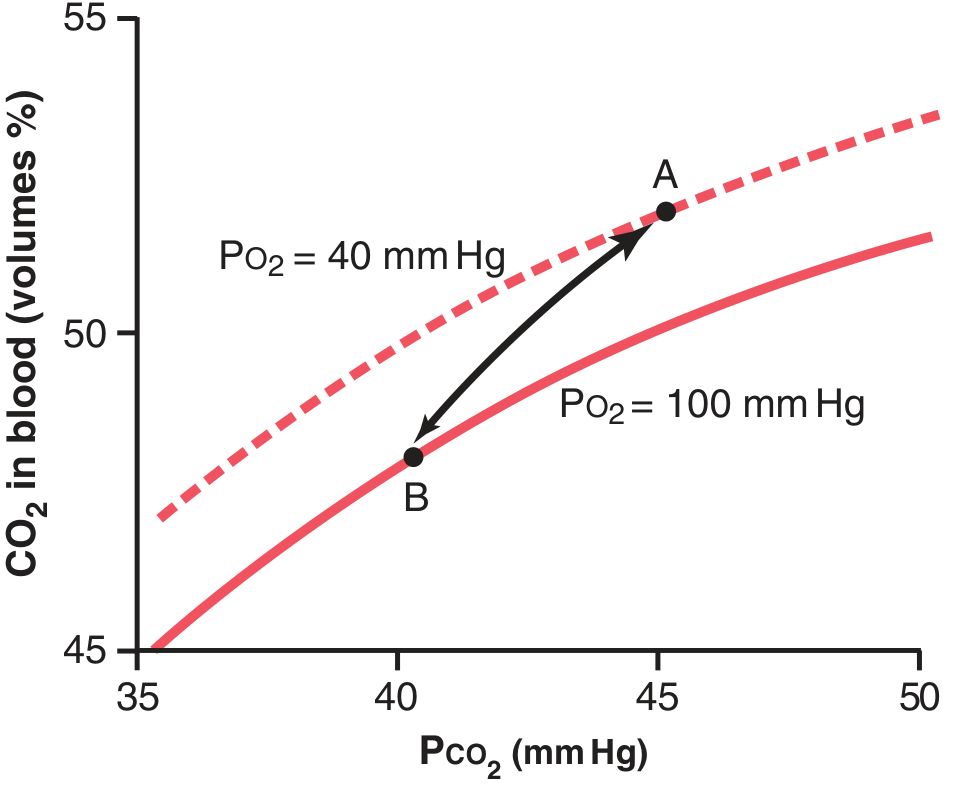
The Haldane Effect
- Point A (tissues): PCO₂ = 45 mm Hg, PO₂ = 40 mm Hg → 52 vol% CO₂ in blood
- Point B (lungs): PCO₂ = 40 mm Hg, PO₂ = 100 mm Hg → 48 vol% CO₂ in blood
- When O₂ binds Hb in the lungs, Hb becomes a stronger acid → this:
- Reduces Hb's affinity for CO₂ as carbamate → displaces carbamino CO₂
- Releases H⁺ → H⁺ + HCO₃⁻ → H₂CO₃ → CO₂ + H₂O → CO₂ driven out
- Without the Haldane effect, only ~2 vol% CO₂ would be released in lungs; with it, ~4 vol% is released - the effect doubles CO₂ transport
Key Differences: CO₂ vs. O₂ Dissociation Curve
| Feature | CO₂ Curve | O₂ Curve |
|---|---|---|
| Shape | Hyperbolic / nearly linear in physiol. range | Sigmoidal (S-shaped) |
| Steepness | Much steeper | Less steep |
| Arterial-venous difference (content) | Small (~4 vol%) despite small ΔP | Large despite similar ΔP |
| Arterial-venous ΔP | Small (40 → 45 mm Hg) | Large (100 → 40 mm Hg) |
| Effect of O₂ on curve | Haldane effect (O₂ shifts curve down) | Bohr effect (CO₂ shifts curve right) |
| Primary transport form | Bicarbonate (~70%) | Oxyhemoglobin (~97%) |
Clinical Relevance
- The steepness of the CO₂ curve in the physiologic range means that small changes in ventilation (PCO₂) produce large changes in CO₂ content - this is why hypercapnia develops quickly in hypoventilation
- Acetazolamide (carbonic anhydrase inhibitor) impairs CO₂ transport, causing tissue PCO₂ to rise to ~80 mm Hg; used in altitude sickness to stimulate breathing
- Arterial pH changes minimally (7.41 arterial → 7.37 venous) despite CO₂ loading at tissues, because bicarbonate acts as a buffer
- CO₂ stores in the body are large (~120 L in adults), so a new CO₂ equilibrium after ventilation changes takes 20-30 minutes (vs. <5 min for O₂)
Sources: Guyton and Hall Textbook of Medical Physiology, p. 529-530 | Morgan & Mikhail's Clinical Anesthesiology, 7e, p. 970 | Murray & Nadel's Textbook of Respiratory Medicine, p. 305-306 | Fishman's Pulmonary Diseases and Disorders, p. 258
Make a short note pdf for fmge, usmle explain it
Your credits are exhausted. You can purchase a top-up or subscribe to a plan to continue using Orris. If you're already subscribed, your daily credits will reset tomorrow.
This is a shared conversation. Sign in to Orris to start your own chat.