
Swd definition
SWD short wave diathermy definition physiotherapy
SWD - Short Wave Diathermy
How It Works
- Electromagnetic waves generate both an electrical field and a magnetic field that penetrate tissues
- These fields cause increased molecular vibration, rotation, and ionic movement, producing deep tissue heating
- Tissue temperatures can reach 40°C to 45°C therapeutically
- Heat penetrates deeply enough to reach muscles, joints, and soft tissues without overheating the skin
Two Modes of Application
| Mode | Effect | Tissue Temperature |
|---|---|---|
| Continuous SWD | Thermal | Significant heat generation (40-45°C) |
| Pulsed SWD | Non-thermal (athermal) | Minimal heat; used for biological/cellular effects |
Physiological Effects
- Increased local blood flow and vasodilation
- Muscle relaxation and reduced spasm
- Decreased joint stiffness
- Analgesic (pain-relieving) effect
- Promotes healing in chronic inflammatory conditions
Clinical Uses
- Osteoarthritis, rheumatoid arthritis
- Frozen shoulder, tendinitis
- Ankle sprains, ligament injuries
- Sciatica, disc disease
- Post-traumatic and post-operative pain
Key Contraindications
- Metal implants in the treatment area
- Pacemakers or implanted electronic devices (including VNS - as noted in [Kaplan & Sadock's Comprehensive Textbook of Psychiatry])
- Malignancy, pregnancy, active infection
- Impaired sensation
Diagram how it works
A clear educational diagram showing how Short Wave Diathermy (SWD) works in physiotherapy. Show a patient lying on a treatment table with two electrode plates placed on either side of a body part (e.g. knee or shoulder). Illustrate electromagnetic waves at 27.12 MHz radiating from the machine through the electrodes into the deep tissues. Use labeled arrows to show: the SWD machine/generator, the electrode plates, electromagnetic field penetrating skin, subcutaneous tissue, muscle, and joint. Include a side panel showing the two modes: Continuous SWD (thermal effect, 40-45°C deep heat) and Pulsed SWD (non-thermal/athermal effect). Show molecular vibration and ion movement in tissue as the mechanism of heat generation. Use a clean medical illustration style with anatomical cross-section of tissue layers. Label all key components clearly.
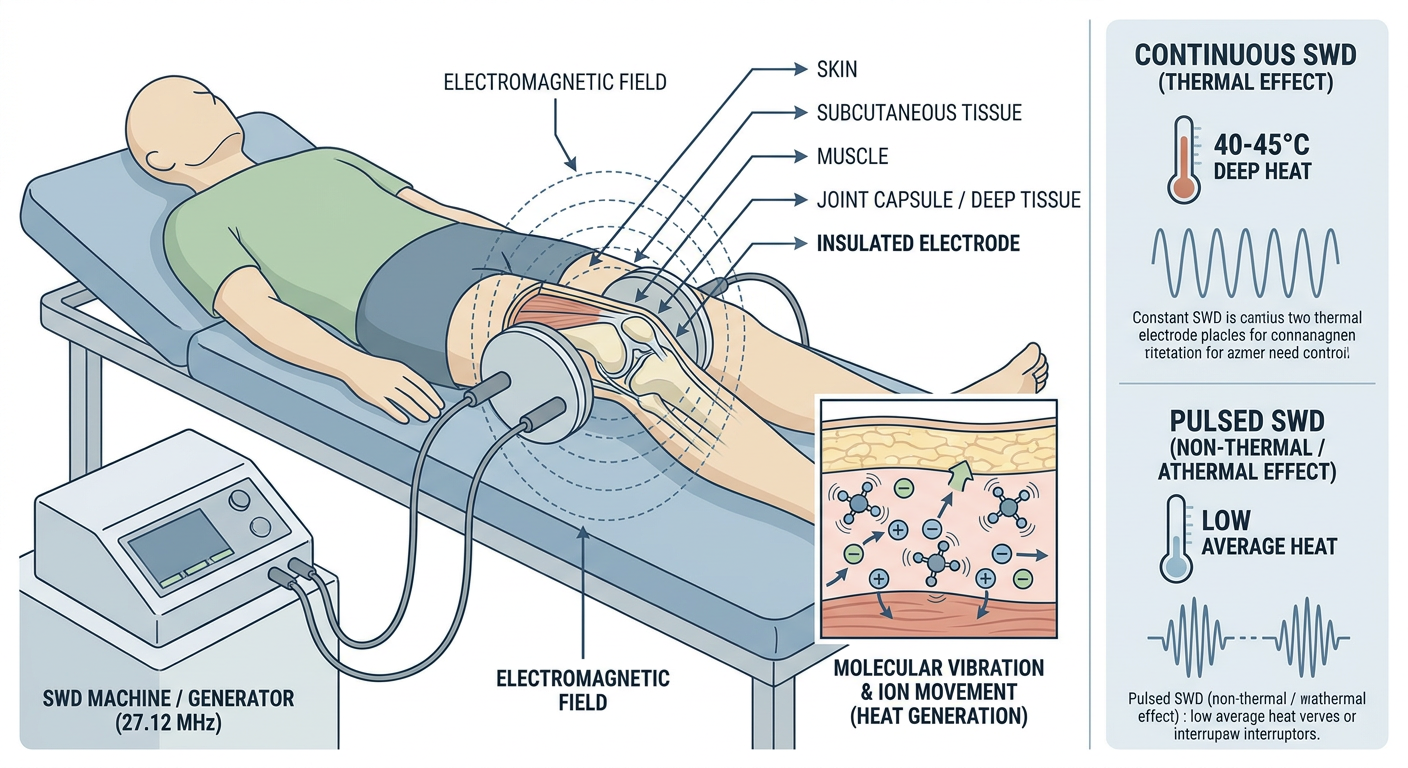
- The SWD machine/generator produces high-frequency electromagnetic energy at 27.12 MHz
- Energy travels through leads to two electrode plates placed on either side of the body part
- The electromagnetic field passes through all tissue layers between the electrodes - skin, subcutaneous fat, muscle, and joint
- The alternating electromagnetic field causes ions to oscillate and polar molecules (like water) to rotate rapidly
- This molecular friction generates heat from within the tissue, not from the surface
- Deep structures (muscle, joint) heat up to 40-45°C therapeutically
| Mode | Output | Effect |
|---|---|---|
| Continuous | Uninterrupted waves | Thermal heating (40-45°C) |
| Pulsed | Bursts with off-periods | Non-thermal/athermal - biological cellular effects without significant heat |
Swd machine diagram
short wave diathermy SWD machine diagram
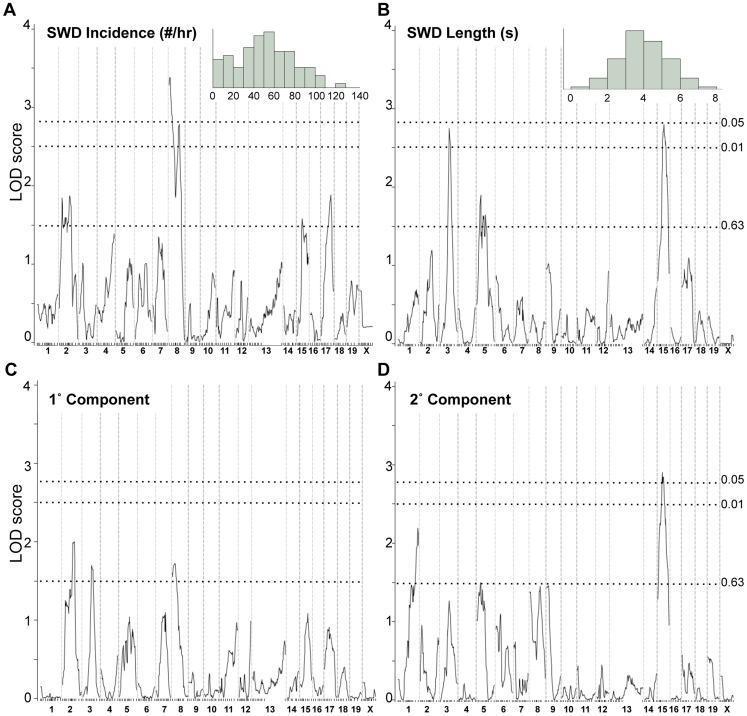
This four-panel pathophysiology diagram displays genome-wide interval mapping LOD score plots from a mouse model study (Gria4 backcross) investigating the genetic modifiers of spike-wave discharges (SWD), a hallmark of absence seizures. Each panel (A-D) represents a specific trait or its principal component: SWD incidence (Panel A), SWD length (Panel B), and the first two principal components (Panels C and D). The y-axis measures the Logarithm of the Odds (LOD) score (0–4), while the x-axis represents chromosomes 1 through 19 and the X chromosome. Horizontal dotted lines indicate genome-wide significance thresholds (p-values of 0.63, 0.01, and 0.05). Key findings include a significant peak for SWD incidence on chromosome 8 and a major peak for SWD length on chromosome 15, suggesting distinct genetic loci regulate frequency versus duration of seizure activity. Panels A and B contain inset histograms showing the raw frequency distribution for incidence (#/hr) and length (seconds). This visualization facilitates the identification of Quantitative Trait Loci (QTL) associated with epilepsy-related phenotypes.
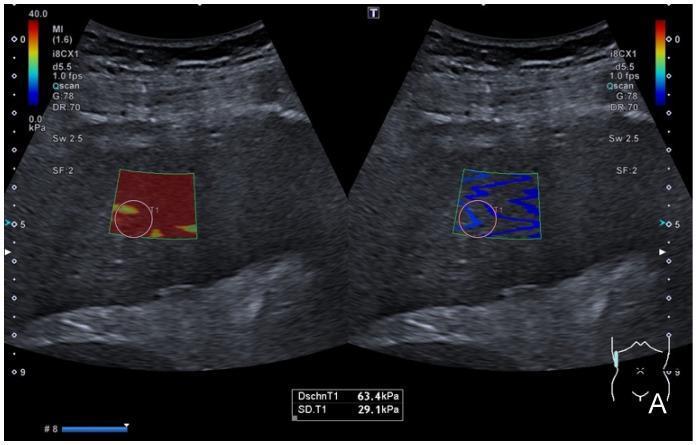
This diagnostic image consists of side-by-side ultrasound frames demonstrating 2D Shear Wave Elastography (SWE) and Shear Wave Dispersion (SWD) of the liver in an intercostal view. The left panel shows a color-coded elastogram map overlaid on a B-mode image. The sample window is predominantly red, indicating high tissue stiffness, with a circular Region of Interest (ROI) marked 'T1'. The right panel displays a corresponding shear wave mapping, showing inhomogeneous blue shades representing elevated shear wave speed. Quantitative data at the bottom indicates a liver stiffness value (DschnT1) of 63.4 kPa with a standard deviation (SD.T1) of 29.1 kPa, findings consistent with advanced liver fibrosis or cirrhosis. System parameters displayed at the top-left include a Mechanical Index (MI) of 1.6 and a frame rate of 1.0 fps. A color scale on the far left correlates red with high stiffness (40.0 kPa) and blue with low stiffness (0.0 kPa). A schematic diagram in the lower right corner indicates the probe position on the patient's right abdomen.
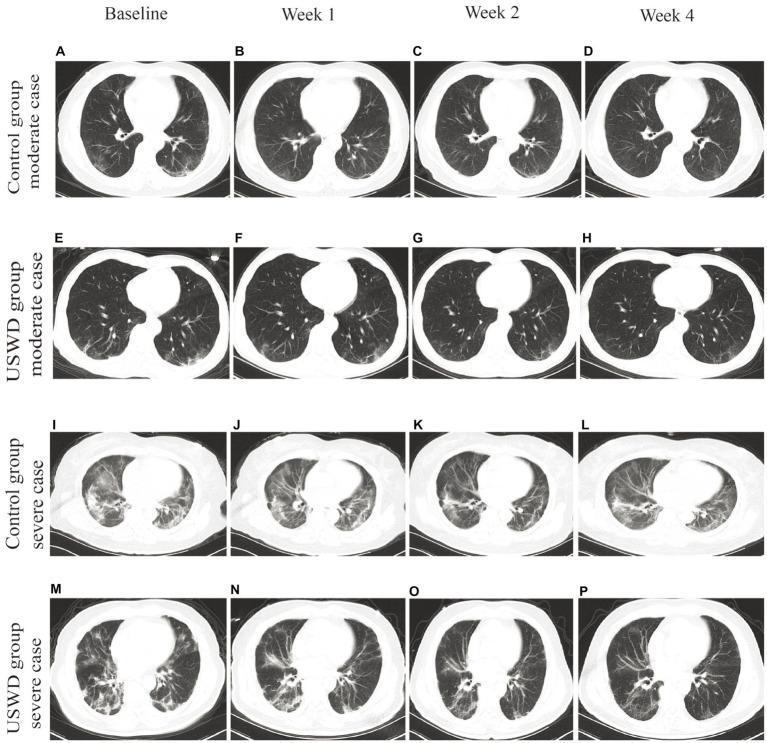
This diagnostic image is a longitudinal series of axial chest CT scans (lung window) demonstrating the progression of pulmonary pathology in patients with COVID-19. The layout is organized into a grid comparing a control group and an Ultra-Short Wave Diathermy (USWD) intervention group across moderate and severe disease classifications at four time points: baseline, Week 1, Week 2, and Week 4. In moderate cases (A-H), initial bilateral ground-glass opacities (GGOs), predominantly in the lower lobes and peripheral regions, show gradual resolution over the four-week period. In severe cases (I-P), the baseline scans (I, M) reveal extensive bilateral GGOs, consolidation, and early fibrotic changes. The time-series progression demonstrates varying rates of clearing. In the USWD severe group (M-P), there is a notable reduction in opacity and consolidation density by Week 4 compared to the control severe group (I-L), where residual stripe shadows and local pleural thickening persist. This visual comparison illustrates the natural history of COVID-19 pneumonia and the potential impact of therapeutic interventions on the rate of pulmonary tissue recovery.
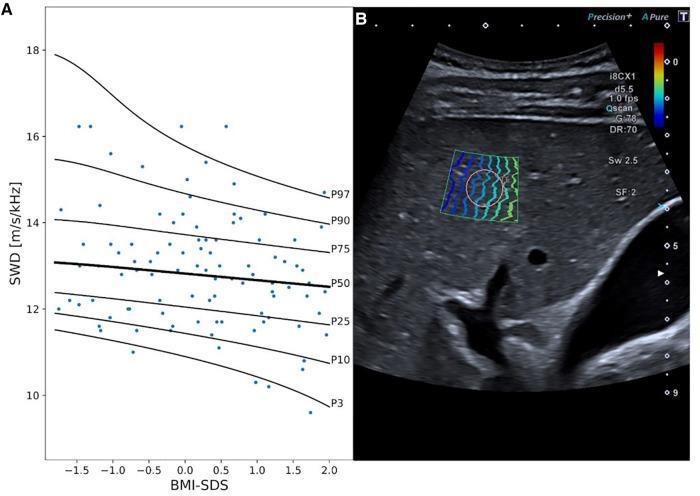
This composite educational graphic focuses on liver Shear Wave Dispersion (SWD) measurements, a diagnostic technique used to assess liver tissue viscosity and inflammation. Panel A presents a scatter plot with reference curves showing the relationship between SWD values (measured in m/s/kHz) and Body Mass Index Standard Deviation Score (BMI-SDS) in a pediatric population. The graph displays percentile curves (P3, P10, P25, P50, P75, P90, and P97), illustrating a general trend where SWD values decrease as BMI-SDS increases. Panel B provides a corresponding B-mode ultrasound image of a liver, utilizing a curvilinear transducer. A color-coded shear wave dispersion map is overlaid on the liver parenchyma, featuring a circular region of interest (ROI) for measurement. The interface displays technical parameters including mechanical index, gain (G:78), dynamic range (DR:70), and shear wave frequency (Sw 2.5). This material is relevant for pediatric hepatology and radiology, demonstrating the clinical application of ultrasound elastography and viscosity imaging in healthy and potentially symptomatic children.
A detailed labeled technical diagram of a Short Wave Diathermy (SWD) machine showing all its components. Include: the main control unit/console with frequency display (27.12 MHz), power output dial, timer, mode selector (continuous/pulsed), intensity control knob, tuning indicator. Show the cable leads connecting to two types of electrodes: capacitor plate electrodes (two flat paddles) and inductive coil electrode (drum/pancake electrode). Label the oscillator circuit, power amplifier, patient circuit, and the resonance tuning mechanism. Also show a patient applicator setup with the condenser field method (plates on either side of body part) and induction field method (coil wrapped around limb). Use a clean, professional medical equipment illustration style with clear labels and arrows pointing to each component. Include a small circuit block diagram showing: Mains power → Oscillator (27.12 MHz) → Power Amplifier → Patient Circuit → Electrodes.
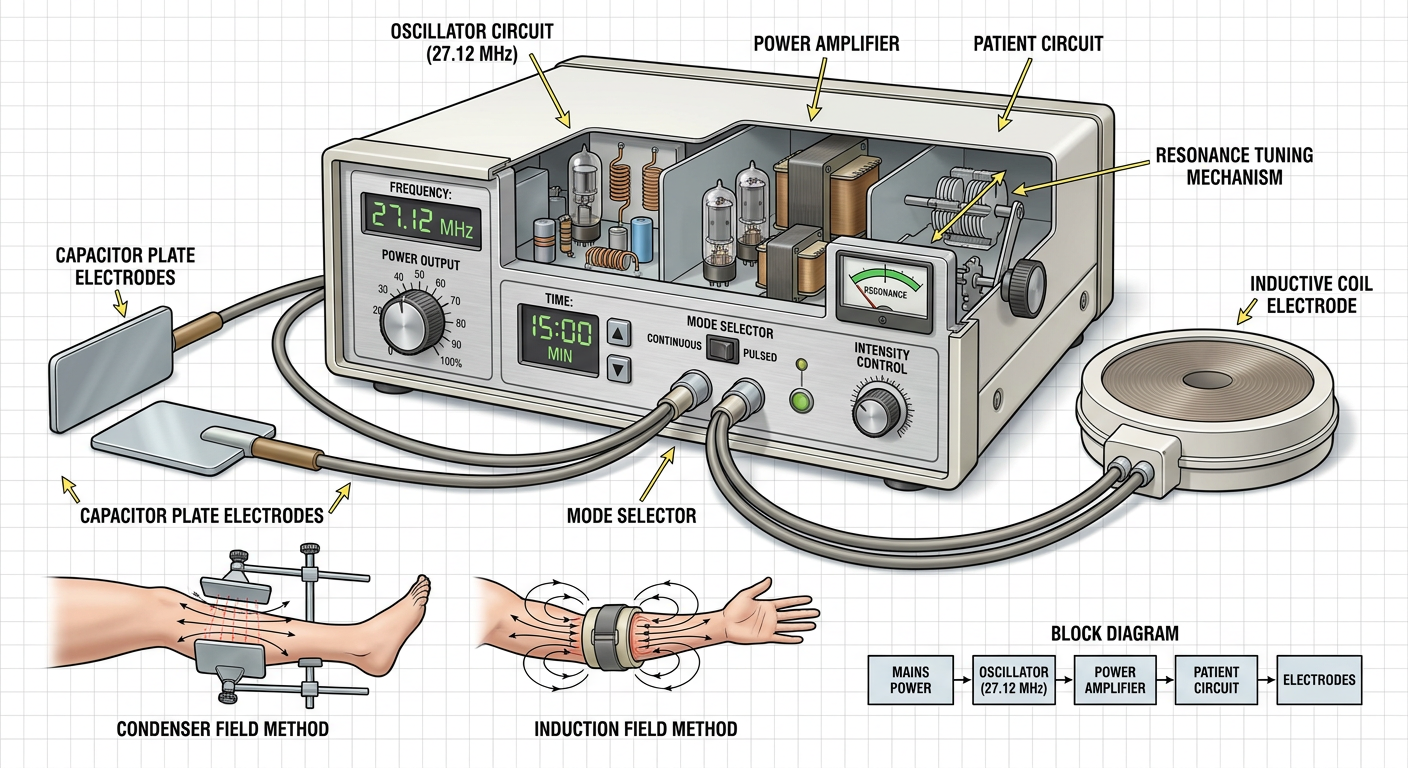
Key Components of an SWD Machine
| Component | Function |
|---|---|
| Oscillator (27.12 MHz) | Generates the high-frequency electromagnetic signal |
| Power Amplifier | Boosts the signal to therapeutic levels |
| Timer | Sets treatment duration (typically 15-20 min) |
| Intensity/Output Dial | Controls power output (Watts) |
| Mode Selector | Switches between Continuous and Pulsed modes |
| Tuning Indicator | Ensures resonance between machine and patient circuit |
- Condenser/Capacitor Plate Electrodes - Two flat paddle plates placed on either side of the body part; creates an electric field between them
- Inductive Coil (Drum/Pancake Electrode) - A flat coil placed over the target area; creates a magnetic field that induces eddy currents in tissues
Mains Power → Oscillator (27.12 MHz) → Power Amplifier → Patient Circuit → Electrodes → Tissue Heating
Easy exam oriented diagram
A simple, clean, exam-oriented flowchart diagram of Short Wave Diathermy (SWD) for physiotherapy students. Use a white background with bold black text and colored boxes. Layout as a structured study diagram with these sections clearly separated: TOP: Title box "SHORT WAVE DIATHERMY (SWD)" in large bold text SECTION 1 - DEFINITION box: "Application of high-frequency electromagnetic energy (27.12 MHz) to body tissues to produce thermal & non-thermal effects" SECTION 2 - CIRCUIT FLOW (left to right arrow diagram): [Mains Supply] → [Oscillator 27.12 MHz] → [Power Amplifier] → [Patient Circuit] → [Electrodes] → [Tissues] SECTION 3 - TWO METHODS side by side: Left box (blue): "CONDENSER METHOD - Electric field - Plate electrodes on either side - Heats tissues with high resistivity (fat, bone)" Right box (orange): "INDUCTOTHERMY METHOD - Magnetic field - Coil/drum electrode - Heats tissues with high conductivity (muscle, blood)" SECTION 4 - TWO MODES side by side: Left box (red): "CONTINUOUS SWD - Uninterrupted output - THERMAL effect - Temp 40-45°C - Pain, stiffness" Right box (green): "PULSED SWD - Interrupted output - NON-THERMAL effect - No significant heat - Acute inflammation, edema" SECTION 5 - EFFECTS box: "↑ Blood flow | ↓ Pain | ↓ Muscle spasm | ↓ Joint stiffness | ↑ Tissue healing" SECTION 6 - CONTRAINDICATIONS box (red border): "Metal implants | Pacemaker | Malignancy | Pregnancy | Impaired sensation | Active infection" Clean flowchart style, easy to memorize, exam-ready, no decorative elements, high contrast text
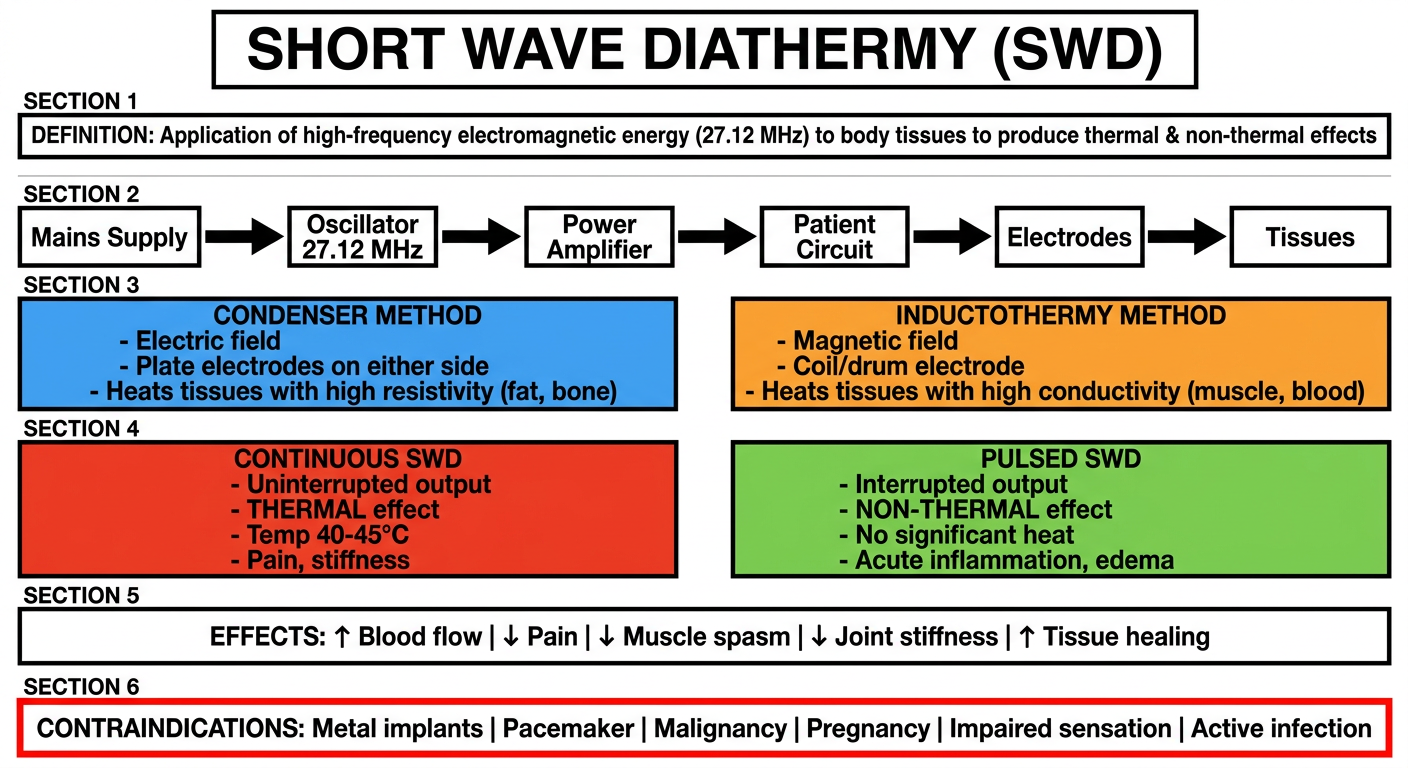
Oscillator → Condenser/Coil → Patient circuit → Electrodes → Tissues → Changes (physiological)
- Condenser = Electric field = fat/bone (high resistivity)
- Inductothermy = Magnetic field = muscle/blood (high conductivity)
Metal, Malignancy, Pacemaker + Acute infection, Impaired sensation, (preg)Snancy (pregnancy)